Mga Batayang Estadistika
| Pemilik Institusional | 143 total, 143 long only, 0 short only, 0 long/short - change of -2.05% MRQ |
| Alokasi Portofolio Rata-rata | 0.5427 % - change of 21.14% MRQ |
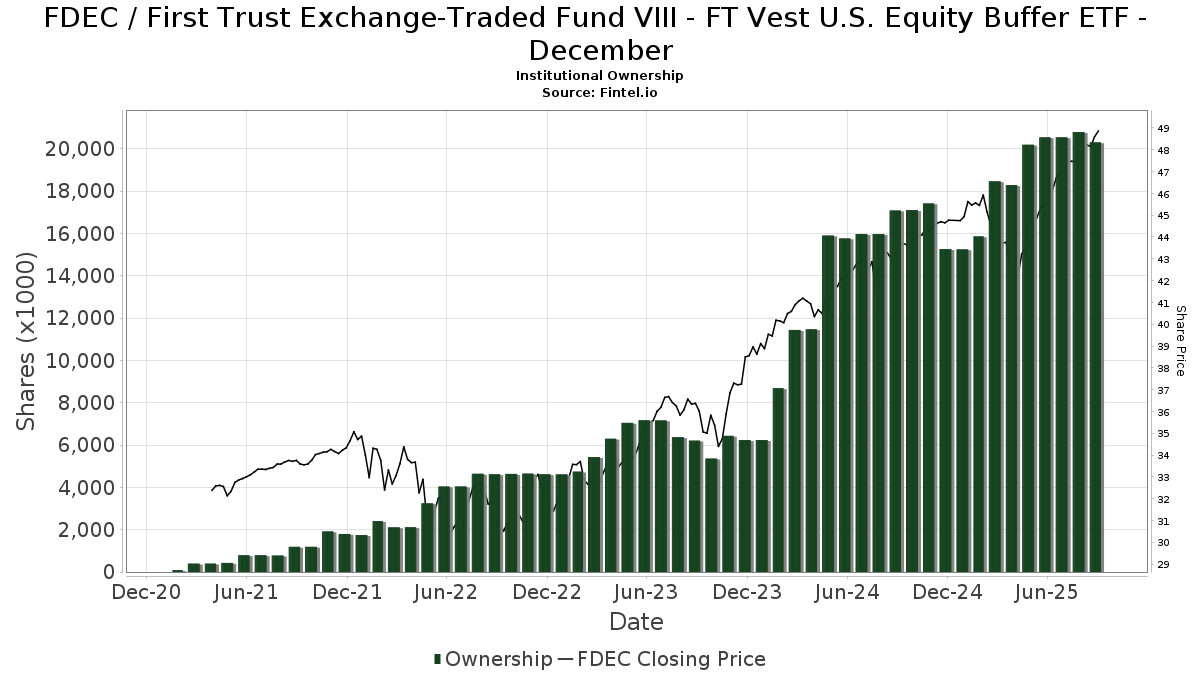
| Saham Institusional (Jangka Panjang) | 20,308,284 (ex 13D/G) - change of -0.23MM shares -1.13% MRQ |
| Nilai Institusional (Jangka Panjang) | $ 863,232 USD ($1000) |
Kepemilikan Institusional dan Pemegang Saham
First Trust Exchange-Traded Fund VIII - FT Vest U.S. Equity Buffer ETF - December (US:FDEC) memiliki 143 pemilik institusional dan pemegang saham yang telah mengajukan formulir 13D/G atau 13F kepada Komisi Bursa Efek (Securities Exchange Commission/SEC). Lembaga-lembaga ini memegang total 20,308,284 saham. Pemegang saham terbesar meliputi BUFR - FT Cboe Vest Fund of Buffer ETFs, BUFG - FT Cboe Vest Buffered Allocation Growth ETF, Envestnet Asset Management Inc, Grant Private Wealth Management Inc, Griffith & Werner, Inc., Commonwealth Equity Services, Llc, Cwm, Llc, Cetera Investment Advisers, Raymond James Financial Inc, and Advisor Group Holdings, Inc. .
Struktur kepemilikan institusional First Trust Exchange-Traded Fund VIII - FT Vest U.S. Equity Buffer ETF - December (BATS:FDEC) menunjukkan posisi terkini di perusahaan oleh institusi dan dana, serta perubahan terbaru dalam ukuran posisi. Pemegang saham utama dapat mencakup investor individu, reksa dana, dana lindung nilai, atau institusi. Jadwal 13D menunjukkan bahwa investor memegang (atau pernah memegang) lebih dari 5% saham perusahaan dan bermaksud (atau pernah bermaksud) untuk secara aktif mengejar perubahan strategi bisnis. Jadwal 13G menunjukkan investasi pasif lebih dari 5%.
The share price as of September 5, 2025 is 48.28 / share. Previously, on September 6, 2024, the share price was 42.74 / share. This represents an increase of 12.97% over that period.
Skor Sentimen Dana
Skor Sentimen Dana (sebelumnya dikenal sebagai Skor Akumulasi Kepemilikan) menemukan saham-saham yang paling banyak dibeli oleh dana. Ini adalah hasil dari model kuantitatif multi-faktor yang canggih yang mengidentifikasi perusahaan dengan tingkat akumulasi institusional tertinggi. Model penilaian menggunakan kombinasi dari total peningkatan pemilik yang diungkapkan, perubahan dalam alokasi portofolio pada pemilik tersebut, dan metrik lainnya. Angka berkisar dari 0 hingga 100, dengan angka yang lebih tinggi menunjukkan tingkat akumulasi yang lebih tinggi dibandingkan dengan perusahaan sejenisnya, dan 50 adalah rata-ratanya.
Frekuensi Pembaruan: Setiap Hari
Lihat Ownership Explorer, yang menyediakan daftar perusahaan dengan peringkat tertinggi.
Rasio Put/Call Institusional
Selain melaporkan isu ekuitas dan utang standar, institusi dengan aset di bawah manajemen lebih dari 100 juta dolar AS juga harus mengungkapkan kepemilikan opsi put dan call mereka. Karena opsi put umumnya menunjukkan sentimen negatif, dan opsi call menunjukkan sentimen positif, kita dapat mengetahui sentimen institusional secara keseluruhan dengan memplot rasio put terhadap call. Grafik di sebelah kanan memplot rasio put/call historis untuk instrumen ini.
Menggunakan Rasio Put/Call sebagai indikator sentimen investor mengatasi salah satu kekurangan utama dari penggunaan total kepemilikan institusional, yaitu sejumlah besar aset yang dikelola diinvestasikan secara pasif untuk melacak indeks. Dana yang dikelola secara pasif biasanya tidak membeli opsi, sehingga indikator rasio put/call lebih akurat dalam melacak sentimen dana yang dikelola secara aktif.
Pengajuan 13D/G
Kami menyajikan pengajuan 13D/G secara terpisah dari pengajuan 13F karena perlakuan yang berbeda oleh SEC. Pengajuan 13D/G dapat diajukan oleh kelompok investor (dengan satu pemimpin), sedangkan pengajuan 13F tidak bisa. Hal ini mengakibatkan situasi di mana seorang investor dapat mengajukan 13D/G yang melaporkan satu nilai untuk total saham (mewakili semua saham yang dimiliki oleh kelompok investor), tetapi kemudian mengajukan 13F yang melaporkan nilai yang berbeda untuk total saham (mewakili kepemilikan mereka sendiri). Ini berarti bahwa kepemilikan saham dari pengajuan 13D/G dan pengajuan 13F seringkali tidak dapat dibandingkan secara langsung, sehingga kami menyajikannya secara terpisah.
Catatan: Mulai 16 Mei 2021, kami tidak lagi menampilkan pemilik yang belum mengajukan 13D/G dalam setahun terakhir. Sebelumnya, kami menampilkan riwayat lengkap pengajuan 13D/G. Secara umum, entitas yang diwajibkan untuk mengajukan pengajuan 13D/G harus mengajukan setidaknya setiap tahun sebelum mengirimkan pengajuan penutupan. Namun, terkadang dana keluar dari posisi tanpa mengirimkan pengajuan penutupan (misalnya, mereka menghentikan operasi), sehingga menampilkan riwayat lengkap terkadang menyebabkan kebingungan tentang kepemilikan saat ini. Untuk mencegah kebingungan, kami sekarang hanya menampilkan pemilik 'saat ini' - yaitu - pemilik yang telah mengajukan dalam setahun terakhir.
Upgrade to unlock premium data.
| Tanggal File | Formulir | Investor | Sebelumnya Saham |
Terbaru Saham |
Δ Saham (Persen) |
Kepemilikan (Persen) |
Δ Pagmamay-ari (Persen) |
|
|---|---|---|---|---|---|---|---|---|
| 2025-07-21 | FIRST TRUST PORTFOLIOS LP | 12,143,569 | 13,173,244 | 8.48 | 60.15 | 4.65 |
Pengajuan 13F dan NPORT
Detail pada pengajuan 13F tersedia gratis. Detail pada pengajuan NP memerlukan keanggotaan premium. Baris berwarna hijau menunjukkan posisi baru. Baris berwarna merah menunjukkan posisi yang sudah ditutup. Klik tautan ini ikon untuk melihat riwayat transaksi selengkapnya.
Tingkatkan
untuk membuka data premium dan mengekspor ke Excel ![]() .
.
| Tanggal File | Sumber | Investor | Ketik | Presyo ng Avg (Silangan) |
Saham | Δ Saham (%) |
Dilaporkan Nilai ($1000) |
Nilai Δ (%) |
Alokasi Port (%) |
|
|---|---|---|---|---|---|---|---|---|---|---|
| 2025-08-14 | 13F | Mariner, LLC | 18,889 | -3.82 | 881 | 3.40 | ||||
| 2025-08-13 | 13F | Grantvest Financial Group LLC | 21,978 | -5.18 | 1,026 | 1.89 | ||||
| 2025-08-13 | 13F | Brown Advisory Inc | 6,316 | 0.00 | 295 | 7.30 | ||||
| 2025-08-04 | 13F | Arbor Capital Management Inc /adv | 10,046 | -4.21 | 475 | 3.95 | ||||
| 2025-08-04 | 13F | Buck Wealth Strategies, LLC | 5,250 | 245 | ||||||
| 2025-07-10 | 13F | Signal Advisors Wealth, LLC | 4,511 | -15.46 | 211 | -9.09 | ||||
| 2025-07-28 | 13F | RFG Advisory, LLC | 17,228 | 211.88 | 804 | 235.98 | ||||
| 2025-08-14 | 13F/A | Rockefeller Capital Management L.P. | 29,888 | -37.38 | 1,395 | -32.69 | ||||
| 2025-08-14 | 13F | CoreCap Advisors, LLC | 13,885 | 6.90 | 648 | 14.92 | ||||
| 2025-07-07 | 13F | Schulz Wealth, LTD. | 153,514 | -2.53 | 7,164 | 4.80 | ||||
| 2025-07-31 | 13F | Hanlon Investment Management, Inc. | 12,759 | 39.73 | 595 | 50.25 | ||||
| 2025-08-08 | 13F | Bouchey Financial Group Ltd | 0 | -100.00 | 0 | |||||
| 2025-08-08 | 13F | Tanglewood Legacy Advisors, LLC | 30,703 | 0.00 | 1,433 | 7.51 | ||||
| 2025-03-06 | 13F | Plotkin Financial Advisors, LLC | 0 | -100.00 | 0 | |||||
| 2025-07-10 | 13F | Wealth Enhancement Advisory Services, Llc | 8,841 | -18.03 | 415 | -11.32 | ||||
| 2025-08-07 | 13F | PFG Advisors | 4,869 | 227 | ||||||
| 2025-08-19 | 13F | National Asset Management, Inc. | 0 | -100.00 | 0 | |||||
| 2025-07-15 | 13F | Pitti Group Wealth Management, LLC | 9,720 | -0.04 | 454 | 7.35 | ||||
| 2025-07-25 | NP | BUFR - FT Cboe Vest Fund of Buffer ETFs This fund is a listed as child fund of First Trust Advisors Lp and if that institution has disclosed ownership in this security, then these positions will not be double counted when calculating total shares and total value | 12,205,643 | 1.88 | 550,188 | 1.94 | ||||
| 2025-07-17 | 13F | Wagner Wealth Management, Llc | 3,000 | 0.00 | 140 | 7.69 | ||||
| 2025-07-16 | 13F | Octavia Wealth Advisors, LLC | 4,437 | 207 | ||||||
| 2025-08-08 | 13F | Share Andrew L. | 7,650 | 0.00 | 357 | 7.23 | ||||
| 2025-08-12 | 13F | Wood Tarver Financial Group, LLC | 526 | 0.00 | 0 | -100.00 | ||||
| 2025-08-14 | 13F | Susquehanna International Group, Llp | 0 | -100.00 | 0 | |||||
| 2025-04-30 | 13F | Allworth Financial LP | 0 | -100.00 | 0 | |||||
| 2025-07-18 | 13F | SOA Wealth Advisors, LLC. | 8,068 | 0.00 | 377 | 7.43 | ||||
| 2025-08-13 | 13F | Capital Analysts, Inc. | 2,440 | -6.55 | 0 | |||||
| 2025-08-14 | 13F | Citadel Advisors Llc | 4,344 | -68.20 | 203 | -65.88 | ||||
| 2025-07-25 | 13F | Apollon Wealth Management, LLC | 8,687 | 5.66 | 405 | 13.76 | ||||
| 2025-08-08 | 13F | Pnc Financial Services Group, Inc. | 10,593 | -5.28 | 494 | 1.86 | ||||
| 2025-08-14 | 13F/A | Barclays Plc | 3,490 | 201.90 | 0 | |||||
| 2025-08-04 | 13F | Savvy Advisors, Inc. | 7,587 | 0.00 | 354 | 7.60 | ||||
| 2025-09-04 | 13F/A | Advisor Group Holdings, Inc. | 233,312 | -38.24 | 10,794 | -34.17 | ||||
| 2025-04-21 | 13F | Envestnet Portfolio Solutions, Inc. | 0 | -100.00 | 0 | |||||
| 2025-08-14 | 13F | UBS Group AG | 12,172 | 2,354.03 | 568 | 2,604.76 | ||||
| 2025-08-12 | 13F | CIBC Private Wealth Group, LLC | 0 | -100.00 | 0 | |||||
| 2025-08-14 | 13F | Wiley Bros.-aintree Capital, Llc | 4,886 | 0.00 | 228 | 8.57 | ||||
| 2025-05-01 | 13F | Bleakley Financial Group, LLC | 0 | -100.00 | 0 | -100.00 | ||||
| 2025-07-15 | 13F | McCarthy & Cox | 8,614 | 0.00 | 402 | 7.51 | ||||
| 2025-08-12 | 13F | Change Path, LLC | 180,625 | -1.66 | 8,429 | 5.73 | ||||
| 2025-04-14 | 13F | Griffith & Werner, Inc. | 558,364 | 7.60 | 24,235 | 4.77 | ||||
| 2025-07-30 | 13F | Strategic Blueprint, LLC | 16,412 | 23.39 | 766 | 32.58 | ||||
| 2025-08-11 | 13F | Cornerstone Planning Group LLC | 3,228 | -6.11 | 152 | 5.56 | ||||
| 2025-08-11 | 13F | Aptus Capital Advisors, LLC | 2,000 | 0.00 | 93 | 8.14 | ||||
| 2025-08-05 | 13F | Integrity Financial Corp /WA | 31,250 | -0.41 | 1,458 | 7.13 | ||||
| 2025-08-13 | 13F | VestGen Advisors, LLC | 5,162 | 0.00 | 245 | 8.93 | ||||
| 2025-08-14 | 13F | Ambassador Advisors, LLC | 54,282 | -0.21 | 2,533 | 7.29 | ||||
| 2025-07-30 | 13F | WESPAC Advisors SoCal, LLC | 5,224 | -4.57 | 244 | 2.53 | ||||
| 2025-08-08 | 13F | Foundations Investment Advisors, LLC | 19,710 | 920 | ||||||
| 2025-08-11 | 13F | Principal Securities, Inc. | 1,060 | 67.99 | 49 | 75.00 | ||||
| 2025-07-09 | 13F | Keystone Wealth Services, LLC | 66,672 | 1.37 | 3,111 | 9.00 | ||||
| 2025-05-16 | 13F | Coppell Advisory Solutions LLC | 0 | -100.00 | 0 | |||||
| 2025-07-31 | 13F | Cambridge Investment Research Advisors, Inc. | 103,799 | -38.50 | 5 | -42.86 | ||||
| 2025-08-08 | 13F | Cetera Investment Advisers | 372,072 | 6.74 | 17,363 | 14.76 | ||||
| 2025-08-08 | 13F | 1776 Wealth LLC | 23,257 | 0.00 | 1,085 | 7.53 | ||||
| 2025-07-30 | 13F | Brookstone Capital Management | 14,423 | 8.59 | 673 | 16.84 | ||||
| 2025-08-12 | 13F | Global Retirement Partners, LLC | 575 | -99.47 | 27 | -99.46 | ||||
| 2025-08-14 | 13F | Jane Street Group, Llc | 6,226 | -67.22 | 291 | -64.81 | ||||
| 2025-08-13 | 13F/A | StoneX Group Inc. | 11,753 | -11.52 | 414 | -13.60 | ||||
| 2025-07-30 | 13F | BlueChip Wealth Advisors LLC | 20,000 | 20.19 | 933 | 29.22 | ||||
| 2025-08-12 | 13F | Park Square Financial Group, LLC | 571 | 0.00 | 27 | 8.33 | ||||
| 2025-07-11 | 13F | Farther Finance Advisors, LLC | 15,719 | 73.04 | 734 | 85.57 | ||||
| 2025-07-16 | 13F | NovaPoint Capital, LLC | 99,091 | -2.85 | 4,624 | 4.45 | ||||
| 2025-07-09 | 13F | Fragasso Group Inc. | 6,209 | -30.74 | 290 | -25.71 | ||||
| 2025-08-12 | 13F | PKS Advisory Services, LLC | 9,093 | -0.76 | 424 | 6.80 | ||||
| 2025-07-08 | 13F | Nbc Securities, Inc. | 4,723 | 8.85 | 0 | |||||
| 2025-08-04 | 13F | Spire Wealth Management | 1,100 | 0.00 | 51 | 8.51 | ||||
| 2025-08-14 | 13F | Old Mission Capital Llc | 0 | -100.00 | 0 | |||||
| 2025-08-14 | 13F | Goldman Sachs Group Inc | 0 | -100.00 | 0 | |||||
| 2025-07-11 | 13F | Grant Private Wealth Management Inc | 604,354 | 28,203 | ||||||
| 2025-08-06 | 13F | Wedbush Securities Inc | 8,264 | 0.00 | 0 | |||||
| 2025-05-15 | 13F | Gts Securities Llc | 0 | -100.00 | 0 | |||||
| 2025-08-15 | 13F | Kestra Advisory Services, LLC | 114,233 | 5.89 | 5,331 | 13.84 | ||||
| 2025-08-04 | 13F | Atria Investments Llc | 46,171 | 36.35 | 2,155 | 46.63 | ||||
| 2025-08-15 | 13F | Morgan Stanley | 1,687 | 6.84 | 79 | 14.71 | ||||
| 2025-07-14 | 13F | Chris Bulman Inc | 4,290 | 200 | ||||||
| 2025-07-16 | 13F | Novem Group | 80,935 | -2.50 | 3,777 | 4.83 | ||||
| 2025-07-17 | 13F | Wolff Wiese Magana Llc | 193 | 0.00 | 9 | 12.50 | ||||
| 2025-07-14 | 13F | Sowell Financial Services LLC | 8,398 | -2.94 | 392 | 4.27 | ||||
| 2025-07-23 | 13F | Heck Capital Advisors, LLC | 0 | -100.00 | 0 | |||||
| 2025-07-30 | 13F | Avidian Wealth Solutions, LLC | 6,598 | 0.00 | 308 | 7.34 | ||||
| 2025-08-06 | 13F | Valtinson Bruner Financial Planning LLC | 22,883 | 4.62 | 1,068 | 12.43 | ||||
| 2025-08-12 | 13F | Archer Investment Corp | 4,041 | 0.00 | 189 | 7.43 | ||||
| 2025-07-21 | 13F | Catalina Capital Group, LLC | 18,861 | 0.00 | 880 | 7.58 | ||||
| 2025-07-30 | 13F | TFB Advisors LLC | 16,649 | -14.90 | 777 | -8.60 | ||||
| 2025-08-04 | 13F | Assetmark, Inc | 198,308 | 32.71 | 9,254 | 42.70 | ||||
| 2025-08-07 | 13F | Kestra Private Wealth Services, Llc | 17,000 | -6.95 | 793 | 0.13 | ||||
| 2025-08-14 | 13F | Financial Network Wealth Advisors LLC | 5,900 | 0.00 | 275 | 7.42 | ||||
| 2025-08-04 | 13F | Family Wealth Group, LLC | 28,614 | -3.18 | 1,335 | 4.13 | ||||
| 2025-07-02 | 13F | HBW Advisory Services LLC | 4,974 | 0.00 | 232 | 7.91 | ||||
| 2025-08-07 | 13F | Encompass More Asset Management | 0 | -100.00 | 0 | |||||
| 2025-08-14 | 13F | Integrated Wealth Concepts LLC | 5,875 | 0.00 | 274 | 7.45 | ||||
| 2025-08-14 | 13F | GWM Advisors LLC | 35,958 | -1.67 | 1,678 | 5.73 | ||||
| 2025-08-12 | 13F | NWF Advisory Services Inc. | 4,965 | -4.61 | 216 | -7.33 | ||||
| 2025-08-12 | 13F | Leigh Baldwin & Co., Llc | 46,818 | 2.96 | 2,185 | 10.69 | ||||
| 2025-08-14 | 13F | Mml Investors Services, Llc | 125,454 | -7.71 | 6 | 0.00 | ||||
| 2025-08-06 | 13F | Prospera Financial Services Inc | 12,945 | 2.11 | 604 | 9.82 | ||||
| 2025-08-11 | 13F | Blue Bell Private Wealth Management, Llc | 17,171 | -1.52 | 801 | 5.95 | ||||
| 2025-08-13 | 13F | Townsquare Capital Llc | 0 | -100.00 | 0 | |||||
| 2025-07-25 | NP | BUFG - FT Cboe Vest Buffered Allocation Growth ETF This fund is a listed as child fund of First Trust Advisors Lp and if that institution has disclosed ownership in this security, then these positions will not be double counted when calculating total shares and total value | 808,650 | -7.90 | 36,451 | -7.84 | ||||
| 2025-07-21 | 13F | Ameritas Advisory Services, LLC | 22,519 | -25.65 | 1,051 | -20.87 | ||||
| 2025-08-12 | 13F | LPL Financial LLC | 156,526 | 23.53 | 7,305 | 32.82 | ||||
| 2025-07-28 | 13F | Mutual Advisors, LLC | 7,154 | -8.46 | 341 | 1.49 | ||||
| 2025-05-07 | 13F | Prosperity Consulting Group, LLC | 0 | -100.00 | 0 | |||||
| 2025-08-06 | 13F | Founders Financial Securities Llc | 21,220 | 7.93 | 990 | 17.30 | ||||
| 2025-08-14 | 13F | Main Street Financial Solutions, LLC | 7,418 | 0.00 | 346 | 7.79 | ||||
| 2025-07-25 | 13F | We Are One Seven, LLC | 170,614 | 3.73 | 7,962 | 11.53 | ||||
| 2025-07-24 | 13F | IFP Advisors, Inc | 7,555 | 8.74 | 353 | 16.94 | ||||
| 2025-08-12 | 13F | Jpmorgan Chase & Co | 0 | -100.00 | 0 | |||||
| 2025-08-12 | 13F | SRS Capital Advisors, Inc. | 725 | 34 | ||||||
| 2025-08-06 | 13F | Commonwealth Equity Services, Llc | 493,839 | -5.89 | 23 | 4.55 | ||||
| 2025-08-12 | 13F | Proequities, Inc. | 0 | 0 | ||||||
| 2025-07-17 | 13F | Janney Montgomery Scott LLC | 176,243 | -5.06 | 8 | 0.00 | ||||
| 2025-07-15 | 13F | World Equity Group, Inc. | 11,943 | 4.14 | 557 | 12.07 | ||||
| 2025-08-15 | 13F | Captrust Financial Advisors | 18,327 | 0.00 | 855 | 7.55 | ||||
| 2025-08-14 | 13F | Gallagher Fiduciary Advisors, LLC | 14,613 | 46.47 | 682 | 57.27 | ||||
| 2025-08-12 | 13F | Winnow Wealth Llc | 0 | -100.00 | 0 | -100.00 | ||||
| 2025-08-18 | 13F | Wolverine Trading, Llc | 6,870 | 319 | ||||||
| 2025-07-18 | 13F | Truist Financial Corp | 101,514 | -22.60 | 4,737 | -16.78 | ||||
| 2025-05-09 | 13F | GeoWealth Management, LLC | 0 | -100.00 | 0 | |||||
| 2025-07-16 | 13F | Paragon Capital Management Ltd | 7,301 | -5.53 | 341 | 1.49 | ||||
| 2025-07-29 | 13F | Signature Estate & Investment Advisors Llc | 7,902 | 0.00 | 369 | 7.60 | ||||
| 2025-08-08 | 13F | Avantax Advisory Services, Inc. | 4,934 | -28.22 | 230 | -22.82 | ||||
| 2025-05-13 | 13F | Hartland & Co., LLC | 0 | -100.00 | 0 | |||||
| 2025-07-23 | 13F | Kingswood Wealth Advisors, Llc | 10,548 | -10.97 | 492 | -4.47 | ||||
| 2025-08-29 | 13F | Evolution Wealth Management Inc. | 1,735 | 81 | ||||||
| 2025-08-14 | 13F | Fortress Private Ledger, Llc | 23,670 | -3.20 | 1,105 | 4.05 | ||||
| 2025-08-12 | 13F | Steward Partners Investment Advisory, Llc | 32,294 | 9.12 | 1,507 | 17.37 | ||||
| 2025-07-28 | 13F | Harbour Investments, Inc. | 35,937 | 13.49 | 1,677 | 22.05 | ||||
| 2025-08-14 | 13F | Harvest Investment Services, LLC | 52,645 | -6.06 | 2,457 | 0.99 | ||||
| 2025-05-14 | 13F | Summit Financial Wealth Advisors, LLC | 8,952 | 0.00 | 389 | -3.96 | ||||
| 2025-08-14 | 13F | Raymond James Financial Inc | 254,133 | -3.86 | 11,859 | 3.36 | ||||
| 2025-08-04 | 13F | Creative Financial Designs Inc /adv | 4,099 | -1.42 | 191 | 6.11 | ||||
| 2025-08-11 | 13F | HighTower Advisors, LLC | 9,676 | 0.00 | 452 | 7.64 | ||||
| 2025-07-14 | 13F | Park Avenue Securities Llc | 4,618 | -3.15 | 0 | |||||
| 2025-08-14 | 13F | Sunbelt Securities, Inc. | 8,032 | 6.77 | 358 | 9.82 | ||||
| 2025-08-06 | 13F | Bullseye Investment Management, LLC | 25,367 | 0.00 | 1,101 | 0.00 | ||||
| 2025-07-23 | 13F | Clear Creek Financial Management, LLC | 10,891 | 0.00 | 508 | 7.63 | ||||
| 2025-07-25 | 13F | Cwm, Llc | 378,866 | -0.54 | 18 | 6.25 | ||||
| 2025-08-15 | 13F | Fsb Premier Wealth Management, Inc. | 7,857 | -9.48 | 367 | -2.66 | ||||
| 2025-07-14 | 13F | Signature Securities Group Corporation | 7,023 | -38.14 | 328 | -33.54 | ||||
| 2025-08-06 | 13F | AE Wealth Management LLC | 32,075 | -37.68 | 1,497 | -33.03 | ||||
| 2025-08-05 | 13F | GPS Wealth Strategies Group, LLC | 3,200 | 0.00 | 149 | 7.97 | ||||
| 2025-08-01 | 13F | Envestnet Asset Management Inc | 719,210 | 5.01 | 33,563 | 12.90 | ||||
| 2025-07-15 | 13F | Armis Advisers, LLC | 95,541 | -2.64 | 4,459 | 4.67 | ||||
| 2025-08-05 | 13F | Sigma Planning Corp | 79,567 | 73.56 | 3,713 | 86.68 | ||||
| 2025-08-04 | 13F | Arkadios Wealth Advisors | 73,561 | -14.39 | 3,433 | -7.96 | ||||
| 2025-07-09 | 13F | Central Valley Advisors, Llc | 4,392 | 205 | ||||||
| 2025-07-16 | 13F | ORG Partners LLC | 7,927 | 0.00 | 369 | 7.27 | ||||
| 2025-08-06 | 13F | Capasso Planning Partners LLC | 7,220 | -0.40 | 337 | 7.01 | ||||
| 2025-07-29 | 13F | Swmg, Llc | 8,111 | -0.02 | 386 | 10.92 | ||||
| 2025-08-14 | 13F | Snowden Capital Advisors LLC | 6,585 | 0.00 | 307 | 7.72 | ||||
| 2025-07-29 | 13F | Stephens Inc /ar/ | 140,448 | -55.67 | 6,554 | -52.34 | ||||
| 2025-08-11 | 13F | United Capital Financial Advisers, Llc | 0 | -100.00 | 0 | |||||
| 2025-05-15 | 13F | Advisory Services Network, LLC | 0 | -100.00 | 0 | |||||
| 2025-07-25 | 13F | Atria Wealth Solutions, Inc. | 0 | -100.00 | 0 | |||||
| 2025-08-29 | 13F | Centaurus Financial, Inc. | 18,638 | -0.86 | 1 | |||||
| 2025-08-08 | 13F/A | Ignite Planners, LLC | 52,411 | 11.27 | 2,469 | 20.85 | ||||
| 2025-07-21 | 13F | DHJJ Financial Advisors, Ltd. | 16,091 | -1.53 | 751 | 5.78 | ||||
| 2025-07-23 | 13F | REAP Financial Group, LLC | 75,601 | -5.30 | 3,528 | 1.82 | ||||
| 2025-08-12 | 13F | Ameritas Investment Partners, Inc. | 1,445 | 44.50 | 67 | 55.81 | ||||
| 2025-07-31 | 13F | Oppenheimer & Co Inc | 19,920 | -0.89 | 930 | 6.54 | ||||
| 2025-08-14 | 13F | Aqr Capital Management Llc | 9,600 | 0.00 | 448 | 7.45 | ||||
| 2025-08-14 | 13F | Murphy & Mullick Capital Management Corp | 500 | 0.00 | 24 | 9.52 | ||||
| 2025-07-15 | 13F | Mather Group, Llc. | 0 | -100.00 | 0 | |||||
| 2025-08-14 | 13F | Royal Bank Of Canada | 31,115 | -1.30 | 1,452 | 6.14 | ||||
| 2025-07-24 | 13F | McKinley Carter Wealth Services, Inc. | 34,931 | 0.00 | 1,630 | 7.52 |