Mga Batayang Estadistika
| Pemilik Institusional | 93 total, 93 long only, 0 short only, 0 long/short - change of 10.59% MRQ |
| Alokasi Portofolio Rata-rata | 0.8378 % - change of -10.39% MRQ |
| Saham Institusional (Jangka Panjang) | 21,514,870 (ex 13D/G) - change of -2.44MM shares -10.18% MRQ |
| Nilai Institusional (Jangka Panjang) | $ 1,315,826 USD ($1000) |
Kepemilikan Institusional dan Pemegang Saham
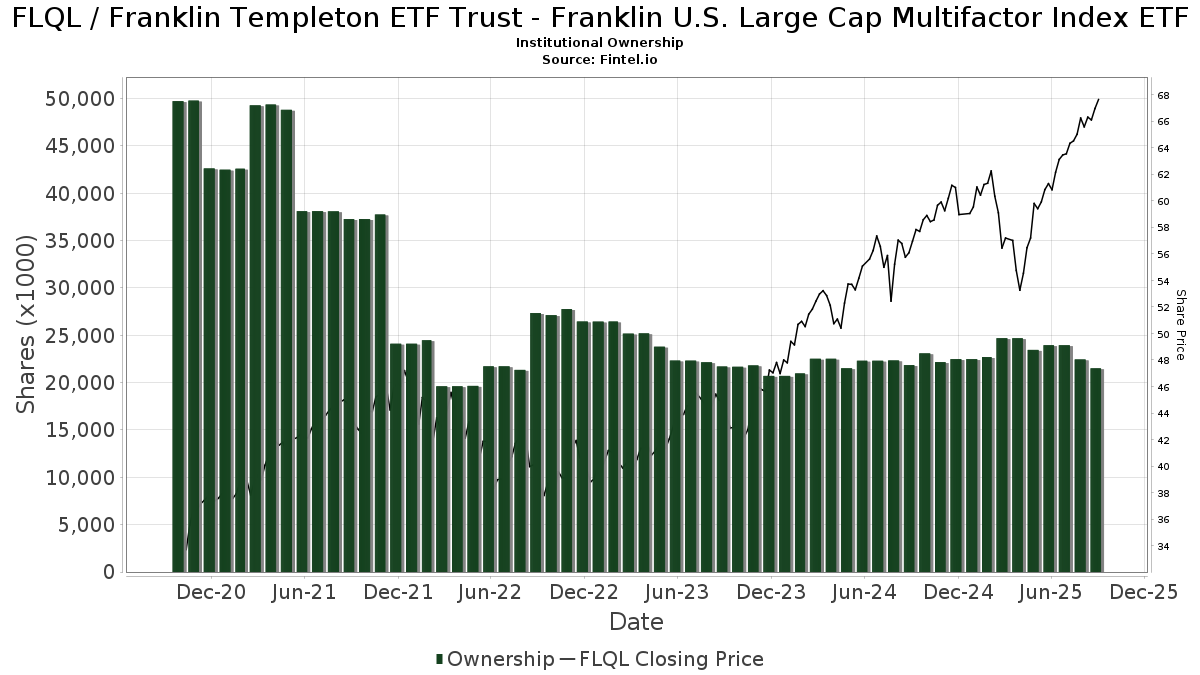
Franklin Templeton ETF Trust - Franklin U.S. Large Cap Multifactor Index ETF (US:FLQL) memiliki 93 pemilik institusional dan pemegang saham yang telah mengajukan formulir 13D/G atau 13F kepada Komisi Bursa Efek (Securities Exchange Commission/SEC). Lembaga-lembaga ini memegang total 21,514,870 saham. Pemegang saham terbesar meliputi Franklin Resources Inc, Bank Of America Corp /de/, FGTZX - Franklin Growth Allocation Fund Advisor Class, FMTZX - Franklin Moderate Allocation Fund Advisor Class, Steward Partners Investment Advisory, Llc, Bank of New York Mellon Corp, Morgan Stanley, LPL Financial LLC, FTCZX - Franklin Conservative Allocation Fund Advisor Class, and Janney Montgomery Scott LLC .
Struktur kepemilikan institusional Franklin Templeton ETF Trust - Franklin U.S. Large Cap Multifactor Index ETF (BATS:FLQL) menunjukkan posisi terkini di perusahaan oleh institusi dan dana, serta perubahan terbaru dalam ukuran posisi. Pemegang saham utama dapat mencakup investor individu, reksa dana, dana lindung nilai, atau institusi. Jadwal 13D menunjukkan bahwa investor memegang (atau pernah memegang) lebih dari 5% saham perusahaan dan bermaksud (atau pernah bermaksud) untuk secara aktif mengejar perubahan strategi bisnis. Jadwal 13G menunjukkan investasi pasif lebih dari 5%.
The share price as of September 5, 2025 is 66.58 / share. Previously, on September 6, 2024, the share price was 54.57 / share. This represents an increase of 22.02% over that period.
Skor Sentimen Dana
Skor Sentimen Dana (sebelumnya dikenal sebagai Skor Akumulasi Kepemilikan) menemukan saham-saham yang paling banyak dibeli oleh dana. Ini adalah hasil dari model kuantitatif multi-faktor yang canggih yang mengidentifikasi perusahaan dengan tingkat akumulasi institusional tertinggi. Model penilaian menggunakan kombinasi dari total peningkatan pemilik yang diungkapkan, perubahan dalam alokasi portofolio pada pemilik tersebut, dan metrik lainnya. Angka berkisar dari 0 hingga 100, dengan angka yang lebih tinggi menunjukkan tingkat akumulasi yang lebih tinggi dibandingkan dengan perusahaan sejenisnya, dan 50 adalah rata-ratanya.
Frekuensi Pembaruan: Setiap Hari
Lihat Ownership Explorer, yang menyediakan daftar perusahaan dengan peringkat tertinggi.
Rasio Put/Call Institusional
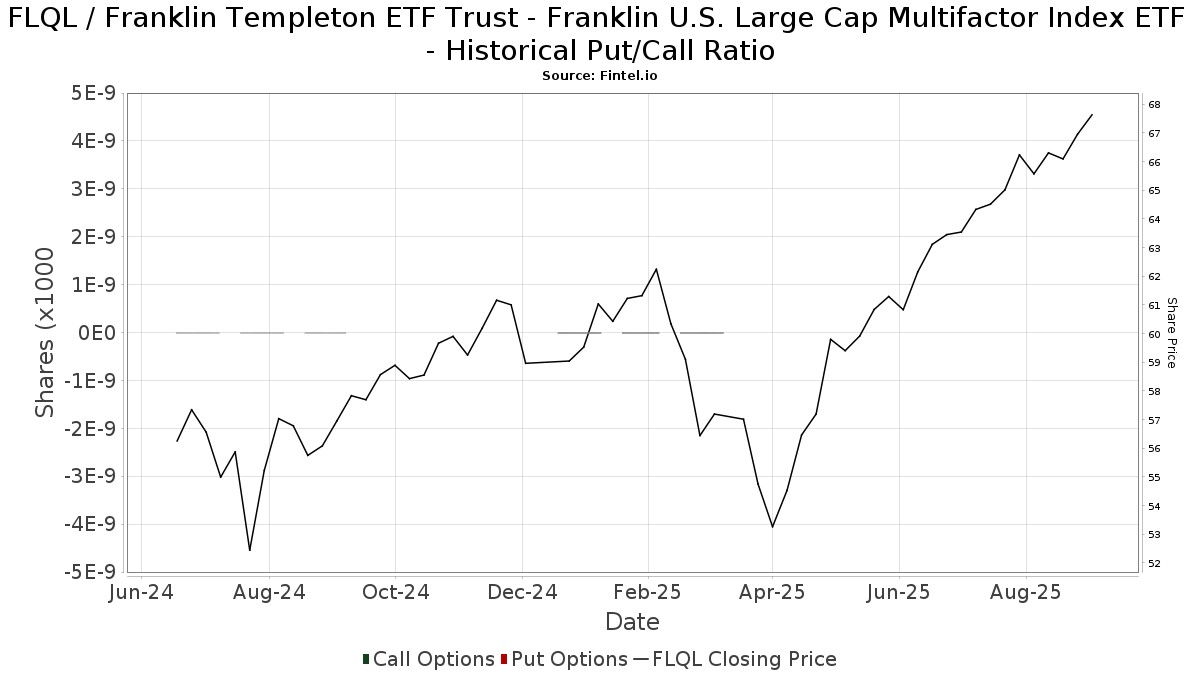
Selain melaporkan isu ekuitas dan utang standar, institusi dengan aset di bawah manajemen lebih dari 100 juta dolar AS juga harus mengungkapkan kepemilikan opsi put dan call mereka. Karena opsi put umumnya menunjukkan sentimen negatif, dan opsi call menunjukkan sentimen positif, kita dapat mengetahui sentimen institusional secara keseluruhan dengan memplot rasio put terhadap call. Grafik di sebelah kanan memplot rasio put/call historis untuk instrumen ini.
Menggunakan Rasio Put/Call sebagai indikator sentimen investor mengatasi salah satu kekurangan utama dari penggunaan total kepemilikan institusional, yaitu sejumlah besar aset yang dikelola diinvestasikan secara pasif untuk melacak indeks. Dana yang dikelola secara pasif biasanya tidak membeli opsi, sehingga indikator rasio put/call lebih akurat dalam melacak sentimen dana yang dikelola secara aktif.
Pengajuan 13F dan NPORT
Detail pada pengajuan 13F tersedia gratis. Detail pada pengajuan NP memerlukan keanggotaan premium. Baris berwarna hijau menunjukkan posisi baru. Baris berwarna merah menunjukkan posisi yang sudah ditutup. Klik tautan ini ikon untuk melihat riwayat transaksi selengkapnya.
Tingkatkan
untuk membuka data premium dan mengekspor ke Excel ![]() .
.
| Tanggal File | Sumber | Investor | Ketik | Presyo ng Avg (Silangan) |
Saham | Δ Saham (%) |
Dilaporkan Nilai ($1000) |
Nilai Δ (%) |
Alokasi Port (%) |
|
|---|---|---|---|---|---|---|---|---|---|---|
| 2025-07-30 | 13F | Bogart Wealth, LLC | 18,745 | 0.00 | 1,184 | 11.92 | ||||
| 2025-07-14 | 13F | Park Avenue Securities Llc | 9,596 | 19.19 | 1 | |||||
| 2025-08-14 | 13F | Mml Investors Services, Llc | 16,159 | 1 | ||||||
| 2025-08-26 | NP | FLTFX - Franklin LifeSmart 2055 Retirement Target Fund Class A | 53,374 | 0.61 | 3,371 | 12.59 | ||||
| 2025-07-25 | 13F | Concurrent Investment Advisors, LLC | 3,173 | 200 | ||||||
| 2025-08-14 | 13F | Modern Wealth Management, LLC | 5,518 | -15.34 | 349 | -5.18 | ||||
| 2025-08-14 | 13F | Sunbelt Securities, Inc. | 84 | 0.00 | 5 | 0.00 | ||||
| 2025-08-05 | 13F | Simplex Trading, Llc | 50 | 0 | ||||||
| 2025-08-11 | 13F | Wbi Investments, Inc. | 5,109 | 0.00 | 323 | 11.81 | ||||
| 2025-08-14 | 13F | Raymond James Financial Inc | 202,598 | -7.12 | 12,796 | 3.94 | ||||
| 2025-08-11 | 13F | Nations Financial Group Inc, /ia/ /adv | 3,495 | 221 | ||||||
| 2025-08-14 | 13F | UBS Group AG | 100,114 | 8.29 | 6,323 | 21.20 | ||||
| 2025-08-28 | NP | TFAGX - TFA AlphaGen Growth Fund Class I | 7,000 | 442 | ||||||
| 2025-07-31 | 13F | Arrien Investments, Inc. | 20,836 | 3.93 | 1,316 | 16.27 | ||||
| 2025-07-24 | 13F | IFP Advisors, Inc | 1,188 | -1.49 | 75 | 10.29 | ||||
| 2025-08-14 | 13F | Fmr Llc | 4,944 | -13.88 | 312 | -3.41 | ||||
| 2025-08-14 | 13F | Citadel Advisors Llc | Put | 0 | -100.00 | 0 | ||||
| 2025-08-14 | 13F | Bank Of America Corp /de/ | 2,180,552 | 25.36 | 137,724 | 40.28 | ||||
| 2025-07-25 | 13F | Envestnet Portfolio Solutions, Inc. | 6,233 | -59.76 | 394 | -55.03 | ||||
| 2025-07-30 | 13F | D.a. Davidson & Co. | 7,677 | 0.00 | 485 | 11.78 | ||||
| 2025-07-11 | 13F | SILVER OAK SECURITIES, Inc | 18,613 | 752.24 | 1,176 | 863.11 | ||||
| 2025-07-28 | 13F | Harbour Investments, Inc. | 1,240 | 0.00 | 78 | 13.04 | ||||
| 2025-08-05 | 13F | Bank Of Montreal /can/ | 318 | 0.00 | 20 | 17.65 | ||||
| 2025-08-05 | 13F | Huntington National Bank | 20 | |||||||
| 2025-08-06 | 13F | Commonwealth Equity Services, Llc | 37,866 | 5.51 | 2 | 0.00 | ||||
| 2025-08-15 | 13F | Morgan Stanley | 568,511 | -1.33 | 35,907 | 10.42 | ||||
| 2025-08-14 | 13F | Susquehanna International Group, Llp | 42,154 | -22.79 | 2,662 | -13.60 | ||||
| 2025-08-13 | 13F | Jones Financial Companies Lllp | 136,883 | 46.52 | 8,584 | 63.83 | ||||
| 2025-08-14 | 13F | Jane Street Group, Llc | 0 | -100.00 | 0 | |||||
| 2025-08-14 | 13F | Citadel Advisors Llc | Call | 0 | -100.00 | 0 | ||||
| 2025-08-01 | 13F | Rossby Financial, LCC | 902 | 0.00 | 57 | 12.00 | ||||
| 2025-08-08 | 13F | Glassman Wealth Services | 656 | 0.00 | 41 | 10.81 | ||||
| 2025-05-16 | 13F | Coppell Advisory Solutions LLC | 0 | -100.00 | 0 | |||||
| 2025-08-14 | 13F | Federation des caisses Desjardins du Quebec | 622 | 0.00 | 39 | 11.43 | ||||
| 2025-08-11 | 13F | Paul R. Ried Financial Group, LLC | 52,084 | -0.98 | 3,290 | 10.82 | ||||
| 2025-04-10 | 13F | Key Client Fiduciary Advisors, LLC | 0 | -100.00 | 0 | |||||
| 2025-08-14 | 13F | Stifel Financial Corp | 14,449 | -4.03 | 913 | 7.42 | ||||
| 2025-08-14 | 13F | Two Sigma Investments, Lp | 36,400 | 2,299 | ||||||
| 2025-08-26 | NP | FLSJX - Franklin LifeSmart 2050 Retirement Target Fund Class A | 68,937 | -2.37 | 4,354 | 9.26 | ||||
| 2025-07-07 | 13F | Thurston, Springer, Miller, Herd & Titak, Inc. | 35 | -75.00 | 2 | -71.43 | ||||
| 2025-05-15 | 13F | National Wealth Management Group, LLC | 5,031 | 284 | ||||||
| 2025-08-13 | 13F | GeoWealth Management, LLC | 32 | 2 | ||||||
| 2025-08-01 | 13F | Envestnet Asset Management Inc | 145,733 | -2.93 | 9,204 | 8.63 | ||||
| 2025-04-23 | 13F | Win Advisors, Inc | 0 | -100.00 | 0 | |||||
| 2025-08-26 | NP | FMTZX - Franklin Moderate Allocation Fund Advisor Class | 1,378,267 | -11.28 | 87,051 | -0.71 | ||||
| 2025-08-04 | 13F | Atria Investments Llc | 24,310 | -90.54 | 1,535 | -89.42 | ||||
| 2025-08-26 | NP | FLADX - Franklin LifeSmart 2040 Retirement Target Fund Class A | 65,192 | -2.65 | 4,118 | 8.94 | ||||
| 2025-07-29 | 13F | Crux Wealth Advisors | 23,554 | -54.25 | 1,488 | -48.81 | ||||
| 2025-08-12 | 13F | Proequities, Inc. | 0 | 0 | ||||||
| 2025-07-22 | 13F | SOL Capital Management CO | 27,938 | 12.98 | 2 | 0.00 | ||||
| 2025-07-09 | 13F | Christopher J. Hasenberg, Inc | 57,285 | -53.71 | 3,618 | -48.40 | ||||
| 2025-08-12 | 13F | Cornerstone Wealth Management, LLC | 82,305 | -0.83 | 5,198 | 10.97 | ||||
| 2025-08-11 | 13F | Core Wealth Partners LLC | 15,534 | 0.00 | 981 | 11.99 | ||||
| 2025-08-04 | 13F | Arkadios Wealth Advisors | 151,475 | 6.74 | 9,567 | 19.45 | ||||
| 2025-08-12 | 13F | Steward Partners Investment Advisory, Llc | 1,020,887 | 6.71 | 64,479 | 19.42 | ||||
| 2025-08-14 | 13F | GWM Advisors LLC | 5,944 | -6.60 | 375 | 4.46 | ||||
| 2025-08-12 | 13F | LPL Financial LLC | 560,858 | 17.84 | 35,424 | 31.88 | ||||
| 2025-08-08 | 13F | Avantax Advisory Services, Inc. | 105,330 | 1.94 | 6,653 | 14.08 | ||||
| 2025-07-30 | 13F | Brookstone Capital Management | 156,377 | 10.20 | 9,877 | 23.33 | ||||
| 2025-08-14 | 13F | Goldman Sachs Group Inc | 35,824 | 52.14 | 2,263 | 70.33 | ||||
| 2025-08-28 | NP | TFAFX - Tactical Growth Allocation Fund Class I | 1,900 | 120 | ||||||
| 2025-07-25 | 13F | Atria Wealth Solutions, Inc. | 4,996 | -79.01 | 317 | -76.47 | ||||
| 2025-08-12 | 13F | Leigh Baldwin & Co., Llc | 3,922 | -16.05 | 248 | -6.08 | ||||
| 2025-04-17 | 13F | Abound Wealth Management | 0 | -100.00 | 0 | -100.00 | ||||
| 2025-08-05 | 13F | Bank of New York Mellon Corp | 899,593 | -3.32 | 56,818 | 8.19 | ||||
| 2025-07-30 | 13F | Cullen/frost Bankers, Inc. | 5,048 | 2.58 | 319 | 14.80 | ||||
| 2025-08-26 | NP | FLRMX - Franklin LifeSmart 2020 Retirement Target Fund Class A | 13,503 | -9.85 | 853 | 0.83 | ||||
| 2025-08-13 | 13F/A | StoneX Group Inc. | 0 | -100.00 | 0 | -100.00 | ||||
| 2025-08-18 | 13F | Geneos Wealth Management Inc. | 11,149 | -4.34 | 704 | 7.15 | ||||
| 2025-08-26 | NP | FTTAX - Franklin LifeSmart 2045 Retirement Target Fund CLASS A | 117,692 | -3.45 | 7,433 | 8.05 | ||||
| 2025-08-07 | 13F | Atala Financial Inc | 0 | -100.00 | 0 | |||||
| 2025-08-05 | 13F | Tiaa Trust, National Association | 3,334 | 211 | ||||||
| 2025-08-14 | 13F | Qube Research & Technologies Ltd | 1,286 | 81 | ||||||
| 2025-08-26 | NP | FTRCX - Franklin LifeSmart 2035 Retirement Target Fund CLASS C | 127,224 | -3.84 | 8,035 | 7.62 | ||||
| 2025-08-26 | NP | FTCZX - Franklin Conservative Allocation Fund Advisor Class | 470,802 | -13.86 | 29,736 | -3.61 | ||||
| 2025-07-25 | 13F | Cwm, Llc | 35,895 | 17.45 | 2 | 100.00 | ||||
| 2025-05-06 | 13F | AE Wealth Management LLC | 0 | -100.00 | 0 | -100.00 | ||||
| 2025-08-12 | 13F | Jpmorgan Chase & Co | 361,334 | 17.87 | 22,822 | 31.90 | ||||
| 2025-07-28 | 13F | Sagespring Wealth Partners, Llc | 31,495 | -1.29 | 1,989 | 10.50 | ||||
| 2025-08-26 | NP | FGTZX - Franklin Growth Allocation Fund Advisor Class | 1,549,976 | -8.91 | 97,896 | 1.94 | ||||
| 2025-08-04 | 13F | Pensionmark Financial Group, Llc | 86,818 | -11.27 | 5,483 | -0.71 | ||||
| 2025-08-14 | 13F | Wells Fargo & Company/mn | 156,347 | 1.56 | 9,875 | 13.65 | ||||
| 2025-08-15 | 13F | Equitable Holdings, Inc. | 67,713 | -8.94 | 4,277 | 1.91 | ||||
| 2025-08-11 | 13F | TD Waterhouse Canada Inc. | 509 | 0.00 | 32 | 14.29 | ||||
| 2025-08-08 | 13F | Cetera Investment Advisers | 342,871 | 5.32 | 21,656 | 17.86 | ||||
| 2025-08-12 | 13F | O'shaughnessy Asset Management, Llc | 240 | -2.04 | 15 | 15.38 | ||||
| 2025-08-14 | 13F | Royal Bank Of Canada | 16,712 | 0.34 | 1,056 | 12.34 | ||||
| 2025-04-24 | 13F | Decker Retirement Planning Inc. | 0 | -100.00 | 0 | |||||
| 2025-07-17 | 13F | Janney Montgomery Scott LLC | 370,460 | -4.66 | 23 | 9.52 | ||||
| 2025-07-23 | 13F | Lakeshore Capital Group, Inc. | 35,049 | -1.67 | 2,214 | 10.04 | ||||
| 2025-08-04 | 13F | Assetmark, Inc | 1,010 | 0.00 | 64 | 10.53 | ||||
| 2025-09-04 | 13F/A | Advisor Group Holdings, Inc. | 63,859 | 14.80 | 4,033 | 28.48 | ||||
| 2025-08-12 | 13F | BlackRock, Inc. | 1,355 | 86 | ||||||
| 2025-08-26 | NP | FTRTX - Franklin LifeSmart 2025 Retirement Target Fund CLASS A | 70,386 | -7.82 | 4,446 | 3.16 | ||||
| 2025-08-26 | NP | FLJSX - Franklin LifeSmart 2060 Retirement Target Fund Advisor Class | 11,555 | 5.96 | 730 | 18.54 | ||||
| 2025-08-12 | 13F | Franklin Resources Inc | 8,591,482 | -10.12 | 542,638 | 0.58 | ||||
| 2025-08-15 | 13F | Kestra Advisory Services, LLC | 27,727 | -2.52 | 1,751 | 9.10 | ||||
| 2025-08-14 | 13F | Mariner, LLC | 53,296 | 1.85 | 3,366 | 13.99 | ||||
| 2025-08-26 | NP | FLRZX - Franklin LifeSmart 2030 Retirement Target Fund Advisor Class | 58,020 | -5.03 | 3,665 | 6.26 | ||||
| 2025-08-14 | 13F | Comerica Bank | 2,687 | 21.31 | 170 | 35.20 | ||||
| 2025-07-11 | 13F | Farther Finance Advisors, LLC | 0 | -100.00 | 0 | |||||
| 2025-08-14 | 13F | Citadel Advisors Llc | 15,651 | -58.63 | 989 | -53.72 | ||||
| 2025-08-01 | 13F | Howard Capital Management Inc. | 84,940 | 84.01 | 5,380 | 106.53 | ||||
| 2025-07-22 | 13F | Wealthcare Advisory Partners LLC | 137,468 | 4.44 | 8,682 | 16.88 | ||||
| 2025-08-12 | 13F | J.w. Cole Advisors, Inc. | 4,621 | -7.93 | 292 | 2.83 | ||||
| 2025-07-31 | 13F | Cambridge Investment Research Advisors, Inc. | 182,427 | -0.95 | 12 | 10.00 | ||||
| 2025-08-14 | 13F | Old Mission Capital Llc | 4,527 | 286 |
Other Listings
| MX:FLQL |