Mga Batayang Estadistika
| Pemilik Institusional | 163 total, 163 long only, 0 short only, 0 long/short - change of 0.00% MRQ |
| Alokasi Portofolio Rata-rata | 0.3067 % - change of -9.70% MRQ |
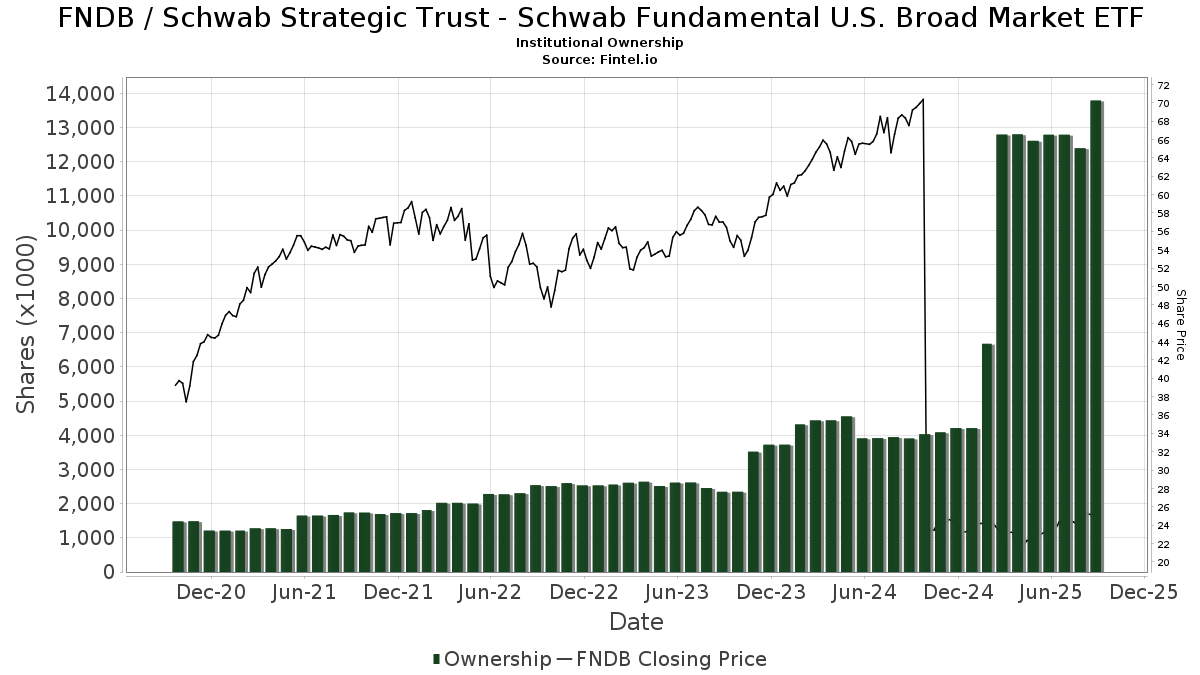
| Saham Institusional (Jangka Panjang) | 13,789,352 (ex 13D/G) - change of 1.00MM shares 7.83% MRQ |
| Nilai Institusional (Jangka Panjang) | $ 306,143 USD ($1000) |
Kepemilikan Institusional dan Pemegang Saham
Schwab Strategic Trust - Schwab Fundamental U.S. Broad Market ETF (US:FNDB) memiliki 163 pemilik institusional dan pemegang saham yang telah mengajukan formulir 13D/G atau 13F kepada Komisi Bursa Efek (Securities Exchange Commission/SEC). Lembaga-lembaga ini memegang total 13,789,352 saham. Pemegang saham terbesar meliputi Financial Consulate, Inc, Callan Capital, LLC, AlphaCore Capital LLC, Opes Wealth Management LLC, HighTower Advisors, LLC, Cambridge Investment Research Advisors, Inc., Sound Stewardship, LLC, Bank Of America Corp /de/, Morgan Stanley, and Brightwater Advisory LLC .
Struktur kepemilikan institusional Schwab Strategic Trust - Schwab Fundamental U.S. Broad Market ETF (ARCA:FNDB) menunjukkan posisi terkini di perusahaan oleh institusi dan dana, serta perubahan terbaru dalam ukuran posisi. Pemegang saham utama dapat mencakup investor individu, reksa dana, dana lindung nilai, atau institusi. Jadwal 13D menunjukkan bahwa investor memegang (atau pernah memegang) lebih dari 5% saham perusahaan dan bermaksud (atau pernah bermaksud) untuk secara aktif mengejar perubahan strategi bisnis. Jadwal 13G menunjukkan investasi pasif lebih dari 5%.
The share price as of September 5, 2025 is 25.31 / share. Previously, on September 9, 2024, the share price was 22.53 / share. This represents an increase of 12.36% over that period.
Skor Sentimen Dana
Skor Sentimen Dana (sebelumnya dikenal sebagai Skor Akumulasi Kepemilikan) menemukan saham-saham yang paling banyak dibeli oleh dana. Ini adalah hasil dari model kuantitatif multi-faktor yang canggih yang mengidentifikasi perusahaan dengan tingkat akumulasi institusional tertinggi. Model penilaian menggunakan kombinasi dari total peningkatan pemilik yang diungkapkan, perubahan dalam alokasi portofolio pada pemilik tersebut, dan metrik lainnya. Angka berkisar dari 0 hingga 100, dengan angka yang lebih tinggi menunjukkan tingkat akumulasi yang lebih tinggi dibandingkan dengan perusahaan sejenisnya, dan 50 adalah rata-ratanya.
Frekuensi Pembaruan: Setiap Hari
Lihat Ownership Explorer, yang menyediakan daftar perusahaan dengan peringkat tertinggi.
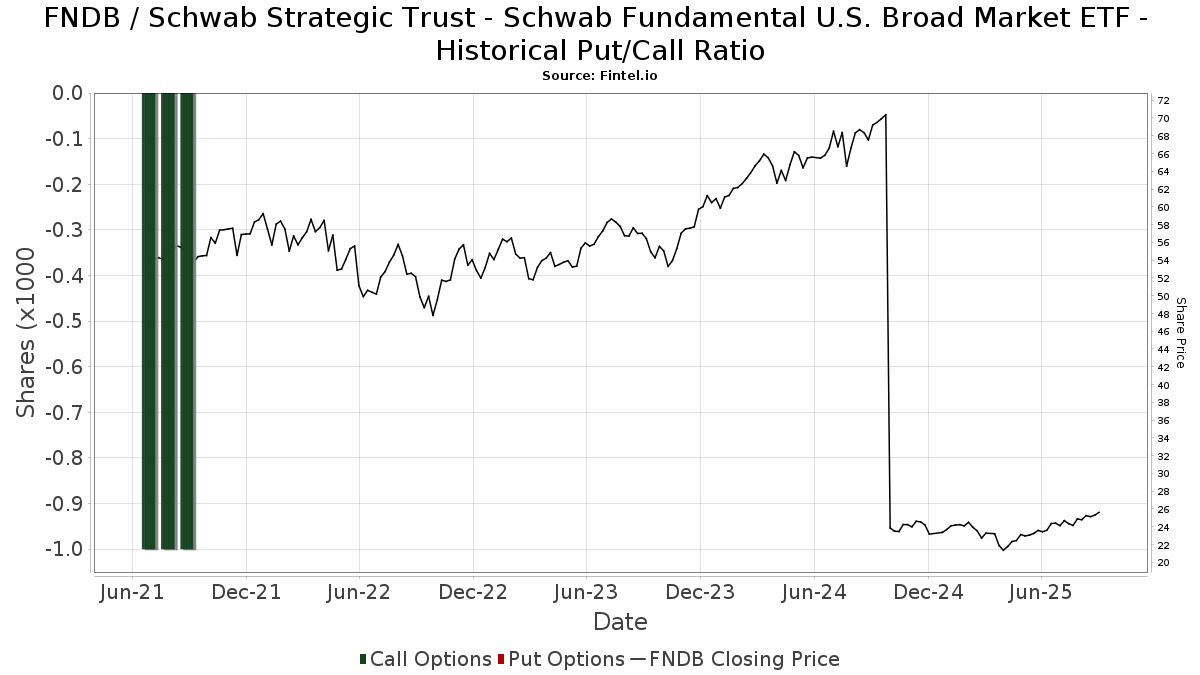
Rasio Put/Call Institusional
Selain melaporkan isu ekuitas dan utang standar, institusi dengan aset di bawah manajemen lebih dari 100 juta dolar AS juga harus mengungkapkan kepemilikan opsi put dan call mereka. Karena opsi put umumnya menunjukkan sentimen negatif, dan opsi call menunjukkan sentimen positif, kita dapat mengetahui sentimen institusional secara keseluruhan dengan memplot rasio put terhadap call. Grafik di sebelah kanan memplot rasio put/call historis untuk instrumen ini.
Menggunakan Rasio Put/Call sebagai indikator sentimen investor mengatasi salah satu kekurangan utama dari penggunaan total kepemilikan institusional, yaitu sejumlah besar aset yang dikelola diinvestasikan secara pasif untuk melacak indeks. Dana yang dikelola secara pasif biasanya tidak membeli opsi, sehingga indikator rasio put/call lebih akurat dalam melacak sentimen dana yang dikelola secara aktif.
Pengajuan 13F dan NPORT
Detail pada pengajuan 13F tersedia gratis. Detail pada pengajuan NP memerlukan keanggotaan premium. Baris berwarna hijau menunjukkan posisi baru. Baris berwarna merah menunjukkan posisi yang sudah ditutup. Klik tautan ini ikon untuk melihat riwayat transaksi selengkapnya.
Tingkatkan
untuk membuka data premium dan mengekspor ke Excel ![]() .
.
| Tanggal File | Sumber | Investor | Ketik | Presyo ng Avg (Silangan) |
Saham | Δ Saham (%) |
Dilaporkan Nilai ($1000) |
Nilai Δ (%) |
Alokasi Port (%) |
|
|---|---|---|---|---|---|---|---|---|---|---|
| 2025-07-23 | 13F | Prime Capital Investment Advisors, LLC | 0 | -100.00 | 0 | |||||
| 2025-07-30 | 13F | Paul Damon & Associates, Inc. | 34,070 | 71.83 | 817 | 78.95 | ||||
| 2025-08-15 | 13F | Equitable Holdings, Inc. | 9,788 | 6.80 | 235 | 11.43 | ||||
| 2025-07-11 | 13F | Vanguard Capital Wealth Advisors This fund is a listed as child fund of Vanguard Group Inc and if that institution has disclosed ownership in this security, then these positions will not be double counted when calculating total shares and total value | 19,358 | -6.55 | 464 | -2.52 | ||||
| 2025-08-11 | 13F | Brown Brothers Harriman & Co | 51,171 | 0.00 | 1,227 | 4.25 | ||||
| 2025-08-13 | 13F | Quadrant Capital Group Llc | 43,944 | 0.00 | 1,054 | 4.15 | ||||
| 2025-08-05 | 13F | BCGM Wealth Management, LLC | 11,188 | -67.23 | 268 | -65.86 | ||||
| 2025-08-08 | 13F | Keyvantage Wealth, Llc | 14,484 | 0.00 | 347 | 4.20 | ||||
| 2025-07-18 | 13F | TruNorth Capital Management, LLC | 8,433 | 0.00 | 202 | 4.12 | ||||
| 2025-07-22 | 13F | Red Tortoise LLC | 46,357 | 0.18 | 1,112 | 4.42 | ||||
| 2025-07-23 | 13F | Values Added Financial LLC | 49,678 | 0.00 | 1,191 | 4.20 | ||||
| 2025-07-14 | 13F | AdvisorNet Financial, Inc | 13,005 | -56.61 | 312 | -54.86 | ||||
| 2025-05-27 | NP | EVVLX - The E-Valuator Very Conservative (0%-15%) RMS Fund Service Class Shares | 2,407 | 126.22 | 55 | 129.17 | ||||
| 2025-04-29 | 13F | Lee Danner & Bass Inc | 0 | -100.00 | 0 | |||||
| 2025-07-31 | 13F | Cambridge Investment Research Advisors, Inc. | 686,144 | 12.15 | 16 | 14.29 | ||||
| 2025-08-08 | 13F | Pinney & Scofield, Inc. | 360 | 0.00 | 9 | 0.00 | ||||
| 2025-07-29 | 13F | Foster & Motley Inc | 12,172 | 0.39 | 0 | |||||
| 2025-08-15 | 13F | Captrust Financial Advisors | 60,788 | -20.59 | 1,458 | -17.26 | ||||
| 2025-07-29 | 13F | Systelligence, LLC | 0 | -100.00 | 0 | |||||
| 2025-07-23 | 13F | Valmark Advisers, Inc. | 8,845 | -2.53 | 212 | 1.92 | ||||
| 2025-08-05 | 13F | Carolinas Wealth Consulting Llc | 0 | -100.00 | 0 | -100.00 | ||||
| 2025-07-24 | 13F | IFP Advisors, Inc | 0 | -100.00 | 0 | |||||
| 2025-08-12 | 13F | Aspiring Ventures, LLC | 121,366 | 0.00 | 2,910 | 6.91 | ||||
| 2025-08-14 | 13F | Avant Capital LLC | 22,310 | 6.11 | 535 | 10.56 | ||||
| 2025-07-14 | 13F | Foster Group, Inc. | 65,114 | 6.74 | 1,561 | 11.26 | ||||
| 2025-08-12 | 13F/A | Brightwater Advisory LLC | 290,415 | -1.90 | 6,964 | 2.25 | ||||
| 2025-08-05 | 13F | Plante Moran Financial Advisors, LLC | 351 | -9.30 | 8 | 0.00 | ||||
| 2025-08-14 | 13F | UBS Group AG | 115,672 | 6.02 | 2,774 | 10.48 | ||||
| 2025-08-11 | 13F | HHM Wealth Advisors, LLC | 96,693 | 0.00 | 2,319 | 4.23 | ||||
| 2025-08-14 | 13F | Raymond James Financial Inc | 279,639 | -37.27 | 6,706 | -34.63 | ||||
| 2025-08-12 | 13F | AlphaCore Capital LLC | 1,293,595 | 106,368.72 | 31,020 | 114,788.89 | ||||
| 2025-05-27 | NP | EVGLX - The E-Valuator Growth (70%-85%) RMS Fund Service Class Shares | 195,437 | -3.43 | 4,497 | -4.46 | ||||
| 2025-07-30 | 13F | Exencial Wealth Advisors, Llc | 35,945 | -0.29 | 862 | 3.86 | ||||
| 2025-08-08 | 13F | Cetera Investment Advisers | 26,110 | 60.89 | 626 | 67.83 | ||||
| 2025-07-29 | 13F | Chicago Partners Investment Group LLC | 22,029 | 0.00 | 543 | 9.92 | ||||
| 2025-04-29 | 13F | Callan Capital, LLC | 1,337,085 | -1.25 | 30,766 | -2.31 | ||||
| 2025-07-16 | 13F | Perigon Wealth Management, LLC | 15,258 | 0.00 | 366 | 3.99 | ||||
| 2025-08-08 | 13F | Pnc Financial Services Group, Inc. | 8,700 | -12.12 | 209 | -8.37 | ||||
| 2025-07-09 | 13F | GSG Advisors LLC | 42,487 | 0.32 | 1,019 | 9.94 | ||||
| 2025-07-09 | 13F | Breakwater Investment Management | 8,943 | 0.00 | 214 | 4.39 | ||||
| 2025-07-11 | 13F | SILVER OAK SECURITIES, Inc | 8,523 | 204 | ||||||
| 2025-08-11 | 13F | Pineridge Advisors LLC | 6,999 | 0.29 | 168 | 4.38 | ||||
| 2025-07-08 | 13F | Parallel Advisors, LLC | 2,999 | 99.93 | 72 | 108.82 | ||||
| 2025-08-11 | 13F | Traub Capital Management LLC | 1,050 | 25 | ||||||
| 2025-08-08 | 13F | Kaizen Financial Strategies | 117,633 | -0.59 | 2,821 | 3.60 | ||||
| 2025-08-13 | 13F | Jones Financial Companies Lllp | 52,895 | 186.09 | 1,263 | 199.29 | ||||
| 2025-09-04 | 13F/A | Advisor Group Holdings, Inc. | 54,666 | 10.10 | 1,311 | 14.80 | ||||
| 2025-07-16 | 13F | Townsend Asset Management Corp /nc/ /adv | 130,051 | -0.26 | 3,119 | 3.93 | ||||
| 2025-08-08 | 13F | KM Capital Management Ltd. | 19,809 | -18.02 | 475 | -14.57 | ||||
| 2025-08-08 | 13F | Larson Financial Group LLC | 2,500 | 31.58 | 60 | 37.21 | ||||
| 2025-07-22 | 13F | Valley National Advisers Inc | 6,210 | -22.67 | 0 | |||||
| 2025-08-14 | 13F | Goldman Sachs Group Inc | 273,068 | 217.63 | 6,548 | 231.04 | ||||
| 2025-08-29 | 13F | Centaurus Financial, Inc. | 5,903 | -6.54 | 0 | |||||
| 2025-08-13 | 13F | Lido Advisors, LLC | 12,238 | -4.70 | 293 | -0.68 | ||||
| 2025-05-01 | 13F | Fifth Third Securities, Inc. | 0 | -100.00 | 0 | |||||
| 2025-08-11 | 13F | Aptus Capital Advisors, LLC | 0 | -100.00 | 0 | |||||
| 2025-08-14 | 13F | Murphy & Mullick Capital Management Corp | 285 | 0.00 | 7 | 0.00 | ||||
| 2025-07-21 | 13F | Empirical Financial Services, LLC d.b.a. Empirical Wealth Management | 14,580 | 0.00 | 350 | 4.18 | ||||
| 2025-08-06 | 13F | Founders Financial Securities Llc | 49,823 | 1,195 | ||||||
| 2025-08-18 | 13F | Geneos Wealth Management Inc. | 2,787 | 0.00 | 67 | 3.13 | ||||
| 2025-03-12 | 13F/A | Private Capital Management Llc | 1,944 | -1.87 | 127 | -3.05 | ||||
| 2025-08-14 | 13F | Mml Investors Services, Llc | 145,641 | 63.02 | 3 | 50.00 | ||||
| 2025-08-06 | 13F | Commonwealth Equity Services, Llc | 83,401 | -2.73 | 2 | 100.00 | ||||
| 2025-07-30 | 13F | Retirement Planning Group | 17,424 | 0.00 | 418 | 4.25 | ||||
| 2025-08-01 | 13F | MorganRosel Wealth Management, LLC | 30,586 | -2.43 | 733 | 1.66 | ||||
| 2025-08-14 | 13F | GWM Advisors LLC | 1,923 | 0.00 | 46 | 4.55 | ||||
| 2025-08-14 | 13F | Mercer Global Advisors Inc /adv | 8,876 | -6.35 | 213 | -2.75 | ||||
| 2025-07-10 | 13F | Sovran Advisors, LLC | 18,223 | -5.34 | 443 | 7.26 | ||||
| 2025-08-01 | 13F | James Investment Research Inc | 73,197 | 7.92 | 1,755 | 12.50 | ||||
| 2025-07-11 | 13F | Seacrest Wealth Management, Llc | 42,741 | 0.14 | 1,025 | 4.28 | ||||
| 2025-07-28 | 13F | Eq Wealth Advisors, Llc | 136 | 0.00 | 3 | 0.00 | ||||
| 2025-08-15 | 13F | Tower Research Capital LLC (TRC) | 5,173 | -72.20 | 124 | -71.03 | ||||
| 2025-05-09 | 13F | Wade Financial Advisory, Inc | 45,843 | -0.68 | 1,055 | -1.77 | ||||
| 2025-07-14 | 13F | S.A. Mason LLC | 6,553 | 0.03 | 157 | 4.67 | ||||
| 2025-07-21 | 13F | Pflug Koory, LLC | 522 | 0.00 | 13 | 0.00 | ||||
| 2025-07-23 | 13F | Nbt Bank N A /ny | 11,955 | 0.00 | 287 | 4.00 | ||||
| 2025-08-13 | 13F | Milestone Investment Advisors LLC | 37,386 | -3.39 | 897 | 0.67 | ||||
| 2025-05-27 | NP | EVCLX - The E-Valuator Conservative (15%-30%) RMS Fund Service Class Shares | 8,877 | -9.43 | 204 | -10.13 | ||||
| 2025-08-14 | 13F | Colony Group, LLC | 8,340 | 200 | ||||||
| 2025-08-14 | 13F | Mariner, LLC | 57,569 | 10.35 | 1,381 | 15.00 | ||||
| 2025-08-15 | 13F | Kestra Advisory Services, LLC | 11,574 | 278 | ||||||
| 2025-07-25 | 13F | JustInvest LLC | 12,786 | 0.00 | 307 | 4.08 | ||||
| 2025-08-01 | 13F | Envestnet Asset Management Inc | 245,556 | 28.77 | 5,888 | 34.21 | ||||
| 2025-07-23 | 13F | Litman Gregory Asset Management LLC | 22,537 | 0.00 | 540 | 4.25 | ||||
| 2025-08-12 | 13F | Jpmorgan Chase & Co | 61,525 | 11.17 | 1,475 | 15.87 | ||||
| 2025-07-29 | 13F | Harbor Asset Planning, Inc. | 6,908 | 166 | ||||||
| 2025-07-31 | 13F | Guardian Financial Partners, LLC | 174,339 | -0.89 | 4,181 | 3.29 | ||||
| 2025-08-14 | 13F | Ameriprise Financial Inc | 262,206 | 6.23 | 6,278 | 10.78 | ||||
| 2025-08-14 | 13F | Jane Street Group, Llc | 12,416 | -75.43 | 298 | -74.44 | ||||
| 2025-08-14 | 13F | Wells Fargo & Company/mn | 1 | 0 | ||||||
| 2025-07-09 | 13F | Channel Wealth Llc | 31,150 | -13.81 | 747 | -10.23 | ||||
| 2025-08-11 | 13F | Hexagon Capital Partners LLC | 0 | -100.00 | 0 | |||||
| 2025-08-08 | 13F | Creative Planning | 43,241 | -13.10 | 1,037 | -9.44 | ||||
| 2025-08-13 | 13F | Cheviot Value Management, LLC | 4,018 | 0.42 | 98 | 8.99 | ||||
| 2025-07-28 | 13F | Frazier Financial Advisors, LLC | 22 | 1 | ||||||
| 2025-08-14 | 13F | Ancora Advisors, LLC | 1,350 | 0.00 | 32 | 3.23 | ||||
| 2025-08-15 | 13F | Cornerstone Financial Group, LLC /NE/ | 48,270 | 0.13 | 1,158 | 3.30 | ||||
| 2025-07-07 | 13F | Versant Capital Management, Inc | 465 | 0.00 | 11 | 10.00 | ||||
| 2025-08-13 | 13F | Northwestern Mutual Wealth Management Co | 9,172 | 33.84 | 220 | 39.49 | ||||
| 2025-08-14 | 13F | CoreCap Advisors, LLC | 1,416 | -40.85 | 34 | -40.00 | ||||
| 2025-08-14 | 13F | Royal Bank Of Canada | 23,933 | 49.05 | 574 | 55.56 | ||||
| 2025-05-15 | 13F | Old Mission Capital Llc | 0 | -100.00 | 0 | |||||
| 2025-07-29 | 13F | Stratos Wealth Partners, LTD. | 10,934 | 0.35 | 262 | 4.80 | ||||
| 2025-07-29 | 13F | Chevy Chase Trust Holdings, Inc. | 13,505 | -17.63 | 324 | -14.32 | ||||
| 2025-08-07 | 13F | 49 Wealth Management, Llc | 8,824 | 0.43 | 212 | 4.46 | ||||
| 2025-08-08 | 13F | Tanglewood Legacy Advisors, LLC | 4,191 | 0.00 | 100 | 4.17 | ||||
| 2025-08-29 | 13F | Total Investment Management Inc | 20,108 | 4.07 | 482 | 8.56 | ||||
| 2025-05-15 | 13F | Baird Financial Group, Inc. | 0 | -100.00 | 0 | |||||
| 2025-07-28 | 13F | Harbour Investments, Inc. | 7,412 | 0.43 | 178 | 4.73 | ||||
| 2025-07-25 | 13F | Cwm, Llc | 0 | -100.00 | 0 | |||||
| 2025-07-15 | 13F | Bfsg, Llc | 0 | -100.00 | 0 | |||||
| 2025-07-21 | 13F | Sage Financial Management Group, Inc. | 10,605 | -39.52 | 0 | |||||
| 2025-08-12 | 13F | CIBC Private Wealth Group, LLC | 1 | 0.00 | 0 | |||||
| 2025-07-29 | 13F | Mezzasalma Advisors, LLC | 144,666 | 1.10 | 3,469 | 5.38 | ||||
| 2025-08-12 | 13F | Coldstream Capital Management Inc | 54,096 | 0.00 | 1,297 | 4.26 | ||||
| 2025-08-11 | 13F | Wealthspire Advisors, LLC | 70,740 | 0.00 | 1,696 | 4.24 | ||||
| 2025-08-12 | 13F | Proequities, Inc. | 0 | 0 | ||||||
| 2025-08-15 | 13F | Morgan Stanley | 381,048 | 5.87 | 9,138 | 10.32 | ||||
| 2025-07-14 | 13F | Sound Stewardship, LLC | 616,513 | 7.76 | 14,784 | 12.30 | ||||
| 2025-07-29 | 13F | Werba Rubin Papier Wealth Management | 16,574 | 0.00 | 397 | 4.20 | ||||
| 2025-08-12 | 13F/A | Cozad Asset Management Inc | 28,993 | -3.15 | 695 | 1.02 | ||||
| 2025-07-15 | 13F | Mather Group, Llc. | 24,600 | 0.00 | 590 | 4.06 | ||||
| 2025-07-31 | 13F | Opes Wealth Management LLC | 701,803 | 10.59 | 16,829 | 15.26 | ||||
| 2025-08-14 | 13F | Citadel Advisors Llc | 31,796 | -43.62 | 762 | -41.25 | ||||
| 2025-08-06 | 13F | SOUTH STATE Corp | 4,031 | 1.31 | 97 | 5.49 | ||||
| 2025-08-08 | 13F | Capital Investment Advisory Services, LLC | 17,549 | 0.00 | 421 | 4.22 | ||||
| 2025-07-22 | 13F | Red Door Wealth Management, LLC | 86,728 | 0.00 | 2,080 | 4.21 | ||||
| 2025-07-30 | 13F | Blume Capital Management, Inc. | 2,000 | 0.00 | 48 | 2.17 | ||||
| 2025-05-27 | NP | EVAGX - The E-Valuator Aggressive Growth (85%-99%) RMS Fund Service Class Shares | 128,673 | -19.47 | 2,961 | -20.34 | ||||
| 2025-08-14 | 13F | Susquehanna International Group, Llp | 0 | -100.00 | 0 | |||||
| 2025-07-21 | 13F | Tower View Investment Management & Research LLC | 2,414 | 0.42 | 58 | 3.64 | ||||
| 2025-08-12 | 13F | Coston, McIsaac & Partners | 561 | 0.00 | 0 | |||||
| 2025-08-06 | 13F | Nicholas Hoffman & Company, LLC. | 49,107 | 0.32 | 1,178 | 4.53 | ||||
| 2025-07-08 | 13F | Lowe Wealth Advisors, LLC | 15 | 0.00 | 0 | |||||
| 2025-07-16 | 13F | Signaturefd, Llc | 2,284 | 1.51 | 55 | 5.88 | ||||
| 2025-08-12 | 13F | Steward Partners Investment Advisory, Llc | 7,125 | 105.45 | 171 | 115.19 | ||||
| 2025-07-23 | 13F | Winthrop Advisory Group LLC | 9,143 | 0.56 | 219 | 4.78 | ||||
| 2025-08-07 | 13F | Allworth Financial LP | 2,935 | 108.01 | 70 | 125.81 | ||||
| 2025-05-13 | 13F | Bank Of Montreal /can/ | 0 | -100.00 | 0 | |||||
| 2025-07-22 | 13F | Yoder Wealth Management, Inc. | 73,067 | -0.20 | 1,752 | 4.04 | ||||
| 2025-08-18 | 13F | Front Row Advisors LLC | 66 | 0.00 | 2 | 0.00 | ||||
| 2025-08-14 | 13F | Bank Of America Corp /de/ | 435,216 | 6.02 | 10,436 | 10.49 | ||||
| 2025-08-13 | 13F | Russell Investments Group, Ltd. | 145 | 3 | ||||||
| 2025-07-10 | 13F | Redhawk Wealth Advisors, Inc. | 34,950 | 0.43 | 838 | 4.75 | ||||
| 2025-07-30 | 13F | Crewe Advisors LLC | 8,843 | 0.00 | 212 | 4.43 | ||||
| 2025-07-08 | 13F | Zrc Wealth Management, Llc | 24,879 | -12.86 | 597 | -9.15 | ||||
| 2025-05-12 | 13F | Sandy Spring Bank | 900 | 0.00 | 21 | 0.00 | ||||
| 2025-08-14 | 13F | Great Valley Advisor Group, Inc. | 0 | -100.00 | 0 | |||||
| 2025-08-07 | 13F | Parkside Financial Bank & Trust | 4,846 | 0.37 | 116 | 4.50 | ||||
| 2025-07-17 | 13F | Sound Income Strategies, LLC | 453 | 11 | ||||||
| 2025-08-06 | 13F | Atlantic Union Bankshares Corp | 900 | 22 | ||||||
| 2025-07-08 | 13F | First National Corp /ma/ /adv | 85,225 | 0.00 | 2,044 | 4.18 | ||||
| 2025-08-12 | 13F | MAI Capital Management | 56,822 | 0.05 | 1,363 | 4.29 | ||||
| 2025-08-15 | 13F | CI Private Wealth, LLC | 140,592 | 185.48 | 3,350 | 216.04 | ||||
| 2025-08-14 | 13F | Modern Wealth Management, LLC | 22,008 | 83.31 | 528 | 90.94 | ||||
| 2025-07-21 | 13F | Ameritas Advisory Services, LLC | 1,137 | 27 | ||||||
| 2025-08-08 | 13F | Avantax Advisory Services, Inc. | 13,114 | -36.51 | 314 | -33.89 | ||||
| 2025-07-14 | 13F | Leonard Rickey Investment Advisors P.L.L.C. | 179,405 | -1.91 | 4,302 | 8.06 | ||||
| 2025-07-23 | 13F | Bellevue Asset Management, Llc | 28,555 | 0.00 | 685 | 4.11 | ||||
| 2025-07-31 | 13F | CVA Family Office, LLC | 126,680 | -1.80 | 3,038 | 2.32 | ||||
| 2025-07-31 | 13F | Carnegie Capital Asset Management, LLC | 14,823 | 0.00 | 355 | 16.01 | ||||
| 2025-08-04 | 13F | Creative Financial Designs Inc /adv | 231 | 0.00 | 6 | 0.00 | ||||
| 2025-05-27 | NP | EVMLX - The E-Valuator Moderate (50%-70%) RMS Fund Service Class Shares | 85,101 | 8.62 | 1,958 | 7.46 | ||||
| 2025-07-22 | 13F | Clarius Group, LLC | 89,484 | 0.00 | 2,146 | 4.18 | ||||
| 2025-08-14 | 13F | Fmr Llc | 8,427 | -0.46 | 202 | 4.12 | ||||
| 2025-04-23 | 13F | Mascagni Wealth Management, Inc. | 0 | -100.00 | 0 | -100.00 | ||||
| 2025-07-31 | 13F | Resonant Capital Advisors, LLC | 98,247 | 11.03 | 2,356 | 15.67 | ||||
| 2025-05-27 | NP | EVTTX - The E-Valuator Conservative/Moderate (30%-50%) RMS Fund Service Class Shares | 11,304 | 16.86 | 260 | 16.07 | ||||
| 2025-08-12 | 13F | Sfmg, Llc | 27,996 | 0.00 | 671 | 4.19 | ||||
| 2025-07-31 | 13F | Glass Jacobson Investment Advisors llc | 24,119 | 22.54 | 578 | 26.48 | ||||
| 2025-08-14 | 13F | Comerica Bank | 170 | 0.00 | 4 | 33.33 | ||||
| 2025-07-21 | 13F | Ameriflex Group, Inc. | 168 | 0.00 | 4 | 0.00 | ||||
| 2025-07-15 | 13F | Main Street Group, LTD | 0 | -100.00 | 0 | |||||
| 2025-08-12 | 13F | LPL Financial LLC | 105,719 | -15.86 | 2,535 | -12.31 | ||||
| 2025-08-11 | 13F | HighTower Advisors, LLC | 695,144 | 3.29 | 16,670 | 7.65 | ||||
| 2025-08-14 | 13F | Stifel Financial Corp | 15,854 | 8.67 | 380 | 13.43 | ||||
| 2025-07-17 | 13F | HB Wealth Management, LLC | 37,863 | 0.00 | 908 | 4.13 | ||||
| 2025-07-10 | 13F | Wealth Enhancement Advisory Services, Llc | 44,412 | 1,087 | ||||||
| 2025-07-11 | 13F | Farther Finance Advisors, LLC | 12,603 | 0.00 | 302 | 4.14 | ||||
| 2025-07-18 | 13F | Financial Consulate, Inc | 1,422,825 | -13.08 | 34,119 | -9.42 | ||||
| 2025-08-15 | 13F | Koesten, Hirschmann & Crabtree, INC. | 7,530 | 0.00 | 181 | 4.05 |