Mga Batayang Estadistika
| Pemilik Institusional | 154 total, 154 long only, 0 short only, 0 long/short - change of -0.65% MRQ |
| Alokasi Portofolio Rata-rata | 0.1487 % - change of 0.10% MRQ |
| Saham Institusional (Jangka Panjang) | 27,782,993 (ex 13D/G) - change of 0.93MM shares 3.47% MRQ |
| Nilai Institusional (Jangka Panjang) | $ 943,601 USD ($1000) |
Kepemilikan Institusional dan Pemegang Saham
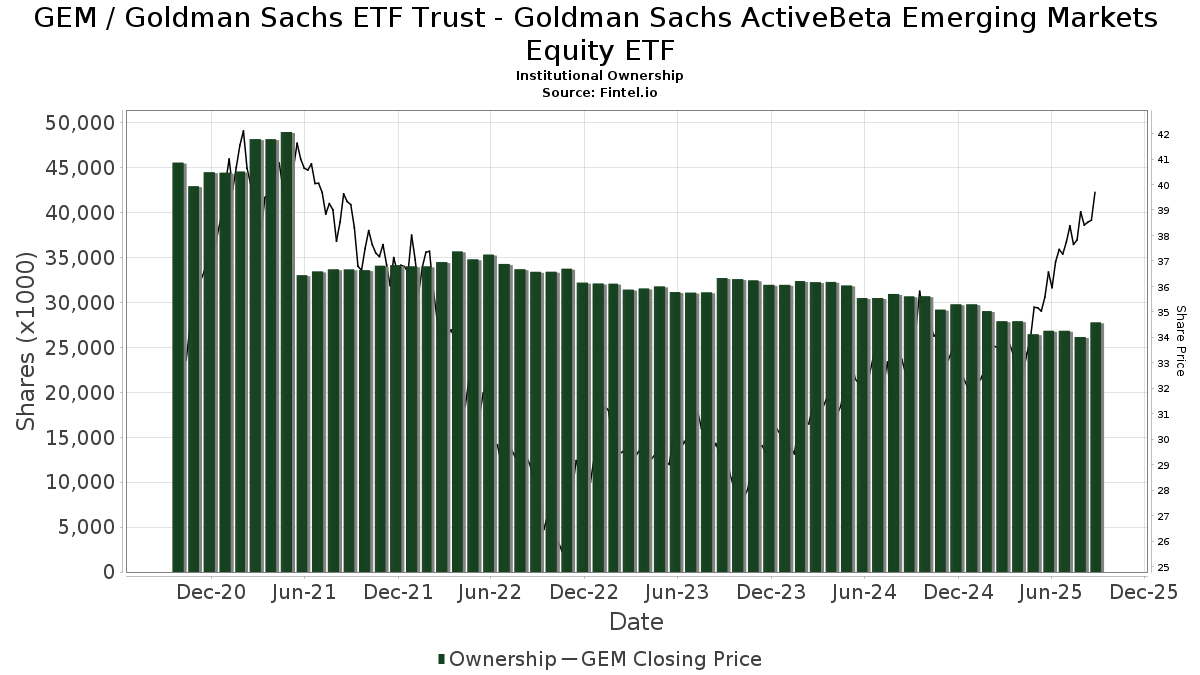
Goldman Sachs ETF Trust - Goldman Sachs ActiveBeta Emerging Markets Equity ETF (US:GEM) memiliki 154 pemilik institusional dan pemegang saham yang telah mengajukan formulir 13D/G atau 13F kepada Komisi Bursa Efek (Securities Exchange Commission/SEC). Lembaga-lembaga ini memegang total 27,782,993 saham. Pemegang saham terbesar meliputi Wells Fargo & Company/mn, SigFig Wealth Management, LLC, Goldman Sachs Group Inc, Betterment LLC, LPL Financial LLC, GGMBX - Goldman Sachs Global Managed Beta Fund Institutional Shares, Arvest Bank Trust Division, HB Wealth Management, LLC, State Of Wisconsin Investment Board, and Envestnet Asset Management Inc .
Struktur kepemilikan institusional Goldman Sachs ETF Trust - Goldman Sachs ActiveBeta Emerging Markets Equity ETF (ARCA:GEM) menunjukkan posisi terkini di perusahaan oleh institusi dan dana, serta perubahan terbaru dalam ukuran posisi. Pemegang saham utama dapat mencakup investor individu, reksa dana, dana lindung nilai, atau institusi. Jadwal 13D menunjukkan bahwa investor memegang (atau pernah memegang) lebih dari 5% saham perusahaan dan bermaksud (atau pernah bermaksud) untuk secara aktif mengejar perubahan strategi bisnis. Jadwal 13G menunjukkan investasi pasif lebih dari 5%.
The share price as of September 5, 2025 is 38.86 / share. Previously, on September 6, 2024, the share price was 32.13 / share. This represents an increase of 20.95% over that period.
Skor Sentimen Dana
Skor Sentimen Dana (sebelumnya dikenal sebagai Skor Akumulasi Kepemilikan) menemukan saham-saham yang paling banyak dibeli oleh dana. Ini adalah hasil dari model kuantitatif multi-faktor yang canggih yang mengidentifikasi perusahaan dengan tingkat akumulasi institusional tertinggi. Model penilaian menggunakan kombinasi dari total peningkatan pemilik yang diungkapkan, perubahan dalam alokasi portofolio pada pemilik tersebut, dan metrik lainnya. Angka berkisar dari 0 hingga 100, dengan angka yang lebih tinggi menunjukkan tingkat akumulasi yang lebih tinggi dibandingkan dengan perusahaan sejenisnya, dan 50 adalah rata-ratanya.
Frekuensi Pembaruan: Setiap Hari
Lihat Ownership Explorer, yang menyediakan daftar perusahaan dengan peringkat tertinggi.
Rasio Put/Call Institusional
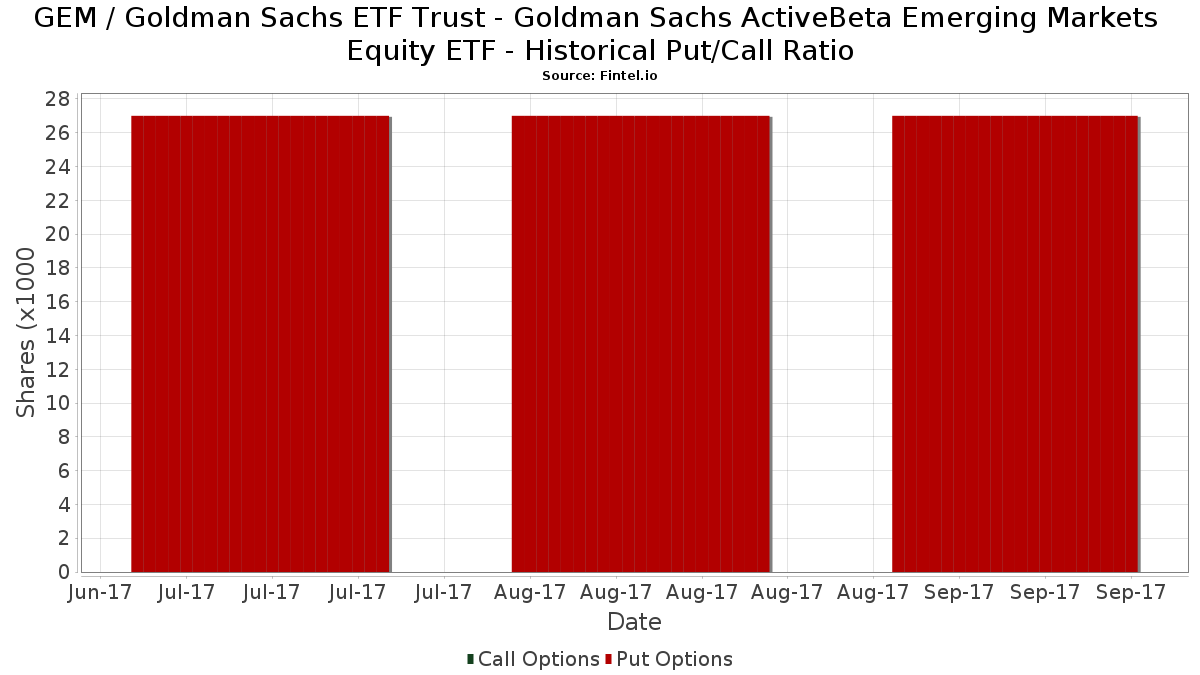
Selain melaporkan isu ekuitas dan utang standar, institusi dengan aset di bawah manajemen lebih dari 100 juta dolar AS juga harus mengungkapkan kepemilikan opsi put dan call mereka. Karena opsi put umumnya menunjukkan sentimen negatif, dan opsi call menunjukkan sentimen positif, kita dapat mengetahui sentimen institusional secara keseluruhan dengan memplot rasio put terhadap call. Grafik di sebelah kanan memplot rasio put/call historis untuk instrumen ini.
Menggunakan Rasio Put/Call sebagai indikator sentimen investor mengatasi salah satu kekurangan utama dari penggunaan total kepemilikan institusional, yaitu sejumlah besar aset yang dikelola diinvestasikan secara pasif untuk melacak indeks. Dana yang dikelola secara pasif biasanya tidak membeli opsi, sehingga indikator rasio put/call lebih akurat dalam melacak sentimen dana yang dikelola secara aktif.
Pengajuan 13F dan NPORT
Detail pada pengajuan 13F tersedia gratis. Detail pada pengajuan NP memerlukan keanggotaan premium. Baris berwarna hijau menunjukkan posisi baru. Baris berwarna merah menunjukkan posisi yang sudah ditutup. Klik tautan ini ikon untuk melihat riwayat transaksi selengkapnya.
Tingkatkan
untuk membuka data premium dan mengekspor ke Excel ![]() .
.
| Tanggal File | Sumber | Investor | Ketik | Presyo ng Avg (Silangan) |
Saham | Δ Saham (%) |
Dilaporkan Nilai ($1000) |
Nilai Δ (%) |
Alokasi Port (%) |
|
|---|---|---|---|---|---|---|---|---|---|---|
| 2025-07-28 | 13F | Kiker Wealth Management, LLC | 337 | -27.06 | 13 | -20.00 | ||||
| 2025-08-14 | 13F | Integrated Wealth Concepts LLC | 14,250 | 6.18 | 530 | 19.10 | ||||
| 2025-05-16 | 13F | Coppell Advisory Solutions LLC | 0 | -100.00 | 0 | |||||
| 2025-07-22 | 13F | HFM Investment Advisors, LLC | 189 | 5.59 | 7 | 40.00 | ||||
| 2025-07-07 | 13F | Nova Wealth Management, Inc. | 19 | -92.31 | 1 | -100.00 | ||||
| 2025-08-13 | 13F | Baird Financial Group, Inc. | 40,263 | -1.00 | 1,498 | 11.05 | ||||
| 2025-07-17 | 13F | HB Wealth Management, LLC | 1,124,949 | -36.81 | 41,859 | -29.13 | ||||
| 2025-08-19 | 13F | Anchor Investment Management, LLC | 116,302 | 6.42 | 4,328 | 19.33 | ||||
| 2025-08-14 | 13F | Citadel Advisors Llc | 289,967 | 3,903.41 | 10,790 | 4,395.42 | ||||
| 2025-08-05 | 13F | Key FInancial Inc | 41 | 0.00 | 2 | 0.00 | ||||
| 2025-08-14 | 13F | State Of Wisconsin Investment Board | 1,091,863 | 0.00 | 40,628 | 12.15 | ||||
| 2025-08-12 | 13F | Proequities, Inc. | 0 | 0 | ||||||
| 2025-04-21 | 13F | ORG Partners LLC | 0 | -100.00 | 0 | |||||
| 2025-08-13 | 13F | Maia Wealth LLC | 11,913 | -2.55 | 443 | 13.01 | ||||
| 2025-07-28 | 13F | Elmwood Wealth Management, Inc. | 25,220 | -0.05 | 938 | 12.07 | ||||
| 2025-08-06 | 13F | Golden State Wealth Management, LLC | 34,402 | -8.61 | 1,280 | 2.48 | ||||
| 2025-08-11 | 13F | Wealthspire Advisors, LLC | 8,796 | -23.21 | 327 | -13.95 | ||||
| 2025-08-08 | 13F | Hartland & Co., LLC | 0 | -100.00 | 0 | |||||
| 2025-08-05 | 13F | Bank of New York Mellon Corp | 25,442 | 3.83 | 947 | 16.36 | ||||
| 2025-07-31 | 13F | Cambridge Investment Research Advisors, Inc. | 9,714 | -2.05 | 0 | |||||
| 2025-08-11 | 13F | Principal Securities, Inc. | 318,162 | 33.42 | 11,839 | 55.54 | ||||
| 2025-07-30 | 13F | Whittier Trust Co Of Nevada Inc | 16,910 | -4.69 | 629 | 6.97 | ||||
| 2025-08-04 | 13F | Spinnaker Trust | 204,634 | -4.97 | 7,614 | 6.58 | ||||
| 2025-08-12 | 13F | AlphaCore Capital LLC | 109,617 | 638.01 | 4,079 | 728.86 | ||||
| 2025-08-14 | 13F | Royal Bank Of Canada | 359,226 | 28.25 | 13,366 | 43.83 | ||||
| 2025-08-14 | 13F | Betterment LLC | 2,098,854 | 19.20 | 78 | 34.48 | ||||
| 2025-08-14 | 13F | Bank Of America Corp /de/ | 483,005 | 0.20 | 17,973 | 12.37 | ||||
| 2025-08-13 | 13F | Continuum Advisory, LLC | 0 | -100.00 | 0 | |||||
| 2025-08-14 | 13F | First Foundation Advisors | 330,790 | 2.55 | 12,309 | 15.00 | ||||
| 2025-07-30 | 13F | Whittier Trust Co | 13,527 | -29.87 | 503 | -21.28 | ||||
| 2025-08-06 | 13F | AE Wealth Management LLC | 141 | 69.88 | 5 | 150.00 | ||||
| 2025-07-30 | 13F | Cullen/frost Bankers, Inc. | 557 | 0.00 | 21 | 11.11 | ||||
| 2025-08-14 | 13F | Glenview Trust Co | 8,897 | -1.36 | 331 | 10.70 | ||||
| 2025-08-13 | 13F | Cheviot Value Management, LLC | 65 | 0.00 | 2 | 0.00 | ||||
| 2025-08-14 | 13F | Qube Research & Technologies Ltd | 1,377 | -62.39 | 51 | -57.85 | ||||
| 2025-07-09 | 13F | Pallas Capital Advisors LLC | 0 | -100.00 | 0 | |||||
| 2025-07-25 | 13F | Prostatis Group LLC | 32,539 | 104.63 | 1,211 | 129.60 | ||||
| 2025-08-14 | 13F | Ameriprise Financial Inc | 0 | -100.00 | 0 | |||||
| 2025-08-19 | 13F | Advisory Services Network, LLC | 6,208 | 1.31 | 232 | 14.29 | ||||
| 2025-05-15 | 13F | Stonehaven Wealth & Tax Solutions, Llc | 0 | -100.00 | 0 | |||||
| 2025-08-14 | 13F | Goldman Sachs Group Inc | 2,941,097 | 7.81 | 109,438 | 20.91 | ||||
| 2025-07-18 | 13F | Truist Financial Corp | 23,996 | 8.69 | 893 | 21.86 | ||||
| 2025-08-11 | 13F | Hexagon Capital Partners LLC | 0 | -100.00 | 0 | |||||
| 2025-08-12 | 13F | Clearwater Capital Advisors, LLC | 9,380 | -92.68 | 349 | -91.80 | ||||
| 2025-07-21 | 13F | Quent Capital, LLC | 0 | -100.00 | 0 | |||||
| 2025-08-11 | 13F | Citigroup Inc | 18,096 | 2.68 | 673 | 15.24 | ||||
| 2025-04-09 | 13F | Signature Securities Group Corporation | 0 | -100.00 | 0 | -100.00 | ||||
| 2025-07-11 | 13F/A | Umb Bank N A/mo | 27 | -90.53 | 1 | -88.89 | ||||
| 2025-07-25 | 13F | Envestnet Portfolio Solutions, Inc. | 129,989 | -0.96 | 4,837 | 11.04 | ||||
| 2025-08-14 | 13F | Susquehanna International Group, Llp | 41,614 | -28.87 | 1,548 | -20.25 | ||||
| 2025-07-30 | 13F | D.a. Davidson & Co. | 7,530 | 0.00 | 280 | 12.45 | ||||
| 2025-08-14 | 13F | LifePlan Investment Advisors, Inc. | 21,652 | 39.04 | 806 | 56.01 | ||||
| 2025-08-14 | 13F | Comerica Bank | 10,386 | -13.02 | 386 | -2.53 | ||||
| 2025-07-29 | 13F | Harbor Asset Planning, Inc. | 327 | 12 | ||||||
| 2025-08-14 | 13F | 10Elms LLP | 1 | 0.00 | 0 | |||||
| 2025-08-07 | 13F | CENTRAL TRUST Co | 104,317 | 4.10 | 3,882 | 16.76 | ||||
| 2025-07-17 | 13F | CogentBlue Wealth Advisors, LLC | 7,457 | -2.85 | 277 | 9.06 | ||||
| 2025-07-24 | 13F | Mengis Capital Management, Inc. | 5,935 | 221 | ||||||
| 2025-08-14 | 13F | Fmr Llc | 1,795 | -14.40 | 67 | -4.35 | ||||
| 2025-08-01 | 13F | Strategic Financial Services, Inc, | 245,844 | 13.79 | 9,148 | 27.61 | ||||
| 2025-08-19 | NP | GAPIX - Goldman Sachs Dynamic Global Equity Fund Institutional | 85,902 | 14.84 | 3,196 | 28.82 | ||||
| 2025-08-06 | 13F | Mark Sheptoff Financial Planning, Llc | 29 | 0.00 | 1 | |||||
| 2025-08-19 | NP | GOIIX - Goldman Sachs Growth and Income Strategy Portfolio Institutional | 130,954 | 0.00 | 4,873 | 12.13 | ||||
| 2025-04-29 | 13F | Callan Capital, LLC | 99,619 | -1.11 | 3,305 | 2.80 | ||||
| 2025-08-01 | 13F | Bank of Jackson Hole Trust | 0 | -100.00 | 0 | |||||
| 2025-07-07 | 13F | Investors Research Corp | 523 | 0.00 | 19 | 11.76 | ||||
| 2025-08-15 | 13F | Equitable Holdings, Inc. | 0 | -100.00 | 0 | |||||
| 2025-08-12 | 13F | Jpmorgan Chase & Co | 11,495 | 989.57 | 428 | 1,120.00 | ||||
| 2025-07-08 | 13F | Parallel Advisors, LLC | 74 | -25.25 | 3 | -33.33 | ||||
| 2025-08-14 | 13F | Raymond James Financial Inc | 392,021 | 1.29 | 14,587 | 13.60 | ||||
| 2025-08-04 | 13F | Assetmark, Inc | 11 | 0 | ||||||
| 2025-09-04 | 13F/A | Advisor Group Holdings, Inc. | 28,852 | 13.35 | 1,073 | 27.13 | ||||
| 2025-04-21 | 13F | Nelson, Van Denburg & Campbell Wealth Management Group, LLC | 0 | -100.00 | 0 | |||||
| 2025-08-27 | 13F/A | Brinker Capital Investments, LLC | 11,109 | 4.68 | 413 | 17.33 | ||||
| 2025-08-08 | 13F | Pnc Financial Services Group, Inc. | 359 | 0.00 | 13 | 18.18 | ||||
| 2025-08-05 | 13F | GPS Wealth Strategies Group, LLC | 349 | 12.94 | 13 | 20.00 | ||||
| 2025-08-13 | 13F | GeoWealth Management, LLC | 62,562 | -4.39 | 2,328 | 7.23 | ||||
| 2025-08-07 | 13F | Vise Technologies, Inc. | 0 | -100.00 | 0 | |||||
| 2025-08-04 | 13F | Creative Financial Designs Inc /adv | 331 | 0.00 | 12 | 20.00 | ||||
| 2025-08-12 | 13F | O'shaughnessy Asset Management, Llc | 405 | -29.07 | 15 | -16.67 | ||||
| 2025-07-03 | 13F | Arvest Investments, Inc. | 446,226 | -2.49 | 16,604 | 9.35 | ||||
| 2025-08-19 | 13F | Asset Dedication, LLC | 47 | 2 | ||||||
| 2025-07-07 | 13F | Thurston, Springer, Miller, Herd & Titak, Inc. | 111 | 4 | ||||||
| 2025-07-28 | 13F | Morris Financial Concepts, Inc. | 11,485 | -0.57 | 427 | 11.49 | ||||
| 2025-08-11 | 13F | Shufro Rose & Co Llc | 42,591 | -0.71 | 1,413 | -0.70 | ||||
| 2025-04-14 | 13F | Greenspring Advisors, LLC | 6,641 | 0.00 | 220 | 4.27 | ||||
| 2025-08-13 | 13F | Jones Financial Companies Lllp | 2,293 | -39.48 | 85 | -32.54 | ||||
| 2025-07-21 | 13F | Monticello Wealth Management, Llc | 78,368 | -4.43 | 2,916 | 7.21 | ||||
| 2025-08-14 | 13F | EP Wealth Advisors, Inc. | 22,118 | -0.01 | 823 | 12.28 | ||||
| 2025-08-14 | 13F | Jane Street Group, Llc | 131,318 | 932.62 | 4,886 | 1,060.57 | ||||
| 2025-07-28 | 13F | Naviter Wealth, LLC | 5,813 | 216 | ||||||
| 2025-08-14 | 13F | GWM Advisors LLC | 22,129 | 11.89 | 823 | 25.46 | ||||
| 2025-08-13 | 13F | StoneX Group Inc. | 0 | -100.00 | 0 | -100.00 | ||||
| 2025-08-13 | 13F | Flow Traders U.s. Llc | 26,289 | 1 | ||||||
| 2025-08-11 | 13F | Aptus Capital Advisors, LLC | 683 | 0.00 | 25 | 13.64 | ||||
| 2025-08-12 | 13F | Steward Partners Investment Advisory, Llc | 1,560 | 171.30 | 58 | 205.26 | ||||
| 2025-07-17 | 13F | Archford Capital Strategies, LLC | 8,849 | -1.52 | 329 | 10.40 | ||||
| 2025-08-13 | 13F | EverSource Wealth Advisors, LLC | 416 | 0.00 | 15 | 15.38 | ||||
| 2025-08-11 | 13F | Heritage Wealth Advisors | 200 | 0.00 | 7 | 16.67 | ||||
| 2025-08-14 | 13F | Wiley Bros.-aintree Capital, Llc | 32,018 | -0.44 | 1,188 | 11.04 | ||||
| 2025-08-14 | 13F | Mariner, LLC | 53,758 | 0.08 | 2,000 | 12.23 | ||||
| 2025-07-16 | 13F | Signaturefd, Llc | 40 | 1 | ||||||
| 2025-07-18 | 13F | Consolidated Portfolio Review Corp | 8,101 | 301 | ||||||
| 2025-08-15 | 13F | Morgan Stanley | 706,273 | -2.10 | 26,280 | 9.80 | ||||
| 2025-07-24 | 13F | Capital Advisors, Ltd. LLC | 2,302 | -8.61 | 0 | |||||
| 2025-08-06 | 13F | Rialto Wealth Management, LLC | 439 | 0.00 | 16 | 14.29 | ||||
| 2025-07-30 | 13F | Syntegra Private Wealth Group, LLC | 16,350 | 90.14 | 608 | 113.33 | ||||
| 2025-07-14 | 13F | Golden State Equity Partners | 29,712 | -13.21 | 1,106 | -2.73 | ||||
| 2025-08-08 | 13F | Strategies Wealth Advisors, LLC | 11,997 | 0.00 | 446 | 12.06 | ||||
| 2025-08-08 | 13F | Altfest L J & Co Inc | 12,693 | -38.69 | 472 | -31.20 | ||||
| 2025-08-13 | 13F | Marshall Wace, Llp | 147,817 | 722.39 | 5,500 | 822.82 | ||||
| 2025-05-13 | 13F | Bokf, Na | 0 | -100.00 | 0 | |||||
| 2025-07-24 | 13F | Us Bancorp \de\ | 454 | 123.65 | 17 | 166.67 | ||||
| 2025-07-31 | 13F | Buckingham Strategic Partners | 10,197 | 15.91 | 379 | 30.24 | ||||
| 2025-07-14 | 13F | U.S. Capital Wealth Advisors, LLC | 5,973 | -1.86 | 222 | 10.45 | ||||
| 2025-08-12 | 13F | MAI Capital Management | 700 | 0.00 | 26 | 13.04 | ||||
| 2025-08-14 | 13F | Strategic Wealth Designers | 0 | 0 | ||||||
| 2025-07-21 | NP | GGMBX - Goldman Sachs Global Managed Beta Fund Institutional Shares | 1,537,577 | 16.39 | 53,508 | 24.17 | ||||
| 2025-07-29 | 13F | Kelman-Lazarov, Inc. | 15,178 | -65.11 | 565 | -60.91 | ||||
| 2025-08-11 | 13F | HighTower Advisors, LLC | 9,205 | 0.00 | 343 | 12.13 | ||||
| 2025-08-05 | 13F | Bank Of Montreal /can/ | 992 | 37 | ||||||
| 2025-08-12 | 13F | Gladstone Institutional Advisory LLC | 104,923 | 0.87 | 3,904 | 13.13 | ||||
| 2025-08-13 | 13F | Northwestern Mutual Wealth Management Co | 388 | 11.49 | 14 | 27.27 | ||||
| 2025-08-06 | 13F | Commonwealth Equity Services, Llc | 157,937 | -0.34 | 6 | 0.00 | ||||
| 2025-07-24 | 13F | GFG Capital, LLC | 151,428 | -4.95 | 5,635 | 6.58 | ||||
| 2025-07-14 | 13F | AdvisorNet Financial, Inc | 143 | 0.00 | 5 | 25.00 | ||||
| 2025-07-16 | 13F | RWM Asset Management, LLC | 163,880 | 3.31 | 6,098 | 15.85 | ||||
| 2025-07-16 | 13F | Kathmere Capital Management, LLC | 6,433 | -0.60 | 239 | 11.68 | ||||
| 2025-08-13 | 13F | Congress Wealth Management LLC / DE / | 0 | -100.00 | 0 | |||||
| 2025-08-13 | 13F | Haverford Trust Co | 11,576 | 0.00 | 431 | 11.98 | ||||
| 2025-07-09 | 13F | Breakwater Investment Management | 75 | 0.00 | 3 | 0.00 | ||||
| 2025-08-14 | 13F | Smartleaf Asset Management LLC | 2 | -98.17 | 0 | -100.00 | ||||
| 2025-07-08 | 13F | Atwood & Palmer Inc | 47,310 | -1.57 | 1,760 | 10.41 | ||||
| 2025-08-13 | 13F | IAG Wealth Partners, LLC | 17,127 | 72.86 | 637 | 94.21 | ||||
| 2025-08-14 | 13F | Wells Fargo & Company/mn | 3,522,921 | 7.48 | 131,088 | 20.53 | ||||
| 2025-05-15 | 13F | Tower Research Capital LLC (TRC) | 0 | -100.00 | 0 | |||||
| 2025-07-28 | 13F | Harbour Investments, Inc. | 822 | -9.77 | 31 | 0.00 | ||||
| 2025-08-08 | 13F | Cetera Investment Advisers | 350,522 | 1.35 | 13,043 | 13.66 | ||||
| 2025-07-10 | 13F | Wealth Enhancement Advisory Services, Llc | 65,136 | -36.46 | 2,448 | -28.05 | ||||
| 2025-08-14 | 13F | CoreCap Advisors, LLC | 132,106 | 2.52 | 4,916 | 14.97 | ||||
| 2025-05-07 | 13F | WMS Partners, LLC | 0 | -100.00 | 0 | |||||
| 2025-07-16 | 13F | American National Bank | 126,967 | -5.30 | 4,724 | 6.21 | ||||
| 2025-08-14 | 13F | Old Mission Capital Llc | 49,008 | 1,824 | ||||||
| 2025-07-08 | 13F | Apella Capital, LLC | 338,287 | -15.74 | 12,530 | -0.79 | ||||
| 2025-08-12 | 13F | LPL Financial LLC | 1,918,529 | 5.94 | 71,388 | 18.81 | ||||
| 2025-08-19 | NP | GGSIX - Goldman Sachs Growth Strategy Portfolio Institutional | 197,259 | 0.00 | 7,340 | 12.15 | ||||
| 2025-05-15 | 13F | Chilton Investment Co Llc | 0 | -100.00 | 0 | |||||
| 2025-07-24 | 13F | Edge Financial Advisors LLC | 20,015 | -10.51 | 745 | 0.27 | ||||
| 2025-08-13 | 13F | Brown Advisory Inc | 0 | -100.00 | 0 | |||||
| 2025-08-14 | 13F | UBS Group AG | 258,100 | 4.17 | 9,604 | 16.81 | ||||
| 2025-07-25 | 13F | Cwm, Llc | 186 | -49.87 | 0 | |||||
| 2025-05-09 | 13F | NewEdge Wealth, LLC | 0 | -100.00 | 0 | |||||
| 2025-08-18 | 13F | Geneos Wealth Management Inc. | 290 | 11 | ||||||
| 2025-08-07 | 13F | Allworth Financial LP | 974 | 0.00 | 36 | 12.50 | ||||
| 2025-08-13 | 13F | SageView Advisory Group, LLC | 15,596 | -1.52 | 589 | 12.19 | ||||
| 2025-07-17 | 13F | Independence Bank of Kentucky | 850 | 32 | ||||||
| 2025-08-12 | 13F | Inscription Capital, LLC | 0 | -100.00 | 0 | |||||
| 2025-08-19 | NP | GIPIX - Goldman Sachs Balanced Strategy Portfolio Institutional | 49,119 | 0.00 | 1,828 | 12.15 | ||||
| 2025-07-17 | 13F | Clay Northam Wealth Management, LLC | 53,457 | 0.00 | 1,989 | 12.18 | ||||
| 2025-07-29 | 13F | Private Trust Co Na | 2,149 | 29.61 | 80 | 43.64 | ||||
| 2025-08-01 | 13F | Envestnet Asset Management Inc | 815,464 | 4.70 | 30,343 | 17.42 | ||||
| 2025-07-30 | 13F | Princeton Global Asset Management LLC | 497 | 0.00 | 18 | 12.50 | ||||
| 2025-07-17 | 13F | Worth Financial Advisory Group, LLC | 13,703 | -4.17 | 510 | 7.38 | ||||
| 2025-08-08 | 13F | Arvest Bank Trust Division | 1,212,184 | -0.59 | 45,105 | 11.48 | ||||
| 2025-08-08 | 13F | Larson Financial Group LLC | 0 | -100.00 | 0 | |||||
| 2025-07-25 | 13F | PrairieView Partners, LLC | 104 | 0.00 | 0 | |||||
| 2025-07-30 | 13F | Gables Capital Management Inc. | 4 | 0.00 | 0 | |||||
| 2025-08-11 | 13F | TD Waterhouse Canada Inc. | 1,075 | -20.37 | 40 | -11.11 | ||||
| 2025-07-28 | 13F | Frazier Financial Advisors, LLC | 10 | 0.00 | 0 | |||||
| 2025-07-10 | 13F | Wedmont Private Capital | 8,000 | 0.00 | 298 | 17.32 | ||||
| 2025-05-15 | 13F | Alexis Investment Partners, LLC | 0 | -100.00 | 0 | |||||
| 2025-08-12 | 13F | Global Retirement Partners, LLC | 8,068 | 19.03 | 300 | 38.89 | ||||
| 2025-08-29 | 13F | Centaurus Financial, Inc. | 4,200 | 11.26 | 0 | |||||
| 2025-07-18 | 13F | SigFig Wealth Management, LLC | 3,303,512 | -1.07 | 122,659 | 10.43 | ||||
| 2025-04-21 | 13F | Ronald Blue Trust, Inc. | 0 | -100.00 | 0 | -100.00 | ||||
| 2025-07-22 | 13F | Coastal Investment Advisors, Inc. | 0 | -100.00 | 0 | |||||
| 2025-08-12 | 13F | Change Path, LLC | 11,209 | -2.96 | 417 | 8.88 | ||||
| 2025-07-25 | 13F | Atria Wealth Solutions, Inc. | 13,771 | -55.86 | 512 | -50.53 | ||||
| 2025-08-13 | 13F | Colonial Trust Co / SC | 208 | 0.00 | 8 | 16.67 | ||||
| 2025-05-15 | 13F/A | Orion Portfolio Solutions, LLC | 10,612 | 40.11 | 352 | 46.06 | ||||
| 2025-07-08 | 13F | Nbc Securities, Inc. | 455 | 0.00 | 0 | |||||
| 2025-07-28 | 13F | BRYN MAWR TRUST Co | 4,410 | -9.59 | 164 | 1.86 | ||||
| 2025-08-14 | 13F | Keebeck Wealth Management, LLC | 30,865 | 1,148 | ||||||
| 2025-07-23 | 13F | West Paces Advisors Inc. | 0 | -100.00 | 0 |
Other Listings
| MX:GEM |