Mga Batayang Estadistika
| Pemilik Institusional | 141 total, 141 long only, 0 short only, 0 long/short - change of -2.07% MRQ |
| Alokasi Portofolio Rata-rata | 0.0440 % - change of -25.27% MRQ |
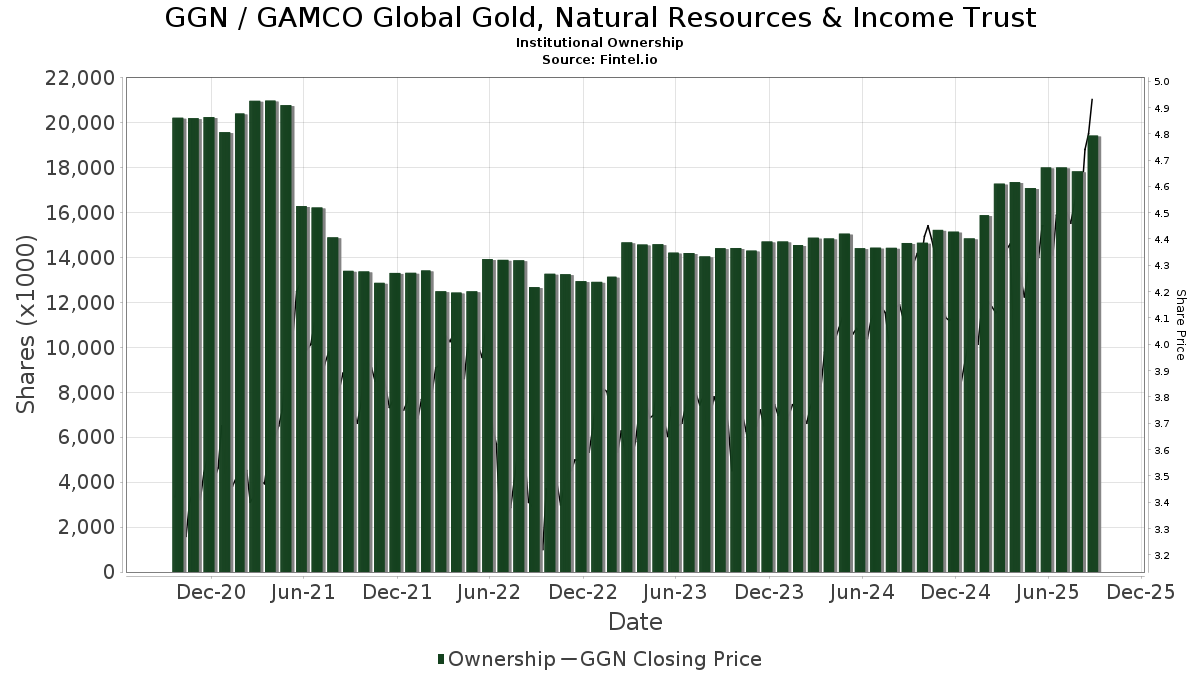
| Saham Institusional (Jangka Panjang) | 19,441,107 (ex 13D/G) - change of 1.44MM shares 7.97% MRQ |
| Nilai Institusional (Jangka Panjang) | $ 78,297 USD ($1000) |
Kepemilikan Institusional dan Pemegang Saham
GAMCO Global Gold, Natural Resources & Income Trust (US:GGN) memiliki 141 pemilik institusional dan pemegang saham yang telah mengajukan formulir 13D/G atau 13F kepada Komisi Bursa Efek (Securities Exchange Commission/SEC). Lembaga-lembaga ini memegang total 19,441,107 saham. Pemegang saham terbesar meliputi Morgan Stanley, Formidable Asset Management, LLC, Sovran Advisors, LLC, Bank Of America Corp /de/, Cornerstone Advisors, LLC, Wells Fargo & Company/mn, Janney Montgomery Scott LLC, Commonwealth Equity Services, Llc, Private Advisor Group, LLC, and Advisor Group Holdings, Inc. .
Struktur kepemilikan institusional GAMCO Global Gold, Natural Resources & Income Trust (NYSEAM:GGN) menunjukkan posisi terkini di perusahaan oleh institusi dan dana, serta perubahan terbaru dalam ukuran posisi. Pemegang saham utama dapat mencakup investor individu, reksa dana, dana lindung nilai, atau institusi. Jadwal 13D menunjukkan bahwa investor memegang (atau pernah memegang) lebih dari 5% saham perusahaan dan bermaksud (atau pernah bermaksud) untuk secara aktif mengejar perubahan strategi bisnis. Jadwal 13G menunjukkan investasi pasif lebih dari 5%.
The share price as of September 5, 2025 is 4.81 / share. Previously, on September 9, 2024, the share price was 4.08 / share. This represents an increase of 18.04% over that period.
Skor Sentimen Dana
Skor Sentimen Dana (sebelumnya dikenal sebagai Skor Akumulasi Kepemilikan) menemukan saham-saham yang paling banyak dibeli oleh dana. Ini adalah hasil dari model kuantitatif multi-faktor yang canggih yang mengidentifikasi perusahaan dengan tingkat akumulasi institusional tertinggi. Model penilaian menggunakan kombinasi dari total peningkatan pemilik yang diungkapkan, perubahan dalam alokasi portofolio pada pemilik tersebut, dan metrik lainnya. Angka berkisar dari 0 hingga 100, dengan angka yang lebih tinggi menunjukkan tingkat akumulasi yang lebih tinggi dibandingkan dengan perusahaan sejenisnya, dan 50 adalah rata-ratanya.
Frekuensi Pembaruan: Setiap Hari
Lihat Ownership Explorer, yang menyediakan daftar perusahaan dengan peringkat tertinggi.
Rasio Put/Call Institusional
Selain melaporkan isu ekuitas dan utang standar, institusi dengan aset di bawah manajemen lebih dari 100 juta dolar AS juga harus mengungkapkan kepemilikan opsi put dan call mereka. Karena opsi put umumnya menunjukkan sentimen negatif, dan opsi call menunjukkan sentimen positif, kita dapat mengetahui sentimen institusional secara keseluruhan dengan memplot rasio put terhadap call. Grafik di sebelah kanan memplot rasio put/call historis untuk instrumen ini.
Menggunakan Rasio Put/Call sebagai indikator sentimen investor mengatasi salah satu kekurangan utama dari penggunaan total kepemilikan institusional, yaitu sejumlah besar aset yang dikelola diinvestasikan secara pasif untuk melacak indeks. Dana yang dikelola secara pasif biasanya tidak membeli opsi, sehingga indikator rasio put/call lebih akurat dalam melacak sentimen dana yang dikelola secara aktif.
Pengajuan 13F dan NPORT
Detail pada pengajuan 13F tersedia gratis. Detail pada pengajuan NP memerlukan keanggotaan premium. Baris berwarna hijau menunjukkan posisi baru. Baris berwarna merah menunjukkan posisi yang sudah ditutup. Klik tautan ini ikon untuk melihat riwayat transaksi selengkapnya.
Tingkatkan
untuk membuka data premium dan mengekspor ke Excel ![]() .
.
| Tanggal File | Sumber | Investor | Ketik | Presyo ng Avg (Silangan) |
Saham | Δ Saham (%) |
Dilaporkan Nilai ($1000) |
Nilai Δ (%) |
Alokasi Port (%) |
|
|---|---|---|---|---|---|---|---|---|---|---|
| 2025-07-09 | 13F | Massmutual Trust Co Fsb/adv | 390 | 0.00 | 2 | 0.00 | ||||
| 2025-08-14 | 13F | Wells Fargo & Company/mn | 689,353 | 9.57 | 3,026 | 10.08 | ||||
| 2025-08-19 | 13F | National Asset Management, Inc. | 37,906 | -7.89 | 166 | 7.10 | ||||
| 2025-08-04 | 13F | Creative Financial Designs Inc /adv | 13,604 | 1.59 | 60 | 1.72 | ||||
| 2025-05-14 | 13F | Jane Street Group, Llc | 0 | -100.00 | 0 | |||||
| 2025-08-14 | 13F | Wealth Preservation Advisors, LLC | 60 | 0.00 | 0 | |||||
| 2025-07-17 | 13F | Barry Investment Advisors, LLC | 11,429 | 0.00 | 50 | 2.04 | ||||
| 2025-07-29 | 13F | Stratos Wealth Partners, LTD. | 38,915 | 3.70 | 171 | 4.29 | ||||
| 2025-08-08 | 13F | Advisors Capital Management, LLC | 22,275 | 0.00 | 98 | 0.00 | ||||
| 2025-08-07 | 13F | Nwam Llc | 70,289 | 32.14 | 309 | 32.76 | ||||
| 2025-08-06 | 13F | Commonwealth Equity Services, Llc | 662,917 | -3.14 | 3 | 0.00 | ||||
| 2025-08-05 | 13F | Huntington National Bank | 2 | -83.33 | ||||||
| 2025-08-12 | 13F | Global Retirement Partners, LLC | 2,170 | 0.00 | 10 | 12.50 | ||||
| 2025-08-22 | NP | Cornerstone Total Return Fund Inc | 247,518 | 92.59 | 1,087 | 93.58 | ||||
| 2025-08-06 | 13F | Vantage Financial Partners, LLC | 24,311 | -30.44 | 107 | -30.26 | ||||
| 2025-08-08 | 13F | Cornerstone Advisors, LLC | 754,825 | 90.16 | 3,314 | 91.06 | ||||
| 2025-07-15 | 13F | Fortitude Family Office, LLC | 43,000 | 0.00 | 189 | 0.53 | ||||
| 2025-07-02 | 13F | Capital Market Strategies LLC | 40,052 | -6.89 | 176 | -6.42 | ||||
| 2025-07-29 | 13F | International Assets Investment Management, Llc | 45,737 | 0.07 | 201 | 0.50 | ||||
| 2025-08-14 | 13F | Colony Group, LLC | 25,139 | 9.30 | 110 | 10.00 | ||||
| 2025-08-14 | 13F | GWM Advisors LLC | 5,458 | -6.27 | 24 | -8.00 | ||||
| 2025-07-18 | 13F | PFG Investments, LLC | 80,151 | 1.24 | 352 | 1.74 | ||||
| 2025-08-12 | 13F | XTX Topco Ltd | 0 | -100.00 | 0 | |||||
| 2025-07-10 | 13F | Sovran Advisors, LLC | 975,152 | -3.77 | 4,330 | -0.64 | ||||
| 2025-08-14 | 13F | Mml Investors Services, Llc | 21,274 | -4.65 | 0 | |||||
| 2025-08-12 | 13F | Virtu Financial LLC | 31,837 | 0 | ||||||
| 2025-07-30 | 13F | Tricadia Capital Management, LLC | 103,471 | -4.19 | 454 | -3.61 | ||||
| 2025-05-06 | 13F | Pinnacle Associates Ltd | 0 | -100.00 | 0 | -100.00 | ||||
| 2025-08-04 | 13F | L.m. Kohn & Company | 31,904 | 0.00 | 140 | 0.72 | ||||
| 2025-07-07 | 13F | Medici Capital Llc | 0 | -100.00 | 0 | |||||
| 2025-08-04 | 13F | Assetmark, Inc | 3,900 | 17 | ||||||
| 2025-07-17 | 13F | Sound Income Strategies, LLC | 635 | 0.00 | 3 | 0.00 | ||||
| 2025-08-04 | 13F | Live Oak Private Wealth LLC | 63,152 | 0.00 | 277 | 0.73 | ||||
| 2025-08-13 | 13F | Jones Financial Companies Lllp | 0 | -100.00 | 0 | -100.00 | ||||
| 2025-08-13 | 13F | StoneX Group Inc. | 22,465 | -0.77 | 99 | 0.00 | ||||
| 2025-07-22 | 13F | Coastal Investment Advisors, Inc. | 11,480 | 0.00 | 50 | 0.00 | ||||
| 2025-08-08 | 13F | Cetera Investment Advisers | 447,415 | -8.67 | 1,964 | -8.22 | ||||
| 2025-08-04 | 13F | Spire Wealth Management | 0 | -100.00 | 0 | |||||
| 2025-08-04 | 13F | Wolverine Asset Management Llc | 53,283 | 289.18 | 234 | 294.92 | ||||
| 2025-08-11 | 13F | Tidemark, LLC | 598 | 0.00 | 3 | 0.00 | ||||
| 2025-08-11 | 13F | Private Advisor Group, LLC | 572,887 | 23.39 | 2,515 | 23.90 | ||||
| 2025-08-13 | 13F | Beacon Pointe Advisors, LLC | 19,271 | -3.93 | 85 | -3.45 | ||||
| 2025-08-13 | 13F | Baird Financial Group, Inc. | 98,070 | 18.14 | 431 | 18.78 | ||||
| 2025-08-07 | 13F | Montag A & Associates Inc | 9,287 | 0.00 | 41 | 0.00 | ||||
| 2025-08-18 | 13F | Ashford Capital Management Inc | 146,000 | 0.00 | 641 | 0.31 | ||||
| 2025-08-14 | 13F | Royal Bank Of Canada | 263,658 | 4.64 | 1,157 | 5.09 | ||||
| 2025-08-12 | 13F | O'shaughnessy Asset Management, Llc | 11,672 | 2.08 | 51 | 4.08 | ||||
| 2025-05-13 | 13F | EverSource Wealth Advisors, LLC | 0 | -100.00 | 0 | |||||
| 2025-08-01 | 13F | Vision Financial Markets Llc | 415 | 2.22 | 2 | 0.00 | ||||
| 2025-04-22 | 13F | Synergy Financial Management, LLC | 0 | -100.00 | 0 | |||||
| 2025-08-08 | 13F | Calamos Advisors LLC | 35,566 | 156 | ||||||
| 2025-07-25 | 13F | Sequoia Financial Advisors, LLC | 26,488 | 28.91 | 116 | 30.34 | ||||
| 2025-05-15 | 13F | Gwn Securities Inc. | 0 | -100.00 | 0 | |||||
| 2025-08-06 | 13F | Wedbush Securities Inc | 38,047 | 1.47 | 0 | |||||
| 2025-08-12 | 13F | Steward Partners Investment Advisory, Llc | 0 | -100.00 | 0 | |||||
| 2025-07-16 | 13F | Formidable Asset Management, LLC | 1,809,051 | 0.00 | 7,906 | 0.00 | ||||
| 2025-08-05 | 13F | Atlas Private Wealth Advisors | 0 | -100.00 | 0 | |||||
| 2025-08-07 | 13F | Allworth Financial LP | 23,510 | 167.19 | 103 | 178.38 | ||||
| 2025-08-12 | 13F | Jpmorgan Chase & Co | 0 | -100.00 | 0 | |||||
| 2025-07-18 | 13F | Trust Co Of Vermont | 1,300 | 0.00 | 6 | 0.00 | ||||
| 2025-07-23 | 13F | WESPAC Advisors, LLC | 33,000 | 0.00 | 145 | 0.00 | ||||
| 2025-08-22 | NP | Cornerstone Strategic Value Fund Inc | 507,307 | 89.00 | 2,227 | 90.02 | ||||
| 2025-08-12 | 13F | Insigneo Advisory Services, Llc | 39,332 | 0.00 | 173 | 0.58 | ||||
| 2025-05-13 | 13F | Bokf, Na | 0 | -100.00 | 0 | -100.00 | ||||
| 2025-04-15 | 13F | Transform Wealth, LLC | 23,167 | 0.00 | 101 | 16.09 | ||||
| 2025-07-11 | 13F | Farther Finance Advisors, LLC | 48,010 | 211 | ||||||
| 2025-08-14 | 13F | Ieq Capital, Llc | 0 | -100.00 | 0 | |||||
| 2025-08-14 | 13F | Stifel Financial Corp | 295,887 | 11.88 | 1,299 | 12.38 | ||||
| 2025-08-19 | 13F | Newbridge Financial Services Group, Inc. | 57,437 | 252 | ||||||
| 2025-04-21 | 13F | Nelson, Van Denburg & Campbell Wealth Management Group, LLC | 0 | -100.00 | 0 | |||||
| 2025-05-15 | 13F | Tower Research Capital LLC (TRC) | 0 | -100.00 | 0 | |||||
| 2025-08-06 | 13F | Golden State Wealth Management, LLC | 520 | 0.00 | 2 | 0.00 | ||||
| 2025-04-29 | 13F | Envestnet Asset Management Inc | 0 | -100.00 | 0 | |||||
| 2025-07-25 | 13F | Cwm, Llc | 400 | -38.46 | 0 | |||||
| 2025-08-12 | 13F | LPL Financial LLC | 436,429 | -1.81 | 1,916 | -1.39 | ||||
| 2025-07-30 | 13F | Capital Wealth Alliance, LLC | 315,083 | -54.00 | 1,383 | -61.74 | ||||
| 2025-08-12 | 13F | Park Square Financial Group, LLC | 0 | -100.00 | 0 | |||||
| 2025-08-04 | 13F | Creekmur Asset Management LLC | 1,065 | 2.11 | 5 | 0.00 | ||||
| 2025-08-08 | 13F | Maple Capital Management, Inc. | 0 | -100.00 | 0 | |||||
| 2025-08-14 | 13F | Df Dent & Co Inc | 23,470 | 0.00 | 103 | 0.98 | ||||
| 2025-08-19 | 13F | Advisory Services Network, LLC | 15,797 | 0.00 | 70 | 1.45 | ||||
| 2025-07-31 | 13F | Optimum Investment Advisors | 281,692 | 3.21 | 1,237 | 3.69 | ||||
| 2025-08-04 | 13F | Mesirow Financial Investment Management, Inc. | 0 | -100.00 | 0 | |||||
| 2025-04-23 | 13F | Financial Life Planners | 0 | -100.00 | 0 | |||||
| 2025-05-15 | 13F | Hrt Financial Lp | 0 | -100.00 | 0 | |||||
| 2025-07-24 | 13F | Total Wealth Planning & Management, Inc. | 101,751 | 0.02 | 447 | 0.45 | ||||
| 2025-08-15 | 13F | Morgan Stanley | 3,319,075 | 1.90 | 14,571 | 2.37 | ||||
| 2025-07-30 | 13F | D.a. Davidson & Co. | 15,908 | -18.03 | 70 | -17.86 | ||||
| 2025-05-14 | 13F | Van Hulzen Asset Management, LLC | 0 | -100.00 | 0 | -100.00 | ||||
| 2025-07-16 | 13F | Brown, Lisle/cummings, Inc. | 23,193 | -7.71 | 102 | -7.34 | ||||
| 2025-08-11 | 13F | HighTower Advisors, LLC | 39,780 | 5.47 | 175 | 6.10 | ||||
| 2025-07-24 | 13F | Eastern Bank | 220,550 | 0.00 | 968 | 0.52 | ||||
| 2025-08-14 | 13F | Hurley Capital, LLC | 3,963 | 2.09 | 17 | 6.25 | ||||
| 2025-08-05 | 13F | Bank Of Montreal /can/ | 74,817 | 0.02 | 328 | 0.61 | ||||
| 2025-04-23 | 13F | GHP Investment Advisors, Inc. | 0 | -100.00 | 0 | |||||
| 2025-07-28 | 13F | RFG Advisory, LLC | 24,042 | 9.28 | 106 | 9.38 | ||||
| 2025-08-12 | 13F | Proequities, Inc. | 0 | 0 | ||||||
| 2025-08-12 | 13F | MAI Capital Management | 2,929 | 2.06 | 13 | 0.00 | ||||
| 2025-08-08 | 13F | Creative Planning | 15,931 | 14.36 | 70 | 15.00 | ||||
| 2025-07-28 | 13F | BRYN MAWR TRUST Co | 13,025 | 0.00 | 57 | 1.79 | ||||
| 2025-08-05 | 13F | Strategic Financial Concepts, LLC | 12,300 | 0.00 | 54 | 0.00 | ||||
| 2025-07-23 | 13F | Sachetta, LLC | 6 | 0.00 | 0 | |||||
| 2025-08-12 | 13F | NWF Advisory Services Inc. | 116,128 | 507 | ||||||
| 2025-08-13 | 13F | Kayne Anderson Rudnick Investment Management Llc | 2,750 | 0.00 | 12 | 0.00 | ||||
| 2025-07-29 | 13F | Oxbow Advisors, LLC | 91,750 | 0.00 | 403 | 0.50 | ||||
| 2025-08-07 | 13F | Apeiron RIA LLC | 13,104 | 58 | ||||||
| 2025-05-16 | 13F | Coppell Advisory Solutions LLC | 0 | -100.00 | 0 | |||||
| 2025-08-07 | 13F | Samalin Investment Counsel, LLC | 0 | -100.00 | 0 | |||||
| 2025-04-17 | 13F | Grimes & Company, Inc. | 0 | -100.00 | 0 | |||||
| 2025-08-11 | 13F | Citigroup Inc | 3 | 0.00 | 0 | |||||
| 2025-08-14 | 13F | Kovitz Investment Group Partners, LLC | 23,167 | 102 | ||||||
| 2025-07-10 | 13F | High Net Worth Advisory Group LLC | 19,475 | 0.00 | 85 | 0.00 | ||||
| 2025-08-18 | 13F | N.E.W. Advisory Services LLC | 800 | 0.00 | 4 | 0.00 | ||||
| 2025-07-30 | 13F | Gables Capital Management Inc. | 3,333 | 0.00 | 15 | 0.00 | ||||
| 2025-08-15 | 13F | Equitable Holdings, Inc. | 0 | -100.00 | 0 | |||||
| 2025-07-25 | 13F | Atria Wealth Solutions, Inc. | 100,360 | -2.58 | 441 | -2.22 | ||||
| 2025-07-21 | 13F | Ashton Thomas Securities, Llc | 122,700 | 0.00 | 539 | 0.37 | ||||
| 2025-04-25 | 13F | Root Financial Partners, LLC | 0 | -100.00 | 0 | |||||
| 2025-07-22 | 13F | Merit Financial Group, LLC | 29,157 | 92.84 | 128 | 92.42 | ||||
| 2025-07-24 | 13F | IFP Advisors, Inc | 0 | -100.00 | 0 | |||||
| 2025-07-16 | 13F | Pacific Sage Partners, LLC | 17,345 | 0.00 | 76 | 1.33 | ||||
| 2025-07-23 | 13F | Tcfg Wealth Management, Llc | 50,240 | 0.00 | 221 | 0.46 | ||||
| 2025-07-31 | 13F | Moloney Securities Asset Management, LLC | 14,798 | 65 | ||||||
| 2025-08-06 | 13F | Moors & Cabot, Inc. | 213,900 | 0.00 | 939 | 0.54 | ||||
| 2025-08-14 | 13F | IPG Investment Advisors LLC | 10,000 | 44 | ||||||
| 2025-05-07 | 13F | Sheaff Brock Investment Advisors, LLC | 14,000 | 61 | ||||||
| 2025-07-15 | 13F | LVZ Advisors, Inc. | 36,191 | 0.00 | 159 | 0.00 | ||||
| 2025-07-24 | 13F | Comprehensive Money Management Services LLC | 69,896 | -0.57 | 307 | -0.33 | ||||
| 2025-08-13 | 13F | Continuum Advisory, LLC | 0 | -100.00 | 0 | |||||
| 2025-09-04 | 13F/A | Advisor Group Holdings, Inc. | 567,969 | 101.91 | 2,493 | 102.85 | ||||
| 2025-07-08 | 13F | Nbc Securities, Inc. | 4,000 | 0 | ||||||
| 2025-07-08 | 13F/A | Salem Investment Counselors Inc | 250 | 0.00 | 1 | 0.00 | ||||
| 2025-04-15 | 13F | Fifth Third Bancorp | 0 | -100.00 | 0 | |||||
| 2025-08-12 | 13F | Advisors Asset Management, Inc. | 380,045 | -0.31 | 1,668 | 0.12 | ||||
| 2025-08-14 | 13F | Mercer Global Advisors Inc /adv | 20,755 | 0.77 | 91 | 1.11 | ||||
| 2025-08-04 | 13F | Integrity Alliance, Llc. | 0 | -100.00 | 0 | |||||
| 2025-07-31 | 13F | Cambridge Investment Research Advisors, Inc. | 54,759 | -5.92 | 0 | |||||
| 2025-07-17 | 13F | Sonora Investment Management Group, LLC | 91,627 | 0.70 | 402 | 1.26 | ||||
| 2025-07-31 | 13F | Oppenheimer & Co Inc | 96,300 | 0.00 | 423 | 0.48 | ||||
| 2025-08-12 | 13F | Landscape Capital Management, L.l.c. | 101,937 | 150.07 | 448 | 151.12 | ||||
| 2025-08-14 | 13F | Federation des caisses Desjardins du Quebec | 1,000 | 0.00 | 4 | 0.00 | ||||
| 2025-07-14 | 13F | Acropolis Investment Management, LLC | 12,000 | 53 | ||||||
| 2025-08-14 | 13F | CoreCap Advisors, LLC | 4,000 | 18 | ||||||
| 2025-08-15 | 13F | Kestra Advisory Services, LLC | 180,338 | 1.62 | 792 | 2.06 | ||||
| 2025-07-16 | 13F | MJT & Associates Financial Advisory Group, Inc. | 0 | -100.00 | 0 | |||||
| 2025-07-23 | 13F | Detalus Advisors, LLC | 13,323 | 1.25 | 58 | 1.75 | ||||
| 2025-08-14 | 13F | Raymond James Financial Inc | 460,108 | 40.68 | 2,020 | 41.29 | ||||
| 2025-08-05 | 13F | Sigma Planning Corp | 83,917 | -1.19 | 368 | -0.81 | ||||
| 2025-05-15 | 13F | Two Sigma Securities, Llc | 0 | -100.00 | 0 | -100.00 | ||||
| 2025-08-07 | 13F | Kestra Private Wealth Services, Llc | 122,440 | -1.79 | 538 | -1.29 | ||||
| 2025-04-17 | 13F | FNY Investment Advisers, LLC | 0 | -100.00 | 0 | |||||
| 2025-07-29 | 13F | Stephens Inc /ar/ | 19,220 | 92.20 | 84 | 95.35 | ||||
| 2025-08-13 | 13F | Northwestern Mutual Wealth Management Co | 7,771 | 5.43 | 34 | 6.25 | ||||
| 2025-08-06 | 13F | Texas Yale Capital Corp. | 25,000 | 92.31 | 110 | 94.64 | ||||
| 2025-08-13 | 13F | Truvestments Capital Llc | 202 | 0.00 | 1 | |||||
| 2025-07-30 | 13F | Onyx Bridge Wealth Group LLC | 28,024 | 0.86 | 123 | 1.65 | ||||
| 2025-08-05 | 13F | Freestone Capital Holdings, LLC | 13,100 | 2.07 | 58 | 1.79 | ||||
| 2025-07-17 | 13F | Janney Montgomery Scott LLC | 671,537 | 54.73 | 3 | 100.00 | ||||
| 2025-07-18 | 13F | Truist Financial Corp | 86,862 | 4.58 | 381 | 5.25 | ||||
| 2025-08-14 | 13F | Bank Of America Corp /de/ | 946,230 | 9.37 | 4,154 | 9.87 | ||||
| 2025-08-14 | 13F | Mariner, LLC | 15,793 | 3.32 | 69 | 4.55 | ||||
| 2025-04-21 | 13F | Taddei, Ludwig & Associates, Inc. | 0 | -100.00 | 0 | -100.00 | ||||
| 2025-08-04 | 13F | Flagship Harbor Advisors, Llc | 19,900 | -8.51 | 87 | -8.42 | ||||
| 2025-07-28 | 13F | Frazier Financial Advisors, LLC | 446 | 0.00 | 2 | 0.00 | ||||
| 2025-08-11 | 13F | Elequin Capital Lp | 0 | -100.00 | 0 | |||||
| 2025-08-14 | 13F | UBS Group AG | 177,634 | 38.72 | 780 | 39.36 | ||||
| 2025-08-12 | 13F | J.w. Cole Advisors, Inc. | 136,312 | 8.77 | 598 | 9.32 | ||||
| 2025-07-29 | 13F | Huntleigh Advisors, Inc. | 10,000 | 0.00 | 44 | 0.00 | ||||
| 2025-08-13 | 13F | Walleye Capital LLC | 44,989 | 198 | ||||||
| 2025-08-14 | 13F | Atomi Financial Group, Inc. | 30,422 | 134 | ||||||
| 2025-07-25 | 13F | Mitchell Sinkler & Starr/pa | 13,750 | 0.00 | 60 | 0.00 | ||||
| 2025-08-18 | 13F | Hollencrest Capital Management | 2,450 | 0.00 | 11 | 0.00 | ||||
| 2025-08-06 | 13F | Modera Wealth Management, LLC | 13,651 | 1.69 | 60 | 1.72 | ||||
| 2025-07-11 | 13F | Vanguard Capital Wealth Advisors This fund is a listed as child fund of Vanguard Group Inc and if that institution has disclosed ownership in this security, then these positions will not be double counted when calculating total shares and total value | 23,642 | -57.04 | 104 | -57.08 | ||||
| 2025-08-14 | 13F | Garden State Investment Advisory Services LLC | 98,963 | -4.84 | 434 | -4.41 | ||||
| 2025-05-06 | 13F | WT Wealth Management | 27,119 | -6.07 | 119 | 9.26 | ||||
| 2025-08-13 | 13F | Rsm Us Wealth Management Llc | 11,200 | 0.00 | 49 | 2.08 | ||||
| 2025-08-04 | 13F | Bay Colony Advisory Group, Inc d/b/a Bay Colony Advisors | 150,084 | 11.20 | 659 | 12.48 | ||||
| 2025-08-15 | 13F | WFA of San Diego, LLC | 2,300 | 10 | ||||||
| 2025-08-13 | 13F | Townsquare Capital Llc | 0 | -100.00 | 0 | |||||
| 2025-08-06 | 13F | Carnegie Lake Advisors LLC | 107,981 | -5.22 | 0 | |||||
| 2025-08-08 | 13F | Avantax Advisory Services, Inc. | 29,507 | 1.57 | 130 | 2.38 |