Mga Batayang Estadistika
| Pemilik Institusional | 122 total, 122 long only, 0 short only, 0 long/short - change of 3.36% MRQ |
| Alokasi Portofolio Rata-rata | 0.2334 % - change of 1.62% MRQ |
| Saham Institusional (Jangka Panjang) | 50,141,240 (ex 13D/G) - change of 0.97MM shares 1.98% MRQ |
| Nilai Institusional (Jangka Panjang) | $ 1,415,996 USD ($1000) |
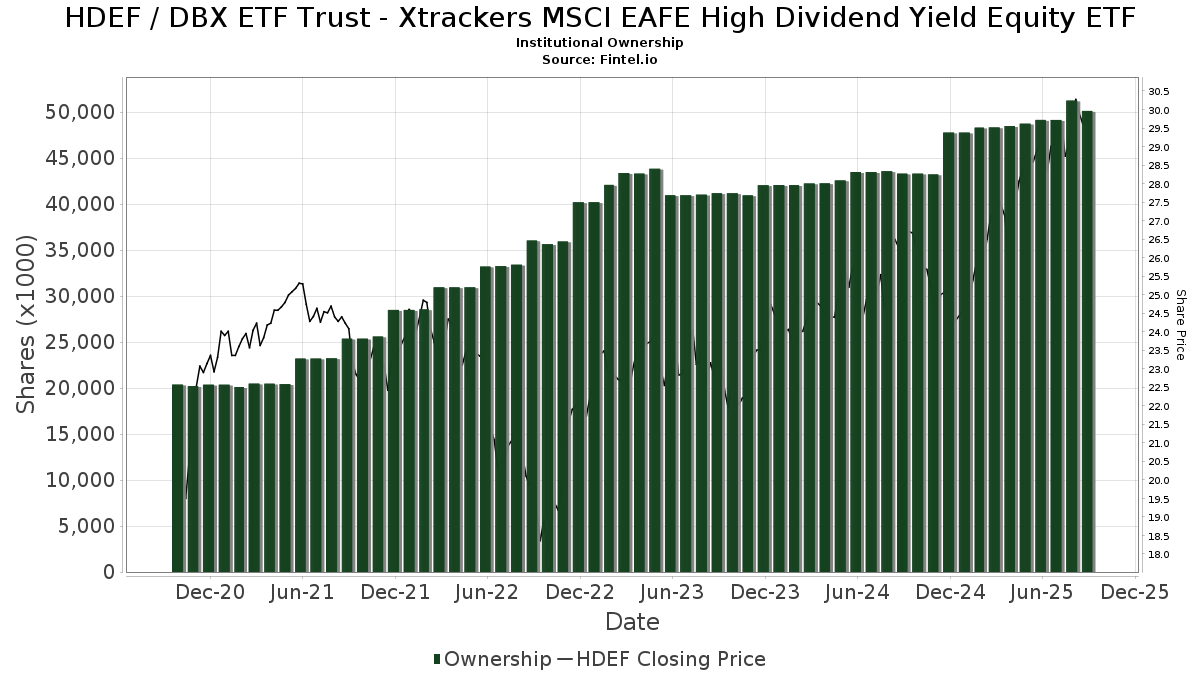
Kepemilikan Institusional dan Pemegang Saham
DBX ETF Trust - Xtrackers MSCI EAFE High Dividend Yield Equity ETF (US:HDEF) memiliki 122 pemilik institusional dan pemegang saham yang telah mengajukan formulir 13D/G atau 13F kepada Komisi Bursa Efek (Securities Exchange Commission/SEC). Lembaga-lembaga ini memegang total 50,141,240 saham. Pemegang saham terbesar meliputi Charles Schwab Investment Management Inc, Allworth Financial LP, O'Brien Wealth Partners LLC, Wealth Enhancement Advisory Services, Llc, Bank Of America Corp /de/, Geneos Wealth Management Inc., Wells Fargo & Company/mn, UBS Group AG, Morgan Stanley, and CI Private Wealth, LLC .
Struktur kepemilikan institusional DBX ETF Trust - Xtrackers MSCI EAFE High Dividend Yield Equity ETF (ARCA:HDEF) menunjukkan posisi terkini di perusahaan oleh institusi dan dana, serta perubahan terbaru dalam ukuran posisi. Pemegang saham utama dapat mencakup investor individu, reksa dana, dana lindung nilai, atau institusi. Jadwal 13D menunjukkan bahwa investor memegang (atau pernah memegang) lebih dari 5% saham perusahaan dan bermaksud (atau pernah bermaksud) untuk secara aktif mengejar perubahan strategi bisnis. Jadwal 13G menunjukkan investasi pasif lebih dari 5%.
The share price as of September 5, 2025 is 29.85 / share. Previously, on September 9, 2024, the share price was 26.29 / share. This represents an increase of 13.54% over that period.
Skor Sentimen Dana
Skor Sentimen Dana (sebelumnya dikenal sebagai Skor Akumulasi Kepemilikan) menemukan saham-saham yang paling banyak dibeli oleh dana. Ini adalah hasil dari model kuantitatif multi-faktor yang canggih yang mengidentifikasi perusahaan dengan tingkat akumulasi institusional tertinggi. Model penilaian menggunakan kombinasi dari total peningkatan pemilik yang diungkapkan, perubahan dalam alokasi portofolio pada pemilik tersebut, dan metrik lainnya. Angka berkisar dari 0 hingga 100, dengan angka yang lebih tinggi menunjukkan tingkat akumulasi yang lebih tinggi dibandingkan dengan perusahaan sejenisnya, dan 50 adalah rata-ratanya.
Frekuensi Pembaruan: Setiap Hari
Lihat Ownership Explorer, yang menyediakan daftar perusahaan dengan peringkat tertinggi.
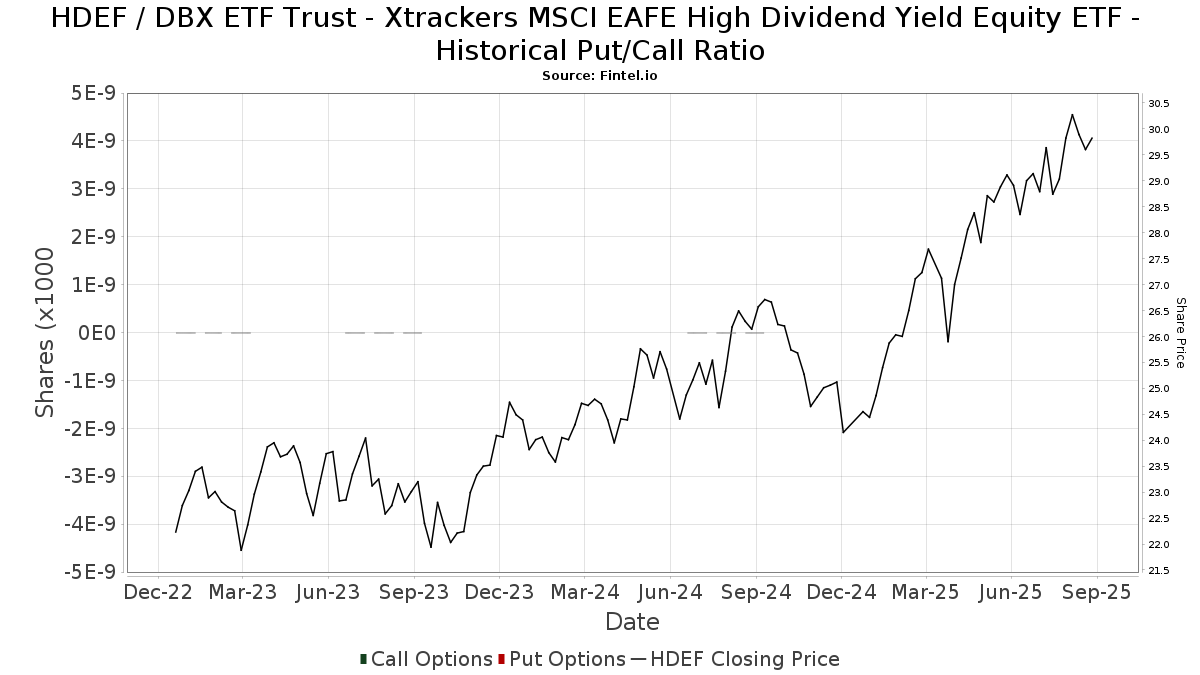
Rasio Put/Call Institusional
Selain melaporkan isu ekuitas dan utang standar, institusi dengan aset di bawah manajemen lebih dari 100 juta dolar AS juga harus mengungkapkan kepemilikan opsi put dan call mereka. Karena opsi put umumnya menunjukkan sentimen negatif, dan opsi call menunjukkan sentimen positif, kita dapat mengetahui sentimen institusional secara keseluruhan dengan memplot rasio put terhadap call. Grafik di sebelah kanan memplot rasio put/call historis untuk instrumen ini.
Menggunakan Rasio Put/Call sebagai indikator sentimen investor mengatasi salah satu kekurangan utama dari penggunaan total kepemilikan institusional, yaitu sejumlah besar aset yang dikelola diinvestasikan secara pasif untuk melacak indeks. Dana yang dikelola secara pasif biasanya tidak membeli opsi, sehingga indikator rasio put/call lebih akurat dalam melacak sentimen dana yang dikelola secara aktif.
Pengajuan 13F dan NPORT
Detail pada pengajuan 13F tersedia gratis. Detail pada pengajuan NP memerlukan keanggotaan premium. Baris berwarna hijau menunjukkan posisi baru. Baris berwarna merah menunjukkan posisi yang sudah ditutup. Klik tautan ini ikon untuk melihat riwayat transaksi selengkapnya.
Tingkatkan
untuk membuka data premium dan mengekspor ke Excel ![]() .
.
| Tanggal File | Sumber | Investor | Ketik | Presyo ng Avg (Silangan) |
Saham | Δ Saham (%) |
Dilaporkan Nilai ($1000) |
Nilai Δ (%) |
Alokasi Port (%) |
|
|---|---|---|---|---|---|---|---|---|---|---|
| 2025-08-11 | 13F | HighTower Advisors, LLC | 160,235 | 29.02 | 4,624 | 37.21 | ||||
| 2025-04-18 | 13F | Pacific Capital Wealth Advisors, Inc | 0 | -100.00 | 0 | |||||
| 2025-08-15 | 13F | Captrust Financial Advisors | 48,997 | 16.67 | 1,414 | 24.14 | ||||
| 2025-05-14 | 13F | Colonial Trust Co / SC | 0 | -100.00 | 0 | |||||
| 2025-08-07 | 13F | PFG Advisors | 0 | -100.00 | 0 | |||||
| 2025-05-27 | NP | EVCLX - The E-Valuator Conservative (15%-30%) RMS Fund Service Class Shares | 4,460 | 18.49 | 121 | 32.97 | ||||
| 2025-08-14 | 13F | Qube Research & Technologies Ltd | 4,390 | 111.67 | 127 | 125.00 | ||||
| 2025-07-09 | 13F | O'Brien Wealth Partners LLC | 1,791,122 | 51,692 | ||||||
| 2025-07-23 | 13F | ETF Portfolio Partners, Inc. | 282,654 | 6.44 | 8,157 | 13.20 | ||||
| 2025-08-08 | 13F | Financial Gravity Companies, Inc. | 531 | 0.00 | 15 | 25.00 | ||||
| 2025-05-27 | NP | EVVLX - The E-Valuator Very Conservative (0%-15%) RMS Fund Service Class Shares | 1,541 | 173.71 | 42 | 215.38 | ||||
| 2025-07-08 | 13F | Parallel Advisors, LLC | 266 | 0.00 | 8 | 0.00 | ||||
| 2025-07-28 | 13F | Mutual Advisors, LLC | 34,855 | -1.75 | 1,025 | 3.85 | ||||
| 2025-05-27 | NP | EVAGX - The E-Valuator Aggressive Growth (85%-99%) RMS Fund Service Class Shares | 93,214 | 19.01 | 2,530 | 32.97 | ||||
| 2025-07-30 | 13F | Whittier Trust Co | 5,814 | 0.00 | 168 | 6.37 | ||||
| 2025-07-02 | 13F | Central Pacific Bank - Trust Division | 73,755 | -13.39 | 2,129 | -7.92 | ||||
| 2025-08-12 | 13F | LPL Financial LLC | 443,049 | 129.26 | 12,786 | 143.82 | ||||
| 2025-08-14 | 13F | Bank Of America Corp /de/ | 958,927 | -6.85 | 27,675 | -0.94 | ||||
| 2025-08-14 | 13F | Aprio Wealth Management, LLC | 161,653 | 11.36 | 4,665 | 18.43 | ||||
| 2025-08-05 | 13F | GPS Wealth Strategies Group, LLC | 1,834 | -62.38 | 53 | -60.61 | ||||
| 2025-08-08 | 13F | Investment Partners, Ltd. | 56,077 | 0.00 | 1,618 | 6.38 | ||||
| 2025-07-10 | 13F | Wealth Enhancement Advisory Services, Llc | 1,650,329 | 7.07 | 47,860 | 14.41 | ||||
| 2025-08-14 | 13F | Bnp Paribas Arbitrage, Sa | 6 | 200.00 | 0 | |||||
| 2025-08-12 | 13F | Jpmorgan Chase & Co | 160,674 | 32.86 | 4,637 | 41.29 | ||||
| 2025-08-15 | 13F | CI Private Wealth, LLC | 596,962 | 0.31 | 17,228 | 6.67 | ||||
| 2025-07-31 | 13F | Buckingham Strategic Partners | 9,254 | -4.70 | 267 | 1.52 | ||||
| 2025-05-15 | 13F | Two Sigma Securities, Llc | 0 | -100.00 | 0 | |||||
| 2025-08-08 | 13F | Pnc Financial Services Group, Inc. | 3,243 | 129.67 | 94 | 144.74 | ||||
| 2025-08-12 | 13F | Steward Partners Investment Advisory, Llc | 5 | 0.00 | 0 | |||||
| 2025-06-10 | 13F | Compass Financial Services Inc | 0 | -100.00 | 0 | |||||
| 2025-08-08 | 13F | Crossmark Global Holdings, Inc. | 50,490 | 25.43 | 1,448 | 33.00 | ||||
| 2025-09-04 | 13F/A | Advisor Group Holdings, Inc. | 67,285 | 97.05 | 1,941 | 109.61 | ||||
| 2025-04-23 | 13F | GHP Investment Advisors, Inc. | 0 | -100.00 | 0 | |||||
| 2025-07-10 | 13F | Kozak & Associates, Inc. | 46 | 0.00 | 1 | 0.00 | ||||
| 2025-08-07 | 13F | BOK Financial Private Wealth, Inc. | 3,859 | -50.00 | 111 | -46.89 | ||||
| 2025-07-28 | 13F | Harbour Investments, Inc. | 226 | 0.00 | 7 | 0.00 | ||||
| 2025-07-31 | 13F | Brighton Jones Llc | 9,454 | 273 | ||||||
| 2025-07-22 | 13F | Private Wealth Group, LLC | 7,739 | 0.00 | 223 | 6.19 | ||||
| 2025-08-13 | 13F | WCG Wealth Advisors LLC | 422,570 | -1.74 | 12,195 | 4.49 | ||||
| 2025-08-14 | 13F | Susquehanna International Group, Llp | 96,498 | 2,785 | ||||||
| 2025-05-15 | 13F/A | Orion Portfolio Solutions, LLC | 268,618 | -6.93 | 7,290 | 3.99 | ||||
| 2025-08-14 | 13F/A | Rockefeller Capital Management L.P. | 412,365 | -0.51 | 11,901 | 5.79 | ||||
| 2025-08-14 | 13F | Ssi Investment Management Llc | 136,493 | -8.47 | 3,939 | -2.67 | ||||
| 2025-08-14 | 13F | Wells Fargo & Company/mn | 874,533 | 434.73 | 25,239 | 468.70 | ||||
| 2025-05-19 | 13F/A | AAFCPAs Wealth Management, LLC | 0 | -100.00 | 0 | |||||
| 2025-08-14 | 13F | Mariner, LLC | 25,468 | -4.98 | 735 | 1.10 | ||||
| 2025-05-15 | 13F | Cullen Capital Management, LLC | 0 | -100.00 | 0 | -100.00 | ||||
| 2025-08-12 | 13F | Charles Schwab Investment Management Inc | 31,151,476 | -9.63 | 899,032 | -3.90 | ||||
| 2025-08-07 | 13F | FDx Advisors, Inc. | 11,758 | -11.29 | 0 | |||||
| 2025-07-21 | 13F | Ameritas Advisory Services, LLC | 302 | 9 | ||||||
| 2025-08-08 | 13F | Cetera Investment Advisers | 321,048 | -0.41 | 9,265 | 5.91 | ||||
| 2025-07-24 | 13F | Robertson Stephens Wealth Management, LLC | 10,655 | 308 | ||||||
| 2025-08-14 | 13F | CoreCap Advisors, LLC | 1,791 | 0.00 | 52 | 6.25 | ||||
| 2025-08-14 | 13F | GWM Advisors LLC | 27,534 | 1.37 | 795 | 7.73 | ||||
| 2025-07-29 | 13F | Private Trust Co Na | 5,745 | 7.77 | 166 | 14.58 | ||||
| 2025-08-06 | 13F | SOUTH STATE Corp | 0 | -100.00 | 0 | |||||
| 2025-08-14 | 13F | UBS Group AG | 842,062 | -1.16 | 24,302 | 5.10 | ||||
| 2025-08-12 | 13F | GDS Wealth Management | 11,237 | 5.91 | 324 | 12.89 | ||||
| 2025-07-25 | 13F | Johnson Investment Counsel Inc | 9,873 | 285 | ||||||
| 2025-08-06 | 13F | First Horizon Advisors, Inc. | 0 | -100.00 | 0 | |||||
| 2025-08-08 | 13F | Avantax Advisory Services, Inc. | 22,583 | -2.75 | 652 | 3.33 | ||||
| 2025-08-12 | 13F | Tradition Wealth Management, LLC | 69,142 | -0.08 | 1,995 | 6.23 | ||||
| 2025-08-14 | 13F | Royal Bank Of Canada | 372,265 | 30.68 | 10,744 | 38.97 | ||||
| 2025-07-24 | 13F | IFP Advisors, Inc | 24,370 | 0.97 | 703 | 7.33 | ||||
| 2025-08-11 | 13F | WPG Advisers, LLC | 59 | 0.00 | 2 | 0.00 | ||||
| 2025-08-13 | 13F | Jones Financial Companies Lllp | 8,735 | 175.29 | 251 | 190.70 | ||||
| 2025-07-09 | 13F | Dynamic Advisor Solutions LLC | 73,720 | -3.81 | 2,128 | 2.26 | ||||
| 2025-07-29 | 13F | Systelligence, LLC | 0 | -100.00 | 0 | |||||
| 2025-08-14 | 13F | Sei Investments Co | 14,158 | -6.81 | 409 | -0.97 | ||||
| 2025-07-22 | 13F | Red Tortoise LLC | 709 | 2.16 | 20 | 11.11 | ||||
| 2025-08-06 | 13F | Savant Capital, LLC | 9,333 | 0.00 | 269 | 6.32 | ||||
| 2025-08-08 | 13F | Creative Planning | 50,825 | 2.87 | 1,467 | 9.40 | ||||
| 2025-08-14 | 13F | Mercer Global Advisors Inc /adv | 11,460 | -28.61 | 331 | -24.14 | ||||
| 2025-05-02 | 13F | Larson Financial Group LLC | 0 | -100.00 | 0 | -100.00 | ||||
| 2025-07-10 | 13F | Orgel Wealth Management, LLC | 31,491 | -5.49 | 909 | 0.44 | ||||
| 2025-05-27 | NP | EVGLX - The E-Valuator Growth (70%-85%) RMS Fund Service Class Shares | 83,696 | -4.77 | 2,272 | 6.42 | ||||
| 2025-08-12 | 13F | MAI Capital Management | 29,379 | -9.91 | 848 | -4.29 | ||||
| 2025-08-05 | 13F | Huntington National Bank | 4 | 0.00 | ||||||
| 2025-08-08 | 13F | Gts Securities Llc | 7,595 | 219 | ||||||
| 2025-08-15 | 13F | Morgan Stanley | 781,903 | 6.17 | 22,566 | 12.90 | ||||
| 2025-05-15 | 13F | Glenmede Trust Co Na | 41,900 | 0.00 | 1,137 | 11.80 | ||||
| 2025-07-17 | 13F | HB Wealth Management, LLC | 10,523 | -7.25 | 304 | -1.30 | ||||
| 2025-07-30 | 13F | Patten Group, Inc. | 15,708 | 453 | ||||||
| 2025-08-13 | 13F | MONECO Advisors, LLC | 8,511 | 0.00 | 246 | 6.52 | ||||
| 2025-07-23 | 13F | Columbus Macro, LLC | 414,357 | -0.07 | 11,958 | 6.26 | ||||
| 2025-07-11 | 13F | Farther Finance Advisors, LLC | 1,153 | 0.00 | 33 | 6.45 | ||||
| 2025-08-08 | 13F | Austin Wealth Management, LLC | 21,653 | -13.22 | 615 | -11.51 | ||||
| 2025-08-14 | 13F | Comerica Bank | 16,000 | 44.80 | 462 | 54.18 | ||||
| 2025-08-13 | 13F | Flow Traders U.s. Llc | 170,880 | 90.62 | 5 | 100.00 | ||||
| 2025-08-14 | 13F | Fmr Llc | 28,604 | 20.15 | 826 | 27.71 | ||||
| 2025-08-14 | 13F | Stifel Financial Corp | 159,121 | 94.07 | 4,592 | 106.38 | ||||
| 2025-08-14 | 13F | MidWestOne Financial Group, Inc. | 54,389 | 8.99 | 1,570 | 15.88 | ||||
| 2025-07-10 | 13F | Signal Advisors Wealth, LLC | 8,130 | 0.00 | 235 | 6.36 | ||||
| 2025-07-17 | 13F | White Pine Investment CO | 257,413 | -2.87 | 7 | 0.00 | ||||
| 2025-05-27 | NP | EVMLX - The E-Valuator Moderate (50%-70%) RMS Fund Service Class Shares | 32,551 | 6.93 | 883 | 19.49 | ||||
| 2025-07-29 | 13F | Regions Financial Corp | 58,636 | 129.36 | 1,692 | 144.16 | ||||
| 2025-08-06 | 13F | Entrewealth, Llc | 8,980 | -34.16 | 259 | -30.00 | ||||
| 2025-08-12 | 13F | Global Retirement Partners, LLC | 739 | 137.62 | 21 | 200.00 | ||||
| 2025-05-27 | NP | EVTTX - The E-Valuator Conservative/Moderate (30%-50%) RMS Fund Service Class Shares | 5,734 | 29.49 | 156 | 44.86 | ||||
| 2025-07-15 | 13F | North Star Investment Management Corp. | 1,621 | 0.00 | 47 | 6.98 | ||||
| 2025-08-01 | 13F | Envestnet Asset Management Inc | 512,442 | 6.42 | 14,789 | 13.17 | ||||
| 2025-08-12 | 13F | AlphaCore Capital LLC | 33,261 | 960 | ||||||
| 2025-08-12 | 13F | Maripau Wealth Management Llc | 8,130 | 0.00 | 235 | 6.36 | ||||
| 2025-08-05 | 13F | Bank Of Montreal /can/ | 601 | -58.64 | 17 | -56.41 | ||||
| 2025-07-18 | 13F | Wetzel Investment Advisors, Inc. | 7,738 | 223 | ||||||
| 2025-08-05 | 13F | Tsfg, Llc | 290,296 | 46.83 | 8 | 60.00 | ||||
| 2025-07-23 | 13F | Valmark Advisers, Inc. | 287,898 | 2.36 | 8,309 | 8.84 | ||||
| 2025-05-09 | 13F | Beta Wealth Group, Inc. | 0 | -100.00 | 0 | |||||
| 2025-07-22 | 13F | Merit Financial Group, LLC | 9,031 | 261 | ||||||
| 2025-08-06 | 13F | Commonwealth Equity Services, Llc | 188,119 | -3.38 | 5 | 0.00 | ||||
| 2025-08-13 | 13F | Cresset Asset Management, LLC | 9,233 | 0.00 | 266 | 6.40 | ||||
| 2025-04-30 | 13F | Sofos Investments, Inc. | 531 | 14 | ||||||
| 2025-08-13 | 13F | Crescent Grove Advisors, LLC | 18,968 | 0.00 | 547 | 6.42 | ||||
| 2025-05-28 | 13F | Intrua Financial, LLC | 0 | -100.00 | 0 | -100.00 | ||||
| 2025-08-06 | 13F | Legacy Wealth Managment, LLC/ID | 0 | -100.00 | 0 | |||||
| 2025-08-12 | 13F | Proequities, Inc. | 0 | 0 | ||||||
| 2025-04-03 | 13F | First Hawaiian Bank | 61,930 | -5.38 | 1,681 | 5.73 | ||||
| 2025-08-07 | 13F | CSM Advisors, LLC | 126,031 | 0.00 | 4 | 0.00 | ||||
| 2025-08-14 | 13F | Integrated Wealth Concepts LLC | 33,470 | 966 | ||||||
| 2025-08-04 | 13F | Pensionmark Financial Group, Llc | 23,766 | -1.43 | 686 | 4.74 | ||||
| 2025-08-06 | 13F/A | Headland Capital, LLC | 12,149 | 2.19 | 351 | 8.70 | ||||
| 2025-07-08 | 13F | Webster Bank, N. A. | 1,911 | 0.00 | 55 | 7.84 | ||||
| 2025-07-10 | 13F | Sovran Advisors, LLC | 11,475 | 332 | ||||||
| 2025-07-17 | 13F | SWS Partners | 118,574 | -1.57 | 3,422 | 4.68 | ||||
| 2025-08-12 | 13F | RiverFront Investment Group, LLC | 276,872 | 37.55 | 7,991 | 46.28 | ||||
| 2025-05-14 | 13F | Oarsman Capital, Inc. | 0 | -100.00 | 0 | -100.00 | ||||
| 2025-07-11 | 13F | Pinnacle Bancorp, Inc. | 0 | -100.00 | 0 | |||||
| 2025-08-07 | 13F | Allworth Financial LP | 1,854,966 | 1.96 | 53,534 | 5.58 | ||||
| 2025-08-14 | 13F | Raymond James Financial Inc | 89,057 | 46.84 | 2,570 | 56.14 | ||||
| 2025-07-25 | 13F | Cwm, Llc | 3,650 | -64.75 | 0 | |||||
| 2025-08-11 | 13F | Principal Securities, Inc. | 0 | -100.00 | 0 | |||||
| 2025-08-13 | 13F | Transce3nd, LLC | 0 | -100.00 | 0 | |||||
| 2025-04-15 | 13F | Fifth Third Bancorp | 0 | -100.00 | 0 | -100.00 | ||||
| 2025-08-06 | 13F | AE Wealth Management LLC | 4,041 | 47.86 | 117 | 56.76 | ||||
| 2025-06-26 | 13F/A | Deutsche Bank Ag\ | 0 | -100.00 | 0 | |||||
| 2025-08-12 | 13F | Coldstream Capital Management Inc | 420,455 | -0.96 | 12,134 | 5.32 | ||||
| 2025-08-27 | 13F/A | Brinker Capital Investments, LLC | 322,048 | 19.89 | 9,294 | 27.49 | ||||
| 2025-08-14 | 13F | Glenmede Investment Management, LP | 41,900 | 1,209 | ||||||
| 2025-07-25 | 13F | Northwest Capital Management Inc | 0 | -100.00 | 0 | |||||
| 2025-08-14 | 13F | Jane Street Group, Llc | 38,216 | 12.59 | 1,103 | 19.65 | ||||
| 2025-07-17 | 13F/A | Capital Investment Advisors, LLC | 39,974 | 1,154 | ||||||
| 2025-07-21 | 13F | Empirical Financial Services, LLC d.b.a. Empirical Wealth Management | 9,715 | 280 | ||||||
| 2025-08-13 | 13F | Northwestern Mutual Wealth Management Co | 13,731 | 2.58 | 396 | 9.09 | ||||
| 2025-08-18 | 13F | Geneos Wealth Management Inc. | 946,990 | 80.64 | 27,330 | 92.10 | ||||
| 2025-08-13 | 13F | Capital Analysts, Inc. | 357 | -9.16 | 0 | |||||
| 2025-08-14 | 13F | Shepherd Kaplan Krochuk, Llc | 102,716 | 22.20 | 2,964 | 29.94 |