Mga Batayang Estadistika
| Pemilik Institusional | 175 total, 175 long only, 0 short only, 0 long/short - change of 2.33% MRQ |
| Alokasi Portofolio Rata-rata | 0.2909 % - change of -20.13% MRQ |
| Saham Institusional (Jangka Panjang) | 3,949,346 (ex 13D/G) - change of 0.14MM shares 3.66% MRQ |
| Nilai Institusional (Jangka Panjang) | $ 491,664 USD ($1000) |
Kepemilikan Institusional dan Pemegang Saham
iShares Trust - iShares U.S. Insurance ETF (US:IAK) memiliki 175 pemilik institusional dan pemegang saham yang telah mengajukan formulir 13D/G atau 13F kepada Komisi Bursa Efek (Securities Exchange Commission/SEC). Lembaga-lembaga ini memegang total 3,949,346 saham. Pemegang saham terbesar meliputi Morgan Stanley, Wells Fargo & Company/mn, Mml Investors Services, Llc, Miracle Mile Advisors, LLC, LPL Financial LLC, SPC Financial, Inc., Stifel Financial Corp, Royal Bank Of Canada, Advisor Group Holdings, Inc., and Bank Of America Corp /de/ .
Struktur kepemilikan institusional iShares Trust - iShares U.S. Insurance ETF (ARCA:IAK) menunjukkan posisi terkini di perusahaan oleh institusi dan dana, serta perubahan terbaru dalam ukuran posisi. Pemegang saham utama dapat mencakup investor individu, reksa dana, dana lindung nilai, atau institusi. Jadwal 13D menunjukkan bahwa investor memegang (atau pernah memegang) lebih dari 5% saham perusahaan dan bermaksud (atau pernah bermaksud) untuk secara aktif mengejar perubahan strategi bisnis. Jadwal 13G menunjukkan investasi pasif lebih dari 5%.
The share price as of September 5, 2025 is 132.19 / share. Previously, on September 9, 2024, the share price was 127.78 / share. This represents an increase of 3.45% over that period.

Skor Sentimen Dana
Skor Sentimen Dana (sebelumnya dikenal sebagai Skor Akumulasi Kepemilikan) menemukan saham-saham yang paling banyak dibeli oleh dana. Ini adalah hasil dari model kuantitatif multi-faktor yang canggih yang mengidentifikasi perusahaan dengan tingkat akumulasi institusional tertinggi. Model penilaian menggunakan kombinasi dari total peningkatan pemilik yang diungkapkan, perubahan dalam alokasi portofolio pada pemilik tersebut, dan metrik lainnya. Angka berkisar dari 0 hingga 100, dengan angka yang lebih tinggi menunjukkan tingkat akumulasi yang lebih tinggi dibandingkan dengan perusahaan sejenisnya, dan 50 adalah rata-ratanya.
Frekuensi Pembaruan: Setiap Hari
Lihat Ownership Explorer, yang menyediakan daftar perusahaan dengan peringkat tertinggi.
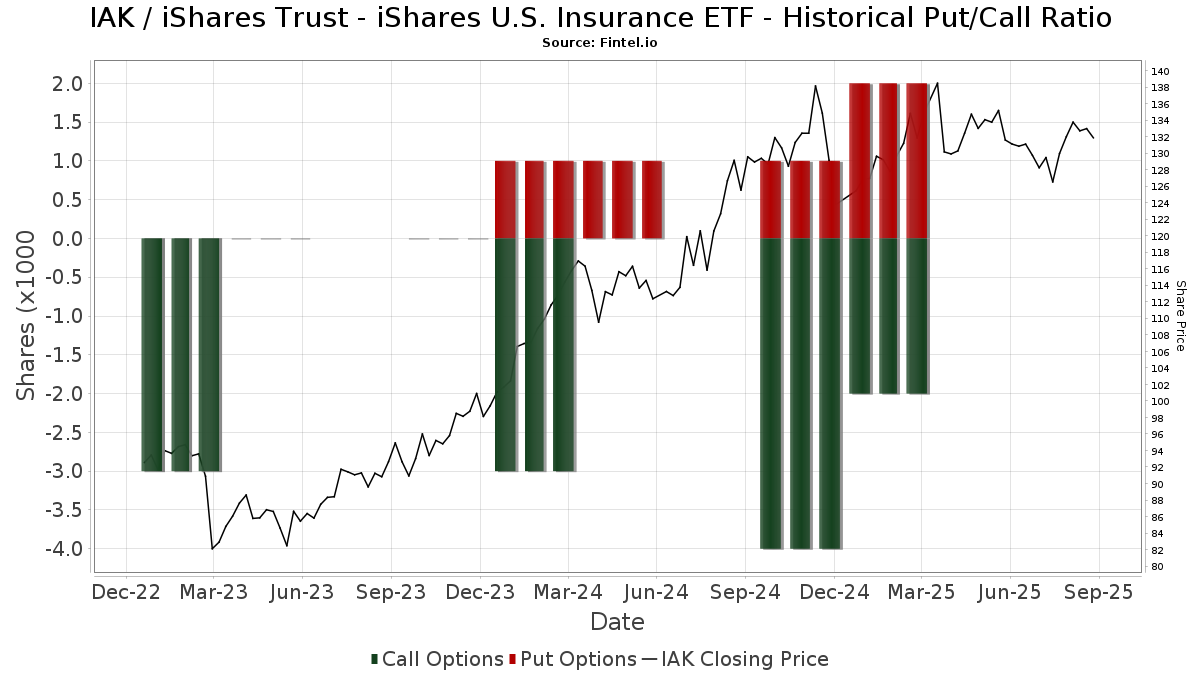
Rasio Put/Call Institusional
Selain melaporkan isu ekuitas dan utang standar, institusi dengan aset di bawah manajemen lebih dari 100 juta dolar AS juga harus mengungkapkan kepemilikan opsi put dan call mereka. Karena opsi put umumnya menunjukkan sentimen negatif, dan opsi call menunjukkan sentimen positif, kita dapat mengetahui sentimen institusional secara keseluruhan dengan memplot rasio put terhadap call. Grafik di sebelah kanan memplot rasio put/call historis untuk instrumen ini.
Menggunakan Rasio Put/Call sebagai indikator sentimen investor mengatasi salah satu kekurangan utama dari penggunaan total kepemilikan institusional, yaitu sejumlah besar aset yang dikelola diinvestasikan secara pasif untuk melacak indeks. Dana yang dikelola secara pasif biasanya tidak membeli opsi, sehingga indikator rasio put/call lebih akurat dalam melacak sentimen dana yang dikelola secara aktif.
Pengajuan 13F dan NPORT
Detail pada pengajuan 13F tersedia gratis. Detail pada pengajuan NP memerlukan keanggotaan premium. Baris berwarna hijau menunjukkan posisi baru. Baris berwarna merah menunjukkan posisi yang sudah ditutup. Klik tautan ini ikon untuk melihat riwayat transaksi selengkapnya.
Tingkatkan
untuk membuka data premium dan mengekspor ke Excel ![]() .
.
| Tanggal File | Sumber | Investor | Ketik | Presyo ng Avg (Silangan) |
Saham | Δ Saham (%) |
Dilaporkan Nilai ($1000) |
Nilai Δ (%) |
Alokasi Port (%) |
|
|---|---|---|---|---|---|---|---|---|---|---|
| 2025-08-18 | 13F | Geneos Wealth Management Inc. | 9,829 | -54.25 | 1,322 | -55.37 | ||||
| 2025-08-14 | 13F | Chicago Wealth Management, Inc. | 14,345 | -52.83 | 1,929 | -53.99 | ||||
| 2025-08-08 | 13F | SG Americas Securities, LLC | 1,881 | 0 | ||||||
| 2025-07-22 | 13F | Miracle Mile Advisors, LLC | 218,926 | 94.11 | 29,437 | 89.38 | ||||
| 2025-07-22 | 13F | Bank Hapoalim Bm | 3,260 | 1.56 | 0 | |||||
| 2025-08-14 | 13F | Tudor Financial Inc. | 23,759 | -2.89 | 3,195 | -5.25 | ||||
| 2025-08-14 | 13F | GWM Advisors LLC | 26,783 | 9.08 | 3,601 | 6.44 | ||||
| 2025-05-07 | 13F | LPL Financial LLC | Call | 0 | -100.00 | 0 | -100.00 | |||
| 2025-07-14 | 13F | Sowell Financial Services LLC | 1,762 | -18.58 | 237 | -20.81 | ||||
| 2025-08-14 | 13F | Wells Fargo & Company/mn | 227,411 | -12.35 | 30,578 | -14.48 | ||||
| 2025-08-11 | 13F | Y.D. More Investments Ltd | 630 | 0.00 | 85 | -2.33 | ||||
| 2025-08-11 | 13F | Ironsides Asset Advisors, LLC | 0 | -100.00 | 0 | |||||
| 2025-08-26 | NP | LCR - Leuthold Core ETF | 6,805 | 2.62 | 915 | 0.22 | ||||
| 2025-08-04 | 13F | Arkadios Wealth Advisors | 4,179 | 562 | ||||||
| 2025-08-14 | 13F | Sunbelt Securities, Inc. | 0 | -100.00 | 0 | |||||
| 2025-08-12 | 13F | Steward Partners Investment Advisory, Llc | 5,615 | 28.64 | 755 | 25.46 | ||||
| 2025-08-04 | 13F | IFG Advisory, LLC | 5,596 | -3.63 | 752 | -6.00 | ||||
| 2025-08-11 | 13F | Private Advisor Group, LLC | 4,461 | -83.01 | 600 | -83.44 | ||||
| 2025-07-22 | 13F | DAVENPORT & Co LLC | 4,615 | 12.84 | 621 | 10.12 | ||||
| 2025-08-14 | 13F | Stifel Financial Corp | 143,014 | 16.51 | 19,231 | 13.68 | ||||
| 2025-08-08 | 13F | Tortoise Investment Management, LLC | 314 | 0.00 | 42 | -2.33 | ||||
| 2025-08-13 | 13F | Russell Investments Group, Ltd. | 889 | 0.00 | 120 | -2.46 | ||||
| 2025-08-06 | 13F | Moors & Cabot, Inc. | 0 | -100.00 | 0 | |||||
| 2025-08-08 | 13F | L & S Advisors Inc | 2,045 | -0.63 | 275 | -3.18 | ||||
| 2025-08-12 | 13F | Retirement Planning Co of New England, Inc. | 4,303 | -0.76 | 579 | -3.18 | ||||
| 2025-08-13 | 13F | AMJ Financial Wealth Management | 0 | -100.00 | 0 | |||||
| 2025-08-08 | 13F | Woodley Farra Manion Portfolio Management Inc | 1,911 | 4.65 | 257 | 1.99 | ||||
| 2025-07-25 | 13F | Muirfield Wealth Advisors Llc | 4,376 | -8.28 | 588 | -10.50 | ||||
| 2025-08-14 | 13F | Goldman Sachs Group Inc | 33,847 | 20.77 | 4,551 | 17.84 | ||||
| 2025-07-11 | 13F | Diversified Trust Co | 0 | -100.00 | 0 | |||||
| 2025-08-14 | 13F | Mariner, LLC | 22,362 | 3.39 | 3,007 | 0.87 | ||||
| 2025-07-25 | 13F | Prostatis Group LLC | 0 | -100.00 | 0 | |||||
| 2025-07-10 | 13F | Exchange Traded Concepts, Llc | 379 | 51 | ||||||
| 2025-05-15 | 13F | Baird Financial Group, Inc. | 0 | -100.00 | 0 | |||||
| 2025-07-30 | 13F | WESPAC Advisors SoCal, LLC | 89,592 | 35.94 | 12,047 | 32.64 | ||||
| 2025-08-05 | 13F | Bank Of Montreal /can/ | 667 | 1.99 | 90 | -1.11 | ||||
| 2025-07-23 | 13F | WESPAC Advisors, LLC | 1,658 | 223 | ||||||
| 2025-08-14 | 13F | CIBC World Markets Inc. | 11,755 | 1.86 | 1,581 | -0.63 | ||||
| 2025-07-31 | 13F | Cambridge Investment Research Advisors, Inc. | 23,175 | 5.90 | 3 | 0.00 | ||||
| 2025-07-31 | 13F/A | Interchange Capital Partners, LLC | 2,150 | -1.38 | 289 | -2.36 | ||||
| 2025-07-16 | 13F | Minichmacgregor Wealth Management, Llc | 69,142 | 26.20 | 9,297 | 23.13 | ||||
| 2025-07-08 | 13F | Zrc Wealth Management, Llc | 154 | 48.08 | 21 | 42.86 | ||||
| 2025-08-18 | 13F | Hollencrest Capital Management | 0 | -100.00 | 0 | |||||
| 2025-08-12 | 13F | Global Retirement Partners, LLC | 212 | -8.23 | 29 | -3.45 | ||||
| 2025-07-10 | 13F | Capital Advisory Group Advisory Services, LLC | 26,406 | 0.98 | 3,551 | -1.47 | ||||
| 2025-08-18 | NP | A3 Alternative Credit Fund | 0 | -100.00 | 0 | -100.00 | ||||
| 2025-04-23 | 13F | Saxony Capital Management, LLC | 0 | -100.00 | 0 | -100.00 | ||||
| 2025-05-08 | 13F | Essential Planning, LLC. | 0 | -100.00 | 0 | |||||
| 2025-08-19 | 13F | National Asset Management, Inc. | 1,652 | 222 | ||||||
| 2025-05-07 | 13F | Spectrum Wealth Counsel, LLC | 71,539 | 20.78 | 9,859 | 31.60 | ||||
| 2025-07-28 | 13F | Harbour Investments, Inc. | 0 | -100.00 | 0 | |||||
| 2025-08-19 | 13F | Delos Wealth Advisors, LLC | 6,999 | -9.10 | 941 | -11.31 | ||||
| 2025-07-17 | 13F | Park Place Capital Corp | 0 | -100.00 | 0 | |||||
| 2025-07-17 | 13F | Janney Montgomery Scott LLC | 22,049 | 60.07 | 3 | 100.00 | ||||
| 2025-08-08 | 13F | WASHINGTON TRUST Co | 0 | -100.00 | 0 | |||||
| 2025-07-15 | 13F | Well Done, LLC | 41,990 | 11.30 | 5,646 | 18.32 | ||||
| 2025-08-14 | 13F | Federation des caisses Desjardins du Quebec | 48,550 | 1.05 | 6,528 | -1.39 | ||||
| 2025-08-06 | 13F | AE Wealth Management LLC | 217 | 0.00 | 29 | 0.00 | ||||
| 2025-07-31 | 13F | Wealthfront Advisers Llc | 1,754 | 7.74 | 236 | 4.91 | ||||
| 2025-08-12 | 13F | Councilmark Asset Management, LLC | 1,625 | 0.00 | 218 | -2.24 | ||||
| 2025-07-15 | 13F | Financial Management Professionals, Inc. | 7,674 | 1,032 | ||||||
| 2025-07-21 | 13F | Ameritas Advisory Services, LLC | 306 | 41 | ||||||
| 2025-08-11 | 13F | Tidemark, LLC | 91 | 0.00 | 12 | 0.00 | ||||
| 2025-08-14 | 13F | Ieq Capital, Llc | 2,000 | 0.00 | 269 | -2.55 | ||||
| 2025-08-19 | 13F | Advisory Services Network, LLC | 106,596 | 8.94 | 13,588 | 0.76 | ||||
| 2025-08-07 | 13F | PFG Advisors | 0 | -100.00 | 0 | |||||
| 2025-07-24 | 13F | Us Bancorp \de\ | 4,227 | -3.43 | 568 | -5.80 | ||||
| 2025-08-07 | 13F | Efficient Advisors, LLC | 4,504 | 606 | ||||||
| 2025-08-14 | 13F | CoreCap Advisors, LLC | 4,185 | 563 | ||||||
| 2025-08-07 | 13F | Allworth Financial LP | 8,069 | -14.71 | 1,085 | -12.43 | ||||
| 2025-08-06 | 13F | Commonwealth Equity Services, Llc | 9,246 | -86.59 | 1 | -88.89 | ||||
| 2025-08-12 | 13F | Proequities, Inc. | 0 | 0 | ||||||
| 2025-08-14 | 13F | Hilltop Holdings Inc. | 1,583 | -2.82 | 213 | -5.36 | ||||
| 2025-08-01 | 13F | Advisory Alpha, LLC | 1,491 | 1.22 | 201 | -0.99 | ||||
| 2025-08-08 | 13F | Fortis Group Advisors, LLC | 5,962 | -39.14 | 760 | -43.78 | ||||
| 2025-08-13 | 13F | Leuthold Group, Llc | 7,308 | 2.65 | 983 | 0.10 | ||||
| 2025-08-05 | 13F | Hills Bank & Trust Co | 13,694 | -2.53 | 1,841 | -4.91 | ||||
| 2025-08-11 | 13F | Outlook Wealth Advisors, LLC | 11,679 | 1,570 | ||||||
| 2025-08-06 | 13F | Legacy Wealth Managment, LLC/ID | 27 | 0.00 | 4 | 0.00 | ||||
| 2025-05-12 | 13F | Owen LaRue, LLC | 0 | -100.00 | 0 | |||||
| 2025-05-15 | 13F | Syon Capital Llc | 0 | -100.00 | 0 | |||||
| 2025-08-14 | 13F | Bramshill Investments, LLC | 7,500 | 1,008 | ||||||
| 2025-07-24 | 13F | Blair William & Co/il | 177 | 704.55 | 24 | 666.67 | ||||
| 2025-07-25 | 13F | Atria Wealth Solutions, Inc. | 0 | -100.00 | 0 | |||||
| 2025-07-29 | 13F | Stephens Inc /ar/ | 3,385 | 0.21 | 455 | -2.15 | ||||
| 2025-08-06 | 13F | Founders Financial Securities Llc | 36,444 | 0.32 | 4,900 | 3.16 | ||||
| 2025-08-29 | 13F | Centaurus Financial, Inc. | 0 | -100.00 | 0 | |||||
| 2025-07-23 | 13F | Kingswood Wealth Advisors, Llc | 4,988 | 3.10 | 671 | 0.60 | ||||
| 2025-08-12 | 13F | Founders Financial Alliance, LLC | 0 | -100.00 | 0 | |||||
| 2025-08-14 | 13F | Fmr Llc | 1,905 | 9.04 | 256 | 6.67 | ||||
| 2025-08-18 | 13F | Castleark Management Llc | 54,070 | 0.00 | 7,270 | -2.43 | ||||
| 2025-09-04 | 13F/A | Advisor Group Holdings, Inc. | 129,238 | 58.62 | 17,377 | 54.76 | ||||
| 2025-08-14 | 13F | Glenview Trust Co | 2,350 | 0.00 | 316 | -2.48 | ||||
| 2025-07-25 | 13F | Genesee Capital Advisors, LLC | 10,568 | 65.64 | 1,421 | 61.66 | ||||
| 2025-08-25 | 13F | Fulcrum Equity Management | 6,351 | 854 | ||||||
| 2025-08-08 | 13F | Beacon Harbor Wealth Advisors, Inc. | 0 | -100.00 | 0 | |||||
| 2025-08-06 | 13F | Prospera Financial Services Inc | 71,910 | 7.33 | 9,669 | 4.71 | ||||
| 2025-08-14 | 13F | Citadel Advisors Llc | 3,716 | -83.46 | 500 | -83.88 | ||||
| 2025-08-13 | 13F | VestGen Advisors, LLC | 15,648 | 13.59 | 2,104 | 10.85 | ||||
| 2025-08-14 | 13F | Mml Investors Services, Llc | 218,944 | 48.78 | 29 | 45.00 | ||||
| 2025-08-13 | 13F | Summit Financial, LLC | 3,444 | -34.99 | 463 | -36.58 | ||||
| 2025-08-14 | 13F | UBS Group AG | 70,845 | -2.61 | 9,526 | -4.98 | ||||
| 2025-07-30 | 13F | TFB Advisors LLC | 2,720 | -15.32 | 366 | -17.42 | ||||
| 2025-08-14 | 13F | Royal Bank Of Canada | 132,205 | 11.62 | 17,776 | 8.90 | ||||
| 2025-08-01 | 13F | Redwood Park Advisors LLC | 349 | 0.29 | 47 | -2.13 | ||||
| 2025-08-07 | 13F | Kestra Private Wealth Services, Llc | 9,350 | 0.14 | 1,257 | -2.26 | ||||
| 2025-08-12 | 13F | Bokf, Na | 174 | 0.00 | 23 | 0.00 | ||||
| 2025-08-14 | 13F | KKM Financial LLC | 9,061 | 0.00 | 1,218 | -2.40 | ||||
| 2025-08-15 | 13F | Equitable Holdings, Inc. | 15,477 | -3.10 | 2,081 | -5.45 | ||||
| 2025-07-29 | 13F | Stratos Wealth Partners, LTD. | 0 | -100.00 | 0 | |||||
| 2025-08-06 | 13F | SP Asset Management LLC | 19,505 | 0.10 | 2,623 | -2.35 | ||||
| 2025-07-16 | 13F | Cadent Capital Advisors, LLC | 38,582 | 0.63 | 5,188 | -1.82 | ||||
| 2025-07-28 | 13F | RFG Advisory, LLC | 26,354 | 25.59 | 3,544 | 22.55 | ||||
| 2025-07-24 | 13F | IFP Advisors, Inc | 22 | -87.43 | 3 | -87.50 | ||||
| 2025-08-06 | 13F | First Horizon Advisors, Inc. | 2,044 | -32.18 | 275 | -33.98 | ||||
| 2025-07-16 | 13F | Perigon Wealth Management, LLC | 8,975 | 88.71 | 1,207 | 84.12 | ||||
| 2025-08-04 | 13F | Creative Financial Designs Inc /adv | 100 | 0.00 | 13 | 0.00 | ||||
| 2025-07-08 | 13F | Nbc Securities, Inc. | 965 | 0.00 | 0 | |||||
| 2025-08-14 | 13F | Raymond James Financial Inc | 94,246 | 64.02 | 12,672 | 60.04 | ||||
| 2025-07-23 | 13F | High Note Wealth, LLC | 15 | 0.00 | 2 | 0.00 | ||||
| 2025-08-14 | 13F | Bank Of America Corp /de/ | 123,116 | 6.67 | 16,554 | 4.08 | ||||
| 2025-08-01 | 13F | Envestnet Asset Management Inc | 3,038 | 37.40 | 408 | 34.21 | ||||
| 2025-08-01 | 13F/A | GGM Financials LLC | 63,563 | 3.25 | 8,547 | 0.73 | ||||
| 2025-08-14 | 13F | Bnp Paribas Arbitrage, Sa | 0 | -100.00 | 0 | |||||
| 2025-07-09 | 13F | Bulwark Capital Corp | 1,185 | 159 | ||||||
| 2025-08-01 | 13F | Ashton Thomas Private Wealth, LLC | 0 | -100.00 | 0 | |||||
| 2025-08-14 | 13F | Cardiff Park Advisors, Llc | 3,500 | 0.00 | 471 | -2.49 | ||||
| 2025-05-15 | 13F | Two Sigma Securities, Llc | 0 | -100.00 | 0 | |||||
| 2025-07-28 | 13F | Duncker Streett & Co Inc | 53 | 0.00 | 7 | 0.00 | ||||
| 2025-08-13 | 13F | Jones Financial Companies Lllp | 7,027 | 34.95 | 934 | 31.59 | ||||
| 2025-08-08 | 13F | Larson Financial Group LLC | 1,976 | 6.98 | 266 | 4.33 | ||||
| 2025-08-12 | 13F | J.w. Cole Advisors, Inc. | 12,816 | 1,723 | ||||||
| 2025-07-21 | 13F | Jmac Enterprises Llc | 31,547 | 4,242 | ||||||
| 2025-08-14 | 13F | Colony Group, LLC | 31,776 | 4,273 | ||||||
| 2025-07-29 | 13F | Cottonwood Capital Advisors, Llc | 23,537 | 1.00 | 3,165 | -1.46 | ||||
| 2025-07-25 | 13F | Concurrent Investment Advisors, LLC | 1,704 | 9.72 | 229 | 7.01 | ||||
| 2025-04-30 | 13F | Silverlake Wealth Management Llc | 0 | -100.00 | 0 | |||||
| 2025-07-29 | 13F | Private Trust Co Na | 0 | -100.00 | 0 | |||||
| 2025-08-12 | 13F | LPL Financial LLC | 185,155 | 15.86 | 24,896 | 13.04 | ||||
| 2025-07-10 | 13F | Ferguson Wellman Capital Management, Inc | 2,360 | 0.00 | 317 | -2.46 | ||||
| 2025-08-12 | 13F | Jpmorgan Chase & Co | 50 | -31.51 | 7 | -40.00 | ||||
| 2025-08-04 | 13F | Atria Investments Llc | 7,827 | -5.12 | 1,052 | -7.39 | ||||
| 2025-08-14 | 13F | Wiley Bros.-aintree Capital, Llc | 6,608 | -7.06 | 889 | -8.26 | ||||
| 2025-07-21 | 13F | Jackson Wealth Management, LLC | 0 | -100.00 | 0 | |||||
| 2025-08-08 | 13F | Cetera Investment Advisers | 6,050 | -18.50 | 813 | -20.53 | ||||
| 2025-05-19 | 13F | Heck Capital Advisors, LLC | 0 | -100.00 | 0 | -100.00 | ||||
| 2025-08-13 | 13F | Flow Traders U.s. Llc | 4,991 | 1 | ||||||
| 2025-08-06 | 13F | Csenge Advisory Group | 2,784 | 0.00 | 379 | 5.28 | ||||
| 2025-08-08 | 13F | Gts Securities Llc | 25,040 | -11.75 | 3,367 | -13.91 | ||||
| 2025-05-15 | 13F | Hrt Financial Lp | 0 | -100.00 | 0 | |||||
| 2025-08-13 | 13F | Baker Avenue Asset Management, LP | 1,633 | 220 | ||||||
| 2025-08-18 | 13F/A | National Bank Of Canada /fi/ | 161 | 7.33 | 22 | 5.00 | ||||
| 2025-07-22 | 13F | Belpointe Asset Management LLC | 5,041 | 7.85 | 678 | 5.12 | ||||
| 2025-07-23 | 13F | Dohj, Llc | 2,140 | 279 | ||||||
| 2025-08-11 | 13F | HighTower Advisors, LLC | 9,065 | 185.87 | 1,219 | 179.36 | ||||
| 2025-08-08 | 13F | Pnc Financial Services Group, Inc. | 80 | 11 | ||||||
| 2025-08-01 | 13F | Chilton Capital Management Llc | 168 | 0.00 | 23 | -4.35 | ||||
| 2025-08-13 | 13F | Marshall Wace, Llp | 0 | -100.00 | 0 | |||||
| 2025-08-12 | 13F | CIBC Private Wealth Group, LLC | 0 | 0 | ||||||
| 2025-08-13 | 13F | Northwestern Mutual Wealth Management Co | 865 | -9.04 | 116 | -11.45 | ||||
| 2025-07-14 | 13F | AdvisorNet Financial, Inc | 802 | -4.18 | 108 | -6.96 | ||||
| 2025-08-11 | 13F | Principal Securities, Inc. | 8 | -11.11 | 1 | 0.00 | ||||
| 2025-07-15 | 13F | Tepp RIA, LLC | 15,272 | -40.56 | 2,054 | -42.01 | ||||
| 2025-07-23 | 13F | Eagle Strategies LLC | 13,972 | 2.79 | 1,879 | 0.27 | ||||
| 2025-07-23 | 13F | Winthrop Advisory Group LLC | 3,722 | 7.82 | 500 | 5.26 | ||||
| 2025-08-08 | 13F | Avantax Advisory Services, Inc. | 18,067 | 6.45 | 2,429 | 3.89 | ||||
| 2025-07-11 | 13F | Farther Finance Advisors, LLC | 553 | 84.33 | 74 | 80.49 | ||||
| 2025-08-13 | 13F | Martin & Co Inc /tn/ | 27,079 | 0.31 | 3,641 | -2.15 | ||||
| 2025-07-07 | 13F | Nova Wealth Management, Inc. | 2,059 | -1.91 | 277 | -4.50 | ||||
| 2025-07-31 | 13F | Lee Danner & Bass Inc | 38,338 | 13.61 | 5,155 | 10.84 | ||||
| 2025-08-08 | 13F | Adapt Wealth Advisors, Llc | 64,165 | 3.32 | 8,628 | 0.81 | ||||
| 2025-07-10 | 13F | Focus Financial Network, Inc. | 1,854 | -36.44 | 249 | -38.06 | ||||
| 2025-08-19 | 13F | Newbridge Financial Services Group, Inc. | 149 | 20 | ||||||
| 2025-07-30 | 13F | Sonata Capital Group Inc | 3,800 | -5.00 | 1 | |||||
| 2025-08-08 | 13F | Capital Investment Advisory Services, LLC | 13 | 2 | ||||||
| 2025-08-14 | 13F | Susquehanna International Group, Llp | 14,854 | -11.30 | 1,997 | -13.44 | ||||
| 2025-07-24 | 13F | Game Plan Financial Advisors, LLC | 19,655 | 77.63 | 2,643 | 73.36 | ||||
| 2025-07-22 | 13F | Coastal Investment Advisors, Inc. | 285 | 38 | ||||||
| 2025-08-08 | 13F | Creative Planning | 1,933 | 21.50 | 260 | 18.26 | ||||
| 2025-05-13 | 13F | Aptus Capital Advisors, LLC | 0 | -100.00 | 0 | |||||
| 2025-08-06 | 13F | Legacy Investment Solutions, LLC | 27 | 0.00 | 4 | 0.00 | ||||
| 2025-07-25 | 13F | SPC Financial, Inc. | 157,319 | -3.98 | 21,153 | -6.31 | ||||
| 2025-05-06 | 13F | WT Wealth Management | 4,445 | -83.11 | 613 | -81.61 | ||||
| 2025-07-16 | 13F | Legend Financial Advisors, Inc. | 50,879 | -1.44 | 6,841 | -3.84 | ||||
| 2025-07-29 | 13F | Harbor Asset Planning, Inc. | 731 | 98 | ||||||
| 2025-08-12 | 13F | Sfmg, Llc | 4,705 | 0.00 | 633 | -2.47 | ||||
| 2025-08-13 | 13F | GeoWealth Management, LLC | 3,909 | -69.12 | 526 | -69.90 | ||||
| 2025-08-14 | 13F | Jane Street Group, Llc | 15,224 | -36.32 | 2,047 | -37.86 | ||||
| 2025-07-30 | 13F | Strategic Blueprint, LLC | 3,138 | 422 | ||||||
| 2025-08-14 | 13F | Qube Research & Technologies Ltd | 128 | -90.74 | 17 | -91.05 | ||||
| 2025-08-14 | 13F | Two Sigma Investments, Lp | 85,600 | 11,510 | ||||||
| 2025-07-18 | 13F | Truist Financial Corp | 1,933 | 260 | ||||||
| 2025-07-30 | 13F | Fiduciary Planning LLC | 52,718 | -7.22 | 7,088 | -9.48 | ||||
| 2025-08-15 | 13F | Morgan Stanley | 309,794 | -12.11 | 41,655 | -14.24 | ||||
| 2025-07-16 | 13F | ORG Partners LLC | 149 | 73.26 | 20 | 81.82 | ||||
| 2025-08-07 | 13F | Montag A & Associates Inc | 0 | -100.00 | 0 | |||||
| 2025-08-14 | 13F | Redwood Financial Network Corp | 1,657 | 223 | ||||||
| 2025-07-31 | 13F | Oppenheimer & Co Inc | 0 | -100.00 | 0 | |||||
| 2025-08-14 | 13F | Old Mission Capital Llc | 2,847 | -17.05 | 383 | -19.07 | ||||
| 2025-08-07 | 13F | Apeiron RIA LLC | 5,446 | -1.02 | 732 | -3.43 | ||||
| 2025-08-14 | 13F | Comerica Bank | 257 | -89.69 | 35 | -90.09 | ||||
| 2025-08-06 | 13F | Stonebridge Financial Planning Group, LLC | 17,191 | -0.57 | 2,312 | -2.98 | ||||
| 2025-08-15 | 13F | Tower Research Capital LLC (TRC) | 9,654 | 53.46 | 1,298 | 49.88 | ||||
| 2025-08-01 | 13F | Belvedere Trading LLC | Call | 0 | -100.00 | 0 | ||||
| 2025-05-15 | 13F | Wolverine Trading, Llc | 0 | -100.00 | 0 | |||||
| 2025-08-04 | 13F | Spire Wealth Management | 2,330 | 12.24 | 313 | 9.44 | ||||
| 2025-05-15 | 13F | D. E. Shaw & Co., Inc. | 0 | -100.00 | 0 | |||||
| 2025-08-01 | 13F | Belvedere Trading LLC | Put | 0 | -100.00 | 0 | ||||
| 2025-07-28 | 13F | Copia Wealth Management | 1,403 | 55.20 | 189 | 51.61 | ||||
| 2025-08-12 | 13F | AlphaCore Capital LLC | 3,158 | 0.00 | 425 | -2.53 | ||||
| 2025-08-14 | 13F | Great Valley Advisor Group, Inc. | 12,398 | 1.24 | 1,667 | -1.19 | ||||
| 2025-07-17 | 13F | Smith Anglin Financial, LLC | 8,862 | -7.16 | 1,192 | -9.43 | ||||
| 2025-08-01 | 13F | Belvedere Trading LLC | 0 | -100.00 | 0 | |||||
| 2025-07-10 | 13F | Oliver Lagore Vanvalin Investment Group | 20 | 3 | ||||||
| 2025-07-17 | 13F | Lee Johnson Capital Management, Llc | 9,779 | 1,315 | ||||||
| 2025-07-23 | 13F | Foresight Capital Management Advisors, Inc. | 2,232 | 300 | ||||||
| 2025-07-22 | 13F | Elevate Capital Advisors, LLC | 5,125 | 689 |
Other Listings
| MX:IAK |