Mga Batayang Estadistika
| Pemilik Institusional | 140 total, 140 long only, 0 short only, 0 long/short - change of 5.22% MRQ |
| Alokasi Portofolio Rata-rata | 0.7676 % - change of 16.33% MRQ |
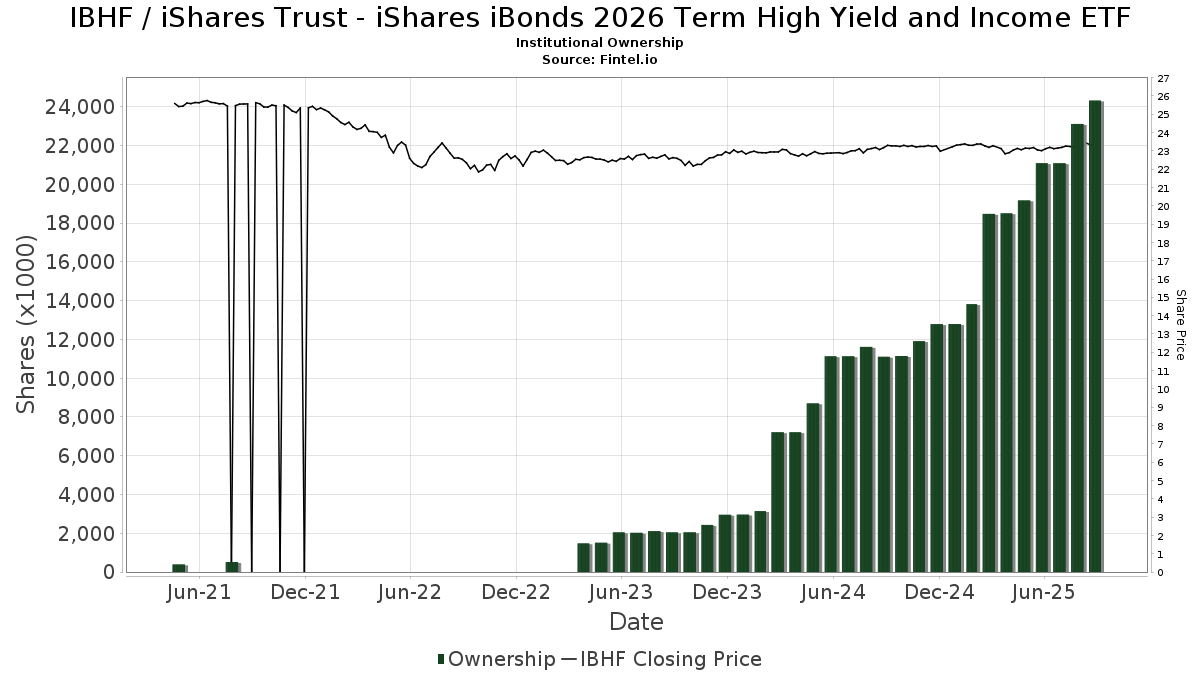
| Saham Institusional (Jangka Panjang) | 24,329,899 (ex 13D/G) - change of 3.23MM shares 15.31% MRQ |
| Nilai Institusional (Jangka Panjang) | $ 530,334 USD ($1000) |
Kepemilikan Institusional dan Pemegang Saham
iShares Trust - iShares iBonds 2026 Term High Yield and Income ETF (US:IBHF) memiliki 140 pemilik institusional dan pemegang saham yang telah mengajukan formulir 13D/G atau 13F kepada Komisi Bursa Efek (Securities Exchange Commission/SEC). Lembaga-lembaga ini memegang total 24,329,899 saham. Pemegang saham terbesar meliputi Bank Of America Corp /de/, Morgan Stanley, Sterling Financial Group, Inc., Cambridge Investment Research Advisors, Inc., Private Advisor Group, LLC, Wells Fargo & Company/mn, Lbmc Investment Advisors, Llc, Northwestern Mutual Wealth Management Co, Straightline Group Llc, and LPL Financial LLC .
Struktur kepemilikan institusional iShares Trust - iShares iBonds 2026 Term High Yield and Income ETF (BATS:IBHF) menunjukkan posisi terkini di perusahaan oleh institusi dan dana, serta perubahan terbaru dalam ukuran posisi. Pemegang saham utama dapat mencakup investor individu, reksa dana, dana lindung nilai, atau institusi. Jadwal 13D menunjukkan bahwa investor memegang (atau pernah memegang) lebih dari 5% saham perusahaan dan bermaksud (atau pernah bermaksud) untuk secara aktif mengejar perubahan strategi bisnis. Jadwal 13G menunjukkan investasi pasif lebih dari 5%.
The share price as of September 5, 2025 is 23.28 / share. Previously, on September 6, 2024, the share price was 23.14 / share. This represents an increase of 0.61% over that period.
Skor Sentimen Dana
Skor Sentimen Dana (sebelumnya dikenal sebagai Skor Akumulasi Kepemilikan) menemukan saham-saham yang paling banyak dibeli oleh dana. Ini adalah hasil dari model kuantitatif multi-faktor yang canggih yang mengidentifikasi perusahaan dengan tingkat akumulasi institusional tertinggi. Model penilaian menggunakan kombinasi dari total peningkatan pemilik yang diungkapkan, perubahan dalam alokasi portofolio pada pemilik tersebut, dan metrik lainnya. Angka berkisar dari 0 hingga 100, dengan angka yang lebih tinggi menunjukkan tingkat akumulasi yang lebih tinggi dibandingkan dengan perusahaan sejenisnya, dan 50 adalah rata-ratanya.
Frekuensi Pembaruan: Setiap Hari
Lihat Ownership Explorer, yang menyediakan daftar perusahaan dengan peringkat tertinggi.
Rasio Put/Call Institusional
Selain melaporkan isu ekuitas dan utang standar, institusi dengan aset di bawah manajemen lebih dari 100 juta dolar AS juga harus mengungkapkan kepemilikan opsi put dan call mereka. Karena opsi put umumnya menunjukkan sentimen negatif, dan opsi call menunjukkan sentimen positif, kita dapat mengetahui sentimen institusional secara keseluruhan dengan memplot rasio put terhadap call. Grafik di sebelah kanan memplot rasio put/call historis untuk instrumen ini.
Menggunakan Rasio Put/Call sebagai indikator sentimen investor mengatasi salah satu kekurangan utama dari penggunaan total kepemilikan institusional, yaitu sejumlah besar aset yang dikelola diinvestasikan secara pasif untuk melacak indeks. Dana yang dikelola secara pasif biasanya tidak membeli opsi, sehingga indikator rasio put/call lebih akurat dalam melacak sentimen dana yang dikelola secara aktif.

Pengajuan 13F dan NPORT
Detail pada pengajuan 13F tersedia gratis. Detail pada pengajuan NP memerlukan keanggotaan premium. Baris berwarna hijau menunjukkan posisi baru. Baris berwarna merah menunjukkan posisi yang sudah ditutup. Klik tautan ini ikon untuk melihat riwayat transaksi selengkapnya.
Tingkatkan
untuk membuka data premium dan mengekspor ke Excel ![]() .
.
| Tanggal File | Sumber | Investor | Ketik | Presyo ng Avg (Silangan) |
Saham | Δ Saham (%) |
Dilaporkan Nilai ($1000) |
Nilai Δ (%) |
Alokasi Port (%) |
|
|---|---|---|---|---|---|---|---|---|---|---|
| 2025-07-29 | 13F | Stratos Wealth Partners, LTD. | 138,721 | 66.83 | 3,223 | 66.94 | ||||
| 2025-08-06 | 13F | Savant Capital, LLC | 10,156 | 0.00 | 236 | 0.00 | ||||
| 2025-07-08 | 13F | FF Advisors,LLC | 177,871 | 3.56 | 4,132 | 4.32 | ||||
| 2025-08-14 | 13F | Goldman Sachs Group Inc | 0 | -100.00 | 0 | -100.00 | ||||
| 2025-05-02 | 13F | Whittier Trust Co | 0 | -100.00 | 0 | |||||
| 2025-08-08 | 13F | Wrapmanager Inc | 49,204 | 1.68 | 1,143 | 1.78 | ||||
| 2025-07-14 | 13F | Occidental Asset Management, LLC | 11,540 | 0.00 | 268 | 0.37 | ||||
| 2025-04-01 | 13F | Massmutual Trust Co Fsb/adv | 0 | -100.00 | 0 | |||||
| 2025-08-11 | 13F | Arrow Financial Corp | 724,261 | 116.28 | 16,825 | 116.39 | ||||
| 2025-08-08 | 13F | Marble Harbor Investment Counsel, LLC | 18,600 | -9.72 | 432 | -9.62 | ||||
| 2025-07-15 | 13F | North Star Investment Management Corp. | 2,000 | 46 | ||||||
| 2025-08-15 | 13F | High Falls Advisors, Inc | 12,551 | 16.49 | 292 | 16.40 | ||||
| 2025-08-08 | 13F | Creative Planning | 12,580 | 292 | ||||||
| 2025-07-28 | 13F | Harbour Investments, Inc. | 869 | 62.13 | 20 | 66.67 | ||||
| 2025-08-06 | 13F | Commonwealth Equity Services, Llc | 143,670 | 5.82 | 3 | 0.00 | ||||
| 2025-08-13 | 13F | Lido Advisors, LLC | 177,875 | -7.24 | 4,132 | -7.19 | ||||
| 2025-08-15 | 13F | Howland Capital Management Llc | 13,740 | 0.00 | 319 | 0.00 | ||||
| 2025-08-05 | 13F | GPS Wealth Strategies Group, LLC | 15 | 0 | ||||||
| 2025-08-11 | 13F | Aptus Capital Advisors, LLC | 1,309 | 0.46 | 30 | 0.00 | ||||
| 2025-08-01 | 13F | Ashton Thomas Private Wealth, LLC | 0 | -100.00 | 0 | |||||
| 2025-08-14 | 13F | Eight 31 Financial Llc | 79,140 | 0.62 | 1,838 | 0.66 | ||||
| 2025-08-14 | 13F | Ruggaard & Associates LLC | 574,522 | -2.16 | 13,346 | -2.12 | ||||
| 2025-08-04 | 13F | Cottage Street Advisors LLC | 69,930 | 9.74 | 1,624 | 9.80 | ||||
| 2025-08-14 | 13F | GWM Advisors LLC | 202,776 | 0.66 | 4,710 | 0.71 | ||||
| 2025-08-14 | 13F | Headinvest, Llc | 33,425 | -2.90 | 776 | -2.88 | ||||
| 2025-08-12 | 13F | Global Retirement Partners, LLC | 10,930 | 1.64 | 254 | 2.02 | ||||
| 2025-07-10 | 13F | Sterling Financial Group, Inc. | 1,210,761 | 28,126 | ||||||
| 2025-08-04 | 13F | Spire Wealth Management | 3,955 | -37.40 | 92 | -37.67 | ||||
| 2025-08-15 | 13F | Captrust Financial Advisors | 10,913 | 254 | ||||||
| 2025-08-11 | 13F | Principal Securities, Inc. | 5,822 | 39.82 | 135 | 40.63 | ||||
| 2025-08-12 | 13F | PSI Advisors, LLC | 0 | -100.00 | 0 | |||||
| 2025-08-11 | 13F | VSM Wealth Advisory, LLC | 384 | 0.00 | 9 | 0.00 | ||||
| 2025-08-08 | 13F | Thoroughbred Financial Services, Llc | 41,798 | -24.74 | 1 | -100.00 | ||||
| 2025-08-14 | 13F | Comerica Bank | 4,767 | -1.61 | 111 | -1.79 | ||||
| 2025-08-27 | 13F/A | Brinker Capital Investments, LLC | 80,035 | 2.27 | 1,859 | 2.31 | ||||
| 2025-05-14 | 13F | Susquehanna International Group, Llp | 0 | -100.00 | 0 | |||||
| 2025-07-30 | 13F | Strategic Blueprint, LLC | 49,319 | 460.44 | 1,146 | 461.27 | ||||
| 2025-08-13 | 13F | MONECO Advisors, LLC | 14,099 | 0.00 | 328 | 0.00 | ||||
| 2025-08-14 | 13F | Evergreen Capital Management Llc | 231,997 | 12.39 | 5,389 | 12.43 | ||||
| 2025-08-15 | 13F | Morgan Stanley | 1,525,335 | -25.01 | 35,434 | -24.98 | ||||
| 2025-08-06 | 13F | AE Wealth Management LLC | 33,020 | 1.60 | 767 | 1.72 | ||||
| 2025-08-14 | 13F | Sentinus, LLC | 26,056 | 0.03 | 605 | 0.17 | ||||
| 2025-07-23 | 13F | Madden Advisory Services, Inc. | 25,850 | 12.67 | 600 | 12.78 | ||||
| 2025-08-04 | 13F | Pensionmark Financial Group, Llc | 138,410 | -5.75 | 3,215 | -5.69 | ||||
| 2025-08-12 | 13F | Cowa, Llc | 685,592 | 25.98 | 15,912 | 25.92 | ||||
| 2025-05-14 | 13F | Van Hulzen Asset Management, LLC | 0 | -100.00 | 0 | -100.00 | ||||
| 2025-08-14 | 13F | UBS Group AG | 262,625 | 1.79 | 6,101 | 1.82 | ||||
| 2025-04-10 | 13F | Sugar Maple Asset Management, LLC | 0 | -100.00 | 0 | |||||
| 2025-07-25 | 13F | Commonwealth Financial Services, LLC | 100,262 | -17.58 | 2,329 | -17.53 | ||||
| 2025-08-08 | 13F | Avantax Advisory Services, Inc. | 202,734 | 44.27 | 4,710 | 44.32 | ||||
| 2025-07-16 | 13F | Littlejohn Financial Services, Inc. | 517,294 | 66.17 | 12,017 | 66.24 | ||||
| 2025-08-14 | 13F | Strategic Wealth Designers | 18 | 0 | ||||||
| 2025-08-14 | 13F | Mml Investors Services, Llc | 0 | -100.00 | 0 | |||||
| 2025-07-14 | 13F | GAMMA Investing LLC | 49,389 | -80.19 | 1,147 | -80.18 | ||||
| 2025-08-13 | 13F | Baltimore-Washington Financial Advisors, Inc. | 445,589 | -9.04 | 10,351 | -8.99 | ||||
| 2025-08-06 | 13F | Rialto Wealth Management, LLC | 67,198 | 12.33 | 1,561 | 12.38 | ||||
| 2025-08-11 | 13F | PFG Private Wealth Management, LLC | 0 | -100.00 | 0 | |||||
| 2025-07-25 | 13F | Cwm, Llc | 3,533 | -6.21 | 0 | |||||
| 2025-08-07 | 13F | Kestra Private Wealth Services, Llc | 144,299 | 10.97 | 3,352 | 11.03 | ||||
| 2025-08-13 | 13F | Beacon Pointe Advisors, LLC | 34,274 | -17.63 | 796 | -17.60 | ||||
| 2025-08-14 | 13F | Hrt Financial Lp | 0 | -100.00 | 0 | |||||
| 2025-05-07 | 13F | Vista Private Wealth Partners. LLC | 0 | -100.00 | 0 | |||||
| 2025-08-26 | 13F/A | Thrivent Financial For Lutherans | 0 | -100.00 | 0 | |||||
| 2025-08-11 | 13F | Summit Wealth Partners, LLC | 29,265 | -20.21 | 680 | -20.21 | ||||
| 2025-08-14 | 13F | Jane Street Group, Llc | 0 | -100.00 | 0 | |||||
| 2025-07-16 | 13F | Moisand Fitzgerald Tamayo, LLC | 1 | 0.00 | 0 | |||||
| 2025-07-17 | 13F | Johnson Bixby & Associates, LLC | 14,719 | 2.06 | 342 | 2.10 | ||||
| 2025-07-30 | 13F | Mid-American Wealth Advisory Group, Inc. | 598,347 | 36.55 | 13,900 | 36.61 | ||||
| 2025-07-17 | 13F | Baron Silver Stevens Financial Advisors, Llc | 10,944 | -46.70 | 254 | -46.64 | ||||
| 2025-08-12 | 13F | BlackRock, Inc. | 34,441 | 0.33 | 800 | 0.38 | ||||
| 2025-08-14 | 13F | Wells Fargo & Company/mn | 1,064,628 | 23.99 | 24,731 | 24.04 | ||||
| 2025-08-12 | 13F | Coldstream Capital Management Inc | 0 | -100.00 | 0 | |||||
| 2025-08-05 | 13F | Cherry Tree Wealth Management, LLC | 7,621 | 0.00 | 177 | 0.57 | ||||
| 2025-07-29 | 13F | Werba Rubin Papier Wealth Management | 46,638 | 0.00 | 1,083 | 0.09 | ||||
| 2025-07-29 | 13F | International Assets Investment Management, Llc | 55,710 | 14.50 | 1,294 | 14.61 | ||||
| 2025-07-30 | 13F | Avidian Wealth Solutions, LLC | 12,435 | 289 | ||||||
| 2025-08-12 | 13F | Bedel Financial Consulting, Inc. | 31,575 | 37.55 | 733 | 38.56 | ||||
| 2025-08-14 | 13F | Snowden Capital Advisors LLC | 29,377 | 0.00 | 682 | 0.00 | ||||
| 2025-07-09 | 13F | Krilogy Financial LLC | 72,641 | -2.66 | 1,687 | -2.60 | ||||
| 2025-07-29 | 13F | Straight Path Wealth Management | 99,793 | 12.11 | 2,318 | 12.20 | ||||
| 2025-08-14 | 13F | Integrated Wealth Concepts LLC | 316,269 | 8.25 | 7,347 | 8.28 | ||||
| 2025-08-07 | 13F | PFG Advisors | 69,235 | 1,608 | ||||||
| 2025-07-22 | 13F | Steele Capital Management, Inc. | 37,803 | 0.00 | 878 | 0.11 | ||||
| 2025-08-12 | 13F | Absolute Capital Management, LLC | 61,035 | -4.83 | 1,418 | -4.84 | ||||
| 2025-07-24 | 13F | IFP Advisors, Inc | 54,911 | -20.54 | 1,276 | -20.51 | ||||
| 2025-08-14 | 13F | Colony Group, LLC | 12,832 | 0.00 | 298 | 0.34 | ||||
| 2025-07-23 | 13F | Ironwood Financial, llc | 66,160 | 0.00 | 1,536 | 0.00 | ||||
| 2025-08-12 | 13F | Cornerstone Wealth Management, LLC | 60,020 | 7.53 | 1,394 | 7.56 | ||||
| 2025-08-01 | 13F | Envestnet Asset Management Inc | 126,076 | 25.35 | 2,929 | 25.40 | ||||
| 2025-07-25 | 13F | M3 Advisory Group, LLC | 9,313 | 0.22 | 216 | 0.47 | ||||
| 2025-08-14 | 13F | Stifel Financial Corp | 15,309 | 30.89 | 356 | 31.00 | ||||
| 2025-08-07 | 13F | Nwam Llc | 31,990 | -12.40 | 743 | -12.28 | ||||
| 2025-07-30 | 13F | Phillips Financial Management, Llc | 25,436 | 0.00 | 591 | 0.00 | ||||
| 2025-07-31 | 13F | Keeler THomas Management LLC | 415,775 | 15.57 | 9,658 | 15.62 | ||||
| 2025-07-15 | 13F | MCF Advisors LLC | 29,845 | 41.77 | 693 | 42.01 | ||||
| 2025-07-29 | 13F | Private Trust Co Na | 2,345 | 9.07 | 54 | 10.20 | ||||
| 2025-08-14 | 13F | Mercer Global Advisors Inc /adv | 12,006 | 279 | ||||||
| 2025-08-12 | 13F | Tableaux Llc | 1,363 | 248 | ||||||
| 2025-08-11 | 13F | Private Advisor Group, LLC | 1,117,099 | 9.50 | 25,950 | 9.55 | ||||
| 2025-07-10 | 13F | Wealth Enhancement Advisory Services, Llc | 10,850 | 0.00 | 251 | 0.00 | ||||
| 2025-08-14 | 13F | Old Mission Capital Llc | 373,758 | 2,046.31 | 8,682 | 2,049.01 | ||||
| 2025-08-14 | 13F | Citadel Advisors Llc | 0 | -100.00 | 0 | |||||
| 2025-09-04 | 13F/A | Advisor Group Holdings, Inc. | 209,350 | 1.44 | 4,864 | 1.48 | ||||
| 2025-08-06 | 13F | Prospera Financial Services Inc | 9,067 | 211 | ||||||
| 2025-05-13 | 13F | Claudia M.p. Batlle, Crp (r) Llc | 0 | -100.00 | 0 | |||||
| 2025-08-06 | 13F | Summit Investment Advisors, Inc. | 304,244 | 4.38 | 7,043 | 4.84 | ||||
| 2025-08-14 | 13F | Bank Of America Corp /de/ | 2,146,582 | 2.46 | 49,865 | 2.50 | ||||
| 2025-07-11 | 13F | Quad-Cities Investment Group, LLC | 37,902 | 57.09 | 880 | 57.14 | ||||
| 2025-08-12 | 13F | Boreal Capital Management LLC | 0 | 228 | ||||||
| 2025-05-15 | 13F/A | Orion Portfolio Solutions, LLC | 78,255 | 1,817 | ||||||
| 2025-07-01 | 13F | Private Client Services, Llc | 129,040 | -4.96 | 2,998 | -4.92 | ||||
| 2025-07-17 | 13F | Tempus Wealth Planning, LLC | 209,534 | 11.40 | 4,867 | 11.45 | ||||
| 2025-08-15 | 13F | Scissortail Wealth Management, LLC | 140,803 | -3.43 | 3,271 | -3.40 | ||||
| 2025-08-14 | 13F | Hurley Capital, LLC | 249,860 | 15.78 | 5,804 | 15.85 | ||||
| 2025-06-23 | NP | LDRH - iShares iBonds 1-5 Year High Yield and Income Ladder ETF | 34,327 | 14.29 | 794 | 13.12 | ||||
| 2025-07-16 | 13F | Rebalance, Llc | 43,540 | 1.38 | 1,011 | 1.40 | ||||
| 2025-08-01 | 13F | Austin Private Wealth, LLC | 20,379 | 23.66 | 473 | 23.82 | ||||
| 2025-08-12 | 13F | Steward Partners Investment Advisory, Llc | 14,285 | 6.60 | 332 | 6.43 | ||||
| 2025-08-13 | 13F | Jones Financial Companies Lllp | 0 | -100.00 | 0 | |||||
| 2025-07-28 | 13F | Mutual Advisors, LLC | 271,980 | 3.15 | 6,325 | 3.49 | ||||
| 2025-08-12 | 13F | Proequities, Inc. | 0 | 0 | ||||||
| 2025-08-08 | 13F | Cetera Investment Advisers | 93,990 | 2.56 | 2,183 | 2.63 | ||||
| 2025-08-12 | 13F | Landing Point Financial Group, LLC | 53,070 | 15.60 | 1,233 | 15.68 | ||||
| 2025-08-14 | 13F | Royal Bank Of Canada | 328,597 | 33.01 | 7,633 | 33.07 | ||||
| 2025-08-14 | 13F | EP Wealth Advisors, Inc. | 148,248 | -7.67 | 3,444 | -7.64 | ||||
| 2025-07-25 | 13F | Heartland Bank & Trust Co | 20,321 | 50.06 | 472 | 50.32 | ||||
| 2025-08-15 | 13F | SkyView Investment Advisors, LLC | 149,642 | -29.67 | 3 | -25.00 | ||||
| 2025-08-12 | 13F | BWM Planning, LLC | 20,566 | 1.70 | 478 | 1.71 | ||||
| 2025-08-12 | 13F | LPL Financial LLC | 733,946 | 35.34 | 17,050 | 35.40 | ||||
| 2025-08-13 | 13F | Baird Financial Group, Inc. | 15,294 | -3.64 | 355 | -3.53 | ||||
| 2025-07-25 | 13F | Atria Wealth Solutions, Inc. | 136,632 | 1.61 | 3,174 | 1.63 | ||||
| 2025-07-10 | 13F | Klaas Financial Asset Advisors, LLC | 26,578 | -5.80 | 617 | -5.80 | ||||
| 2025-07-11 | 13F | Windsor Capital Management, LLC | 0 | -100.00 | 0 | |||||
| 2025-08-15 | 13F | Kestra Advisory Services, LLC | 13,223 | 12.05 | 307 | 12.04 | ||||
| 2025-07-29 | 13F | Koshinski Asset Management, Inc. | 22,128 | 514 | ||||||
| 2025-05-05 | 13F | Diversify Advisory Services, LLC | 0 | -100.00 | 0 | |||||
| 2025-08-12 | 13F | Jpmorgan Chase & Co | 142 | -52.67 | 3 | -50.00 | ||||
| 2025-05-02 | 13F | Sigma Planning Corp | 0 | -100.00 | 0 | |||||
| 2025-07-15 | 13F | Sightline Wealth Advisors, LLC | 69,536 | 0.08 | 1,615 | 0.12 | ||||
| 2025-07-21 | 13F | Ameriflex Group, Inc. | 6,734 | 19.46 | 156 | 20.00 | ||||
| 2025-08-04 | 13F | Creative Financial Designs Inc /adv | 5,574 | 129 | ||||||
| 2025-07-24 | 13F | Ronald Blue Trust, Inc. | 3,151 | 0.45 | 73 | 1.39 | ||||
| 2025-07-14 | 13F | Golden State Equity Partners | 37,325 | 0.47 | 867 | 0.58 | ||||
| 2025-08-14 | 13F | Straightline Group Llc | 766,062 | 4.25 | 17,796 | 4.30 | ||||
| 2025-07-23 | 13F | High Note Wealth, LLC | 150,167 | 3,488 | ||||||
| 2025-08-11 | 13F | HighTower Advisors, LLC | 349,866 | 2.54 | 8,127 | 2.59 | ||||
| 2025-07-09 | 13F | Lbmc Investment Advisors, Llc | 854,318 | 13.11 | 19,846 | 13.15 | ||||
| 2025-07-31 | 13F | Cambridge Investment Research Advisors, Inc. | 1,167,957 | 6.99 | 27 | 8.00 | ||||
| 2025-08-14 | 13F | Sunbelt Securities, Inc. | 12,750 | 0.00 | 295 | -0.34 | ||||
| 2025-08-05 | 13F | Summit Investment Advisory Services, LLC | 297,431 | 6,909 | ||||||
| 2025-08-05 | 13F | Bank Of Montreal /can/ | 1,959 | 46 | ||||||
| 2025-07-24 | 13F | Us Bancorp \de\ | 400 | 9 | ||||||
| 2025-07-08 | 13F | Parallel Advisors, LLC | 32,650 | 27.29 | 758 | 27.39 | ||||
| 2025-07-31 | 13F | Orion Capital Management LLC | 11,000 | 52.35 | 256 | 52.69 | ||||
| 2025-08-14 | 13F | Raymond James Financial Inc | 568,962 | 25.49 | 13,217 | 25.54 | ||||
| 2025-07-18 | 13F | Consolidated Portfolio Review Corp | 21,649 | 8.39 | 503 | 8.42 | ||||
| 2025-08-14 | 13F | 10Elms LLP | 10,615 | 0.00 | 247 | 0.00 | ||||
| 2025-07-24 | 13F | Robertson Stephens Wealth Management, LLC | 21,610 | 40.35 | 502 | 40.62 | ||||
| 2025-08-12 | 13F | Timber Creek Capital Management LLC | 38,802 | 12.52 | 899 | 12.25 | ||||
| 2025-07-29 | 13F | Alaska Permanent Capital Management | 10,089 | 0.56 | 234 | 0.43 | ||||
| 2025-08-07 | 13F | New England Private Wealth Advisors LLC | 9,494 | 2.27 | 221 | 2.33 | ||||
| 2025-07-15 | 13F | Carr Financial Group Corp | 83,323 | 17.66 | 1,936 | 17.70 | ||||
| 2025-08-13 | 13F | Northwestern Mutual Wealth Management Co | 798,372 | 0.87 | 18,546 | 0.92 |