Mga Batayang Estadistika
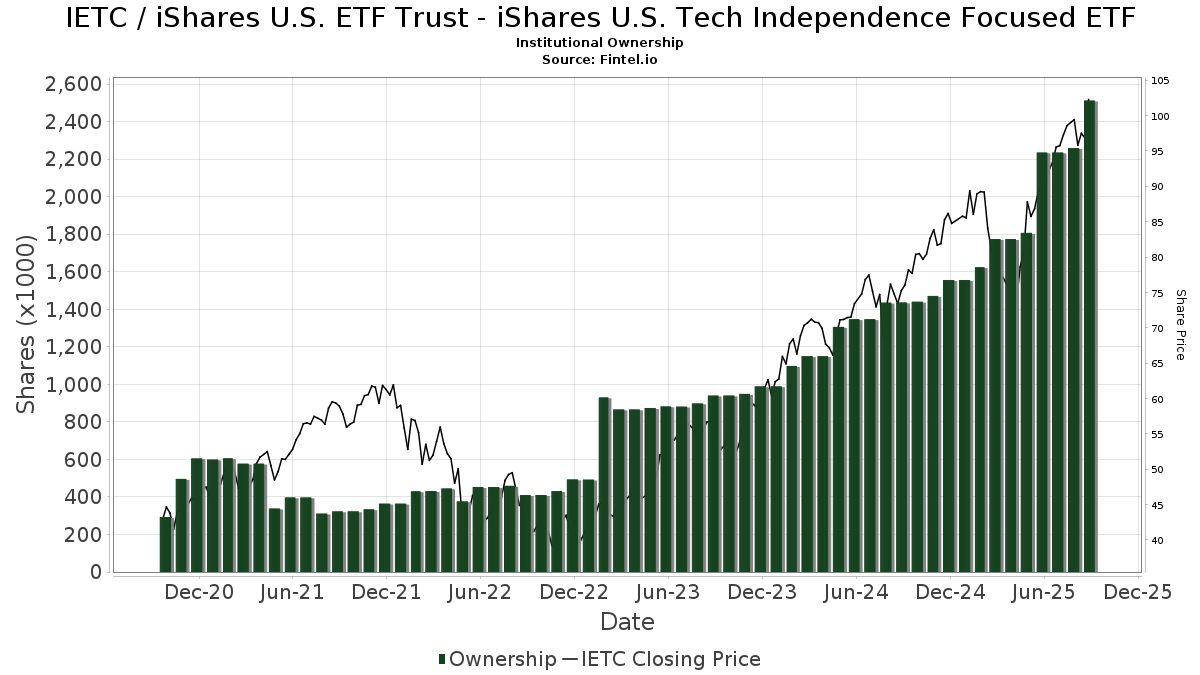
| Pemilik Institusional | 106 total, 105 long only, 0 short only, 1 long/short - change of 22.99% MRQ |
| Alokasi Portofolio Rata-rata | 0.2307 % - change of 4.90% MRQ |
| Saham Institusional (Jangka Panjang) | 2,512,213 (ex 13D/G) - change of 0.28MM shares 12.36% MRQ |
| Nilai Institusional (Jangka Panjang) | $ 223,349 USD ($1000) |
Kepemilikan Institusional dan Pemegang Saham
iShares U.S. ETF Trust - iShares U.S. Tech Independence Focused ETF (US:IETC) memiliki 106 pemilik institusional dan pemegang saham yang telah mengajukan formulir 13D/G atau 13F kepada Komisi Bursa Efek (Securities Exchange Commission/SEC). Lembaga-lembaga ini memegang total 2,512,213 saham. Pemegang saham terbesar meliputi Kozak & Associates, Inc., Mirae Asset Global Investments Co., Ltd., Beacon Harbor Wealth Advisors, Inc., Gradient Investments LLC, Jpmorgan Chase & Co, LPL Financial LLC, Mml Investors Services, Llc, Raymond James Financial Inc, Integrated Wealth Concepts LLC, and Apexium Financial, Lp .
Struktur kepemilikan institusional iShares U.S. ETF Trust - iShares U.S. Tech Independence Focused ETF (BATS:IETC) menunjukkan posisi terkini di perusahaan oleh institusi dan dana, serta perubahan terbaru dalam ukuran posisi. Pemegang saham utama dapat mencakup investor individu, reksa dana, dana lindung nilai, atau institusi. Jadwal 13D menunjukkan bahwa investor memegang (atau pernah memegang) lebih dari 5% saham perusahaan dan bermaksud (atau pernah bermaksud) untuk secara aktif mengejar perubahan strategi bisnis. Jadwal 13G menunjukkan investasi pasif lebih dari 5%.
The share price as of September 5, 2025 is 98.37 / share. Previously, on September 6, 2024, the share price was 71.52 / share. This represents an increase of 37.54% over that period.
Skor Sentimen Dana
Skor Sentimen Dana (sebelumnya dikenal sebagai Skor Akumulasi Kepemilikan) menemukan saham-saham yang paling banyak dibeli oleh dana. Ini adalah hasil dari model kuantitatif multi-faktor yang canggih yang mengidentifikasi perusahaan dengan tingkat akumulasi institusional tertinggi. Model penilaian menggunakan kombinasi dari total peningkatan pemilik yang diungkapkan, perubahan dalam alokasi portofolio pada pemilik tersebut, dan metrik lainnya. Angka berkisar dari 0 hingga 100, dengan angka yang lebih tinggi menunjukkan tingkat akumulasi yang lebih tinggi dibandingkan dengan perusahaan sejenisnya, dan 50 adalah rata-ratanya.
Frekuensi Pembaruan: Setiap Hari
Lihat Ownership Explorer, yang menyediakan daftar perusahaan dengan peringkat tertinggi.
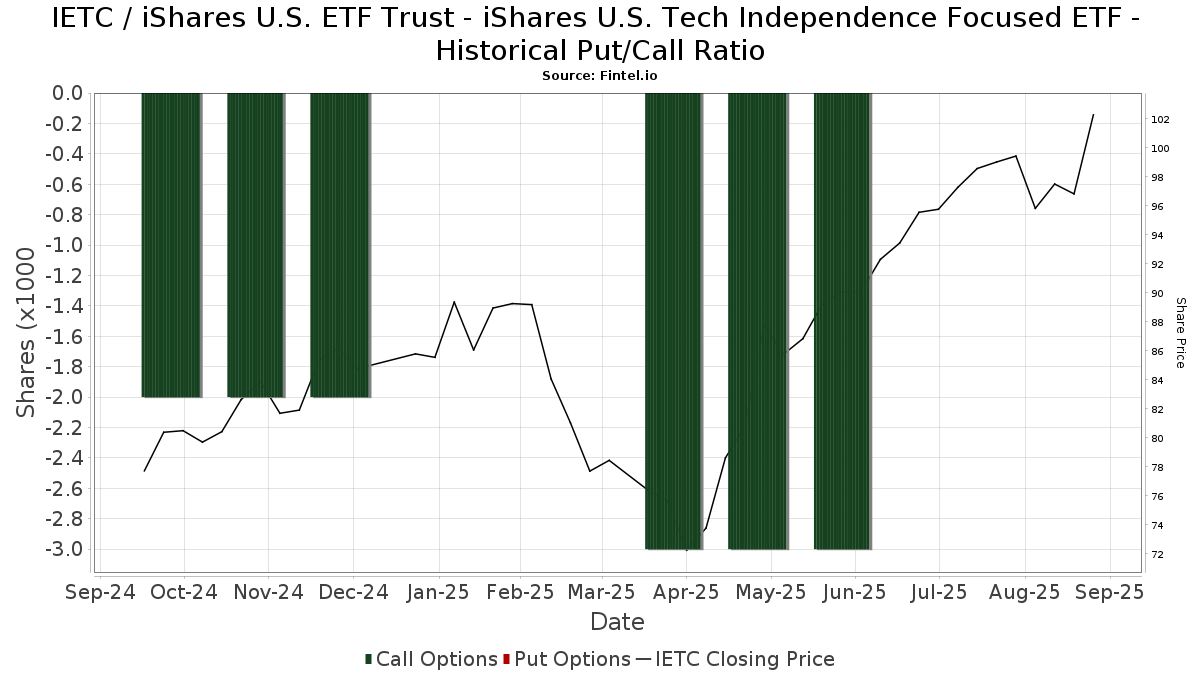
Rasio Put/Call Institusional
Selain melaporkan isu ekuitas dan utang standar, institusi dengan aset di bawah manajemen lebih dari 100 juta dolar AS juga harus mengungkapkan kepemilikan opsi put dan call mereka. Karena opsi put umumnya menunjukkan sentimen negatif, dan opsi call menunjukkan sentimen positif, kita dapat mengetahui sentimen institusional secara keseluruhan dengan memplot rasio put terhadap call. Grafik di sebelah kanan memplot rasio put/call historis untuk instrumen ini.
Menggunakan Rasio Put/Call sebagai indikator sentimen investor mengatasi salah satu kekurangan utama dari penggunaan total kepemilikan institusional, yaitu sejumlah besar aset yang dikelola diinvestasikan secara pasif untuk melacak indeks. Dana yang dikelola secara pasif biasanya tidak membeli opsi, sehingga indikator rasio put/call lebih akurat dalam melacak sentimen dana yang dikelola secara aktif.
Pengajuan 13F dan NPORT
Detail pada pengajuan 13F tersedia gratis. Detail pada pengajuan NP memerlukan keanggotaan premium. Baris berwarna hijau menunjukkan posisi baru. Baris berwarna merah menunjukkan posisi yang sudah ditutup. Klik tautan ini ikon untuk melihat riwayat transaksi selengkapnya.
Tingkatkan
untuk membuka data premium dan mengekspor ke Excel ![]() .
.
| Tanggal File | Sumber | Investor | Ketik | Presyo ng Avg (Silangan) |
Saham | Δ Saham (%) |
Dilaporkan Nilai ($1000) |
Nilai Δ (%) |
Alokasi Port (%) |
|
|---|---|---|---|---|---|---|---|---|---|---|
| 2025-08-05 | 13F | Sigma Planning Corp | 8,667 | 13.35 | 815 | 42.06 | ||||
| 2025-07-10 | 13F | Sovran Advisors, LLC | 3,232 | 306 | ||||||
| 2025-07-02 | 13F | Central Pacific Bank - Trust Division | 71 | 0.00 | 7 | 20.00 | ||||
| 2025-05-12 | 13F | Fmr Llc | 0 | -100.00 | 0 | |||||
| 2025-07-29 | 13F | Mattson Financial Services, LLC | 22,382 | 10.51 | 2,104 | 38.63 | ||||
| 2025-08-04 | 13F | Assetmark, Inc | 21,624 | 70.24 | 2,033 | 113.67 | ||||
| 2025-08-12 | 13F | Steward Partners Investment Advisory, Llc | 267 | 25 | ||||||
| 2025-08-14 | 13F | Citadel Advisors Llc | 0 | -100.00 | 0 | |||||
| 2025-05-15 | 13F | Mariner, LLC | 0 | -100.00 | 0 | |||||
| 2025-08-13 | 13F | Northwestern Mutual Wealth Management Co | 45,676 | 740.10 | 4,294 | 954.79 | ||||
| 2025-08-06 | 13F | Mascagni Wealth Management, Inc. | 4,840 | 455 | ||||||
| 2025-08-12 | 13F | Proequities, Inc. | 0 | 0 | ||||||
| 2025-08-01 | 13F | Bessemer Group Inc | 2,165 | 0 | ||||||
| 2025-08-01 | 13F | Belvedere Trading LLC | Call | 3,900 | 367 | |||||
| 2025-08-01 | 13F | Belvedere Trading LLC | Put | 200 | 19 | |||||
| 2025-07-25 | 13F | Atria Wealth Solutions, Inc. | 55,773 | -4.40 | 5,243 | 19.90 | ||||
| 2025-07-08 | 13F | Gradient Investments LLC | 123,960 | 16.34 | 11,652 | 45.94 | ||||
| 2025-07-30 | 13F | TFB Advisors LLC | 4,080 | 34.65 | 384 | 68.72 | ||||
| 2025-08-15 | 13F | Equitable Holdings, Inc. | 8,508 | 2.43 | 800 | 28.46 | ||||
| 2025-08-05 | 13F | Tsfg, Llc | 100 | 0.00 | 0 | |||||
| 2025-07-24 | 13F | IFP Advisors, Inc | 45 | 4 | ||||||
| 2025-07-22 | 13F | Sutton Place Investors Llc | 27,491 | 0.42 | 2,584 | 25.99 | ||||
| 2025-08-11 | 13F | Regal Investment Advisors LLC | 4,428 | 0.05 | 416 | 25.68 | ||||
| 2025-07-28 | 13F | Private Wealth Asset Management, LLC | 267 | 0.00 | 25 | 25.00 | ||||
| 2025-08-14 | 13F | GWM Advisors LLC | 6,677 | 1,012.83 | 628 | 1,325.00 | ||||
| 2025-08-12 | 13F | Jpmorgan Chase & Co | 103,959 | 228.16 | 9,772 | 311.63 | ||||
| 2025-08-12 | 13F | BlackRock, Inc. | 62 | 0.00 | 6 | 25.00 | ||||
| 2025-07-21 | 13F | Ameritas Advisory Services, LLC | 12,951 | -26.95 | 1,217 | -18.43 | ||||
| 2025-08-14 | 13F | Hilltop Holdings Inc. | 2,167 | 204 | ||||||
| 2025-08-01 | 13F | Rossby Financial, LCC | 8 | 0.00 | 1 | |||||
| 2025-08-14 | 13F | Wells Fargo & Company/mn | 0 | 0 | ||||||
| 2025-07-29 | 13F | Hoese & Co LLP | 1,165 | 110 | ||||||
| 2025-07-08 | 13F | RMR Wealth Builders | 8,398 | -0.34 | 789 | 25.04 | ||||
| 2025-07-23 | 13F | Lansing Street Advisors | 12,331 | 5.82 | 1,159 | 32.76 | ||||
| 2025-08-13 | 13F | Continuum Advisory, LLC | 0 | -100.00 | 0 | |||||
| 2025-08-14 | 13F | Wiley Bros.-aintree Capital, Llc | 9,339 | 13.75 | 878 | 42.14 | ||||
| 2025-07-31 | 13F | Cambridge Investment Research Advisors, Inc. | 30,224 | 16.86 | 3 | 100.00 | ||||
| 2025-08-14 | 13F | Icon Wealth Advisors, LLC | 4,715 | 0.11 | 443 | 25.85 | ||||
| 2025-08-11 | 13F | Principal Securities, Inc. | 1,187 | 3,993.10 | 112 | 5,450.00 | ||||
| 2025-08-05 | 13F | Simplex Trading, Llc | 0 | -100.00 | 0 | |||||
| 2025-07-10 | 13F | Wealth Enhancement Advisory Services, Llc | 2,465 | 234 | ||||||
| 2025-08-08 | 13F | Creative Planning | 5,265 | -0.49 | 495 | 24.75 | ||||
| 2025-07-09 | 13F | Pallas Capital Advisors LLC | 2,383 | -81.44 | 224 | -76.80 | ||||
| 2025-08-08 | 13F | Beacon Harbor Wealth Advisors, Inc. | 129,257 | 12,150 | ||||||
| 2025-07-08 | 13F | Zrc Wealth Management, Llc | 1 | 0.00 | 0 | |||||
| 2025-08-08 | 13F | KM Capital Management Ltd. | 16,548 | -6.78 | 1,556 | 16.92 | ||||
| 2025-08-14 | 13F | Glen Eagle Advisors, LLC | 5,631 | 1.24 | 529 | 27.16 | ||||
| 2025-07-17 | 13F | Sound Income Strategies, LLC | 176 | 0.00 | 17 | 23.08 | ||||
| 2025-08-12 | 13F | Vestor Capital, Llc | 2,034 | 0 | ||||||
| 2025-08-04 | 13F | Spire Wealth Management | 20 | 0.00 | 2 | 0.00 | ||||
| 2025-07-22 | 13F | Bay Harbor Wealth Management, LLC | 5,849 | 0.00 | 550 | 25.34 | ||||
| 2025-08-06 | 13F | AE Wealth Management LLC | 10,959 | 16.02 | 1,030 | 45.69 | ||||
| 2025-08-14 | 13F | Comerica Bank | 317 | 30 | ||||||
| 2025-08-08 | 13F | Advisors Capital Management, LLC | 14,661 | 2.13 | 1,378 | 28.19 | ||||
| 2025-07-11 | 13F | Farther Finance Advisors, LLC | 398 | -5.01 | 37 | 19.35 | ||||
| 2025-08-08 | 13F | Comprehensive Financial Planning, Inc./PA | 4,793 | 13.61 | 451 | 42.41 | ||||
| 2025-07-08 | 13F | Ehrlich Financial Group | 2,790 | 262 | ||||||
| 2025-07-18 | 13F | Parsons Capital Management Inc/ri | 3,288 | 0.00 | 309 | 25.61 | ||||
| 2025-08-14 | 13F | Mml Investors Services, Llc | 98,609 | -4.83 | 9 | 28.57 | ||||
| 2025-07-24 | 13F | Fischer Investment Strategies, Llc | 2,932 | 276 | ||||||
| 2025-08-08 | 13F | Larson Financial Group LLC | 137 | 21.24 | 13 | 50.00 | ||||
| 2025-08-12 | 13F | LPL Financial LLC | 100,891 | 73.12 | 9,484 | 117.15 | ||||
| 2025-07-23 | 13F | BankPlus Trust Department | 71 | 0.00 | 7 | 20.00 | ||||
| 2025-08-13 | 13F | BCJ Capital Management, LLC | 54,527 | 20.18 | 5,126 | 50.74 | ||||
| 2025-08-14 | 13F | Federation des caisses Desjardins du Quebec | 708 | 0.00 | 67 | 24.53 | ||||
| 2025-08-14 | 13F | Kovitz Investment Group Partners, LLC | 5,125 | 482 | ||||||
| 2025-08-14 | 13F | McIlrath & Eck, LLC | 293 | 0.00 | 28 | 28.57 | ||||
| 2025-08-11 | 13F | Western Wealth Management, LLC | 2,258 | 212 | ||||||
| 2025-08-07 | 13F | Cascade Financial Partners, LLC | 2,250 | 212 | ||||||
| 2025-08-12 | 13F | Global Retirement Partners, LLC | 10,613 | 998 | ||||||
| 2025-07-23 | 13F | Ironwood Financial, llc | 11,018 | 0.00 | 826 | 0.00 | ||||
| 2025-08-13 | 13F | WCG Wealth Advisors LLC | 10,736 | 1,009 | ||||||
| 2025-08-14 | 13F | Jane Street Group, Llc | 11,875 | 1,116 | ||||||
| 2025-08-14 | 13F | Integrated Wealth Concepts LLC | 71,020 | -5.76 | 6,676 | 18.20 | ||||
| 2025-08-08 | 13F | Cetera Investment Advisers | 3,622 | 11.07 | 340 | 39.34 | ||||
| 2025-08-01 | 13F | Envestnet Asset Management Inc | 10,977 | 31.92 | 1,032 | 65.49 | ||||
| 2025-08-14 | 13F | Old Mission Capital Llc | 3,199 | 301 | ||||||
| 2025-08-13 | 13F | GeoWealth Management, LLC | 49,695 | 143.85 | 4,671 | 205.89 | ||||
| 2025-07-24 | 13F | Us Bancorp \de\ | 50 | 0.00 | 5 | 33.33 | ||||
| 2025-08-05 | 13F | Lord & Richards Wealth Management, LLC | 0 | -100.00 | 0 | |||||
| 2025-08-14 | 13F | Two Sigma Investments, Lp | 17,500 | -77.45 | 1,645 | -71.71 | ||||
| 2025-08-15 | 13F | Morgan Stanley | 3,096 | -5.03 | 291 | 19.26 | ||||
| 2025-05-13 | 13F | Bank Of Montreal /can/ | 0 | -100.00 | 0 | |||||
| 2025-08-13 | 13F | Cerity Partners LLC | 4,395 | 0.05 | 413 | 25.53 | ||||
| 2025-07-28 | 13F | Harbour Investments, Inc. | 91 | 0.00 | 9 | 33.33 | ||||
| 2025-07-07 | 13F | Nova Wealth Management, Inc. | 3,140 | 232.28 | 295 | 321.43 | ||||
| 2025-07-10 | 13F | Worth Asset Management, LLC | 2,768 | 260 | ||||||
| 2025-08-14 | 13F | Raymond James Financial Inc | 85,517 | 0.93 | 8,039 | 26.60 | ||||
| 2025-05-13 | 13F | UBS Group AG | 0 | -100.00 | 0 | |||||
| 2025-07-25 | 13F | Cwm, Llc | 256 | 0.00 | 0 | |||||
| 2025-07-10 | 13F | Signal Advisors Wealth, LLC | 2,657 | 250 | ||||||
| 2025-08-13 | 13F | Jones Financial Companies Lllp | 1,431 | 3,477.50 | 133 | 4,333.33 | ||||
| 2025-09-04 | 13F/A | Advisor Group Holdings, Inc. | 38,972 | 20.93 | 3,648 | 51.01 | ||||
| 2025-07-21 | 13F | Mirae Asset Global Investments Co., Ltd. | 140,751 | -30.74 | 13,231 | -13.41 | ||||
| 2025-07-15 | 13F | Financial Partners Group, Inc | 4,234 | 2.64 | 398 | 28.80 | ||||
| 2025-07-17 | 13F | HB Wealth Management, LLC | 2,500 | 235 | ||||||
| 2025-07-22 | 13F | Apexium Financial, Lp | 66,932 | 323.81 | 6,292 | 431.78 | ||||
| 2025-07-30 | 13F | Financial Perspectives, Inc | 10,708 | 4.52 | 1,007 | 23.44 | ||||
| 2025-07-18 | 13F | Truist Financial Corp | 20,427 | 0.19 | 1,920 | 25.74 | ||||
| 2025-08-13 | 13F | Haverford Trust Co | 3,115 | 0.00 | 293 | 25.32 | ||||
| 2025-08-14 | 13F | Stifel Financial Corp | 48,758 | -42.19 | 4,583 | -27.50 | ||||
| 2025-08-06 | 13F | Kcm Investment Advisors Llc | 9,636 | 0.00 | 906 | 25.35 | ||||
| 2025-08-14 | 13F | Royal Bank Of Canada | 6,374 | 15.16 | 599 | 44.34 | ||||
| 2025-08-14 | 13F | Susquehanna International Group, Llp | 21,932 | -66.62 | 2,062 | -58.14 | ||||
| 2025-07-10 | 13F | Kozak & Associates, Inc. | 682,461 | 0.48 | 65,209 | 29.76 | ||||
| 2025-07-15 | 13F | Patriot Investment Management Inc. | 11,009 | 1.28 | 1,035 | 27.03 | ||||
| 2025-07-23 | 13F | Richardson Capital Management LLC | 1,008 | 1.41 | 95 | 27.03 | ||||
| 2025-08-04 | 13F | Keybank National Association/oh | 27,304 | 2,567 | ||||||
| 2025-08-07 | 13F | Efficient Advisors, LLC | 17,985 | 62.69 | 1,691 | 104.11 | ||||
| 2025-08-15 | 13F | Tower Research Capital LLC (TRC) | 24,021 | 69.09 | 2,258 | 112.12 | ||||
| 2025-08-07 | 13F | Montag A & Associates Inc | 2,691 | -30.88 | 253 | -13.40 | ||||
| 2025-08-25 | 13F | Fulcrum Equity Management | 0 | -100.00 | 0 | |||||
| 2025-07-10 | 13F | Shira Ridge Wealth Management | 17,203 | -0.71 | 1,617 | 24.58 | ||||
| 2025-07-31 | 13F | Moloney Securities Asset Management, LLC | 7,735 | 0.00 | 727 | 25.56 | ||||
| 2025-08-15 | 13F | Kestra Advisory Services, LLC | 3,820 | 359 | ||||||
| 2025-08-06 | 13F | Commonwealth Equity Services, Llc | 11,269 | -9.88 | 1 | |||||
| 2025-08-14 | 13F | Goldman Sachs Group Inc | 24,717 | 70.15 | 2,323 | 113.51 | ||||
| 2025-08-07 | 13F | Allworth Financial LP | 1,600 | 0.00 | 150 | 22.95 |