Mga Batayang Estadistika
| Pemilik Institusional | 115 total, 115 long only, 0 short only, 0 long/short - change of -3.36% MRQ |
| Alokasi Portofolio Rata-rata | 0.0885 % - change of -5.39% MRQ |
| Saham Institusional (Jangka Panjang) | 37,971,178 (ex 13D/G) - change of -1.25MM shares -3.18% MRQ |
| Nilai Institusional (Jangka Panjang) | $ 179,081 USD ($1000) |
Kepemilikan Institusional dan Pemegang Saham
CBRE Global Real Estate Income Fund (US:IGR) memiliki 115 pemilik institusional dan pemegang saham yang telah mengajukan formulir 13D/G atau 13F kepada Komisi Bursa Efek (Securities Exchange Commission/SEC). Lembaga-lembaga ini memegang total 37,971,178 saham. Pemegang saham terbesar meliputi Morgan Stanley, UBS Group AG, Penserra Capital Management LLC, YYY - Amplify High Income ETF, Flagship Harbor Advisors, Llc, Bank Of America Corp /de/, Wells Fargo & Company/mn, Ameriprise Financial Inc, LPL Financial LLC, and Pacific Wealth Strategies Group, Inc. .
Struktur kepemilikan institusional CBRE Global Real Estate Income Fund (NYSE:IGR) menunjukkan posisi terkini di perusahaan oleh institusi dan dana, serta perubahan terbaru dalam ukuran posisi. Pemegang saham utama dapat mencakup investor individu, reksa dana, dana lindung nilai, atau institusi. Jadwal 13D menunjukkan bahwa investor memegang (atau pernah memegang) lebih dari 5% saham perusahaan dan bermaksud (atau pernah bermaksud) untuk secara aktif mengejar perubahan strategi bisnis. Jadwal 13G menunjukkan investasi pasif lebih dari 5%.
The share price as of September 5, 2025 is 5.06 / share. Previously, on September 6, 2024, the share price was 6.35 / share. This represents a decline of 20.31% over that period.

Skor Sentimen Dana
Skor Sentimen Dana (sebelumnya dikenal sebagai Skor Akumulasi Kepemilikan) menemukan saham-saham yang paling banyak dibeli oleh dana. Ini adalah hasil dari model kuantitatif multi-faktor yang canggih yang mengidentifikasi perusahaan dengan tingkat akumulasi institusional tertinggi. Model penilaian menggunakan kombinasi dari total peningkatan pemilik yang diungkapkan, perubahan dalam alokasi portofolio pada pemilik tersebut, dan metrik lainnya. Angka berkisar dari 0 hingga 100, dengan angka yang lebih tinggi menunjukkan tingkat akumulasi yang lebih tinggi dibandingkan dengan perusahaan sejenisnya, dan 50 adalah rata-ratanya.
Frekuensi Pembaruan: Setiap Hari
Lihat Ownership Explorer, yang menyediakan daftar perusahaan dengan peringkat tertinggi.
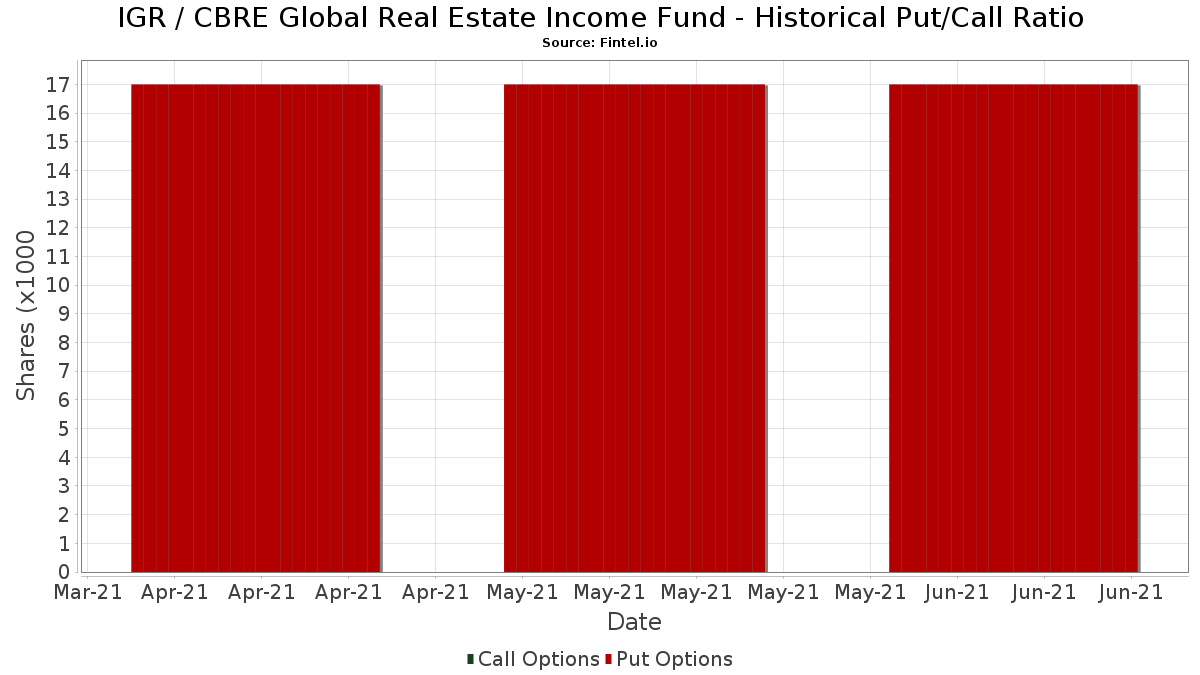
Rasio Put/Call Institusional
Selain melaporkan isu ekuitas dan utang standar, institusi dengan aset di bawah manajemen lebih dari 100 juta dolar AS juga harus mengungkapkan kepemilikan opsi put dan call mereka. Karena opsi put umumnya menunjukkan sentimen negatif, dan opsi call menunjukkan sentimen positif, kita dapat mengetahui sentimen institusional secara keseluruhan dengan memplot rasio put terhadap call. Grafik di sebelah kanan memplot rasio put/call historis untuk instrumen ini.
Menggunakan Rasio Put/Call sebagai indikator sentimen investor mengatasi salah satu kekurangan utama dari penggunaan total kepemilikan institusional, yaitu sejumlah besar aset yang dikelola diinvestasikan secara pasif untuk melacak indeks. Dana yang dikelola secara pasif biasanya tidak membeli opsi, sehingga indikator rasio put/call lebih akurat dalam melacak sentimen dana yang dikelola secara aktif.
Pengajuan 13F dan NPORT
Detail pada pengajuan 13F tersedia gratis. Detail pada pengajuan NP memerlukan keanggotaan premium. Baris berwarna hijau menunjukkan posisi baru. Baris berwarna merah menunjukkan posisi yang sudah ditutup. Klik tautan ini ikon untuk melihat riwayat transaksi selengkapnya.
Tingkatkan
untuk membuka data premium dan mengekspor ke Excel ![]() .
.
| Tanggal File | Sumber | Investor | Ketik | Presyo ng Avg (Silangan) |
Saham | Δ Saham (%) |
Dilaporkan Nilai ($1000) |
Nilai Δ (%) |
Alokasi Port (%) |
|
|---|---|---|---|---|---|---|---|---|---|---|
| 2025-08-11 | 13F | Private Advisor Group, LLC | 14,953 | 0.00 | 79 | 2.60 | ||||
| 2025-08-07 | 13F | Kestra Private Wealth Services, Llc | 24,600 | 0.00 | 130 | 3.17 | ||||
| 2025-05-08 | 13F | Harbour Investments, Inc. | 0 | -100.00 | 0 | |||||
| 2025-05-08 | 13F | XTX Topco Ltd | 0 | -100.00 | 0 | |||||
| 2025-08-01 | 13F | Transcend Wealth Collective, Llc | 0 | -100.00 | 0 | |||||
| 2025-08-06 | 13F | Golden State Wealth Management, LLC | 900 | 0.00 | 5 | 0.00 | ||||
| 2025-08-14 | 13F | IHT Wealth Management, LLC | 97,489 | -0.96 | 516 | 1.58 | ||||
| 2025-07-11 | 13F | Seacrest Wealth Management, Llc | 42,345 | 7.77 | 224 | 10.89 | ||||
| 2025-08-14 | 13F | Royal Bank Of Canada | 479,852 | 31.38 | 2,538 | 34.64 | ||||
| 2025-08-07 | 13F | Samalin Investment Counsel, LLC | 90,111 | 2.12 | 477 | 4.62 | ||||
| 2025-08-14 | 13F | Mercer Global Advisors Inc /adv | 0 | -100.00 | 0 | |||||
| 2025-08-13 | 13F | Rsm Us Wealth Management Llc | 76,339 | -10.17 | 404 | -7.99 | ||||
| 2025-07-18 | 13F | Cooper Financial Group | 236,055 | 3.12 | 1,249 | 5.67 | ||||
| 2025-08-18 | 13F | Geneos Wealth Management Inc. | 40,688 | -13.00 | 215 | -10.79 | ||||
| 2025-07-22 | 13F | Merit Financial Group, LLC | 78,690 | 33.71 | 416 | 37.29 | ||||
| 2025-07-18 | 13F | SOA Wealth Advisors, LLC. | 174 | 3.57 | 1 | |||||
| 2025-05-13 | 13F | HighTower Advisors, LLC | 0 | -100.00 | 0 | -100.00 | ||||
| 2025-07-09 | 13F | Sunpointe, LLC | 84,900 | 449 | ||||||
| 2025-08-05 | 13F | Pacific Wealth Strategies Group, Inc. | 635,083 | -10.06 | 3,074 | -15.65 | ||||
| 2025-08-14 | 13F | Stifel Financial Corp | 225,100 | 1.94 | 1,191 | 4.48 | ||||
| 2025-08-14 | 13F | Ameriprise Financial Inc | 945,863 | 5.35 | 5,004 | 8.03 | ||||
| 2025-07-21 | 13F | Future Financial Wealth Managment LLC | 10,000 | 0.00 | 53 | 1.96 | ||||
| 2025-08-12 | 13F | LPL Financial LLC | 943,534 | 11.16 | 4,991 | 13.98 | ||||
| 2025-08-04 | 13F | Spire Wealth Management | 523 | 0.00 | 3 | 0.00 | ||||
| 2025-08-12 | 13F | Jpmorgan Chase & Co | 0 | -100.00 | 0 | |||||
| 2025-07-14 | 13F | Pacifica Partners Inc. | 550 | 0.00 | 3 | 0.00 | ||||
| 2025-08-11 | 13F | One Capital Management, LLC | 13,552 | 0.00 | 72 | 2.90 | ||||
| 2025-08-12 | 13F | Coldstream Capital Management Inc | 0 | -100.00 | 0 | |||||
| 2025-08-13 | 13F | Colonial Trust Advisors | 2,750 | 15 | ||||||
| 2025-08-19 | 13F | National Asset Management, Inc. | 21,093 | 1.34 | 112 | 11.00 | ||||
| 2025-08-15 | 13F | Prevail Innovative Wealth Advisors, Llc | 316,674 | 11.55 | 1,675 | 14.41 | ||||
| 2025-08-11 | 13F | PFG Private Wealth Management, LLC | 0 | -100.00 | 0 | |||||
| 2025-07-10 | 13F | Stolper Co | 105,933 | 8.33 | 1 | |||||
| 2025-08-14 | 13F | EP Wealth Advisors, Inc. | 35,249 | 0.00 | 186 | 2.76 | ||||
| 2025-07-16 | 13F | Investment Partners Asset Management, Inc. | 173,024 | -0.21 | 915 | 2.35 | ||||
| 2025-07-25 | 13F | Cwm, Llc | 3,621 | 0.00 | 0 | |||||
| 2025-08-14 | 13F | Mariner, LLC | 85,415 | 3.60 | 452 | 6.12 | ||||
| 2025-08-14 | 13F | Moneta Group Investment Advisors Llc | 0 | -100.00 | 0 | |||||
| 2025-05-12 | 13F | Fmr Llc | 0 | -100.00 | 0 | |||||
| 2025-08-12 | 13F | NWF Advisory Services Inc. | 276,100 | 1,425 | ||||||
| 2025-08-05 | 13F | Bank of New York Mellon Corp | 0 | -100.00 | 0 | |||||
| 2025-08-12 | 13F | Evelyn Partners Asset Management Ltd | 2,823 | 15 | ||||||
| 2025-08-14 | 13F | Two Sigma Securities, Llc | 0 | -100.00 | 0 | |||||
| 2025-08-04 | 13F | Flagship Harbor Advisors, Llc | 1,916,196 | 3.34 | 10,137 | 5.94 | ||||
| 2025-07-25 | 13F | Hazlett, Burt & Watson, Inc. | 1,000 | 0.00 | 0 | |||||
| 2025-05-13 | 13F | SFI Advisors, LLC | 0 | -100.00 | 0 | |||||
| 2025-07-31 | 13F | 180 Wealth Advisors, Llc | 165,457 | -0.37 | 875 | 2.58 | ||||
| 2025-08-13 | 13F | Fiduciary Group LLC | 15,953 | 6.50 | 84 | 9.09 | ||||
| 2025-08-14 | 13F | GWM Advisors LLC | 42,605 | 123.18 | 225 | 129.59 | ||||
| 2025-07-24 | 13F | Leo Wealth, LLC | 13,981 | 3.60 | 74 | 5.80 | ||||
| 2025-08-14 | 13F | Bank Of America Corp /de/ | 1,845,097 | 0.13 | 9,761 | 2.65 | ||||
| 2025-07-21 | 13F | Ameriflex Group, Inc. | 4,200 | -85.31 | 22 | -85.71 | ||||
| 2025-05-14 | 13F | Susquehanna International Group, Llp | 0 | -100.00 | 0 | |||||
| 2025-08-08 | 13F | Larson Financial Group LLC | 6,000 | 0.00 | 32 | 3.33 | ||||
| 2025-08-11 | 13F | Citigroup Inc | 2 | 0.00 | 0 | |||||
| 2025-08-15 | 13F | Captrust Financial Advisors | 39,877 | 211 | ||||||
| 2025-08-11 | 13F | Actinver Wealth Management, Inc. | 22,442 | 30.43 | 119 | 34.09 | ||||
| 2025-07-23 | 13F | Clear Creek Financial Management, LLC | 0 | -100.00 | 0 | |||||
| 2025-08-13 | 13F | Baird Financial Group, Inc. | 60,734 | -8.60 | 321 | -6.14 | ||||
| 2025-07-10 | 13F | Wealth Enhancement Advisory Services, Llc | 66,389 | -1.71 | 356 | 2.01 | ||||
| 2025-08-12 | 13F | MAI Capital Management | 1,286 | 365.94 | 7 | 500.00 | ||||
| 2025-08-13 | 13F | Guggenheim Capital Llc | 64,197 | -2.40 | 340 | 0.00 | ||||
| 2025-05-12 | 13F | Peapack Gladstone Financial Corp | 0 | -100.00 | 0 | |||||
| 2025-08-12 | 13F | J.w. Cole Advisors, Inc. | 431,757 | 2.81 | 2,284 | 5.35 | ||||
| 2025-08-07 | 13F | Addison Advisors LLC | 61 | 0.00 | 0 | |||||
| 2025-08-11 | 13F | Nations Financial Group Inc, /ia/ /adv | 14,436 | 0.00 | 76 | 2.70 | ||||
| 2025-08-18 | 13F/A | National Bank Of Canada /fi/ | 55,845 | 1,560.08 | 295 | 1,629.41 | ||||
| 2025-08-06 | 13F | Commonwealth Equity Services, Llc | 80,608 | -39.27 | 0 | |||||
| 2025-04-30 | 13F | Heritage Wealth Management, Inc. /CA/ | 0 | -100.00 | 0 | |||||
| 2025-07-07 | 13F | Nova Wealth Management, Inc. | 7,897 | 0.00 | 42 | 2.50 | ||||
| 2025-08-06 | 13F | AE Wealth Management LLC | 12,700 | 67 | ||||||
| 2025-04-16 | 13F | Caldwell Securities, Inc | 0 | -100.00 | 0 | |||||
| 2025-08-04 | 13F | Creative Financial Designs Inc /adv | 1,315 | 0.00 | 7 | 0.00 | ||||
| 2025-07-17 | 13F | Janney Montgomery Scott LLC | 53,273 | 0.61 | 0 | |||||
| 2025-08-13 | 13F | Northwestern Mutual Wealth Management Co | 7,766 | 41 | ||||||
| 2025-07-31 | 13F | Cambridge Investment Research Advisors, Inc. | 52,563 | -2.92 | 0 | |||||
| 2025-08-28 | NP | YYY - Amplify High Income ETF | 3,658,899 | 2.00 | 19,356 | 4.57 | ||||
| 2025-05-16 | 13F | Jones Financial Companies Lllp | 0 | -100.00 | 0 | |||||
| 2025-08-12 | 13F | Proequities, Inc. | 0 | 0 | ||||||
| 2025-04-24 | 13F | Decker Retirement Planning Inc. | 0 | -100.00 | 0 | |||||
| 2025-07-29 | 13F | Stephens Inc /ar/ | 10,278 | -2.59 | 54 | 0.00 | ||||
| 2025-08-04 | 13F | Assetmark, Inc | 144 | 0.00 | 1 | |||||
| 2025-07-30 | 13F | Blume Capital Management, Inc. | 3,000 | 0.00 | 16 | 0.00 | ||||
| 2025-05-14 | 13F | Landscape Capital Management, L.l.c. | 0 | -100.00 | 0 | |||||
| 2025-08-08 | 13F | Schwarz Dygos Wheeler Investment Advisors Llc | 291,921 | 8.65 | 1,544 | 11.40 | ||||
| 2025-07-25 | 13F | We Are One Seven, LLC | 18,336 | 9.93 | 97 | 11.63 | ||||
| 2025-07-30 | 13F | Roman Butler Fullerton & Co | 257,529 | 1.18 | 1,282 | 6.74 | ||||
| 2025-07-14 | 13F | Sowell Financial Services LLC | 11,798 | -55.79 | 62 | -54.74 | ||||
| 2025-05-19 | 13F/A | Jane Street Group, Llc | 0 | -100.00 | 0 | -100.00 | ||||
| 2025-07-14 | 13F | GAMMA Investing LLC | 12 | 0 | ||||||
| 2025-08-15 | 13F | Tower Research Capital LLC (TRC) | 45 | 0 | ||||||
| 2025-08-14 | 13F | CoreCap Advisors, LLC | 2,153 | 0.00 | 11 | 0.00 | ||||
| 2025-08-14 | 13F | Atomi Financial Group, Inc. | 100,808 | -0.67 | 533 | 1.91 | ||||
| 2025-08-14 | 13F | Comerica Bank | 31,339 | -9.92 | 166 | -7.82 | ||||
| 2025-04-14 | 13F | Daymark Wealth Partners, Llc | 0 | -100.00 | 0 | |||||
| 2025-07-17 | 13F/A | Capital Investment Advisors, LLC | 12,982 | -7.44 | 69 | -5.56 | ||||
| 2025-07-10 | 13F | Atticus Wealth Management, Llc | 7,340 | 41.05 | 39 | 46.15 | ||||
| 2025-07-25 | 13F | Atria Wealth Solutions, Inc. | 53,750 | 0.00 | 285 | 2.53 | ||||
| 2025-07-14 | 13F | Occidental Asset Management, LLC | 15,844 | -11.42 | 84 | -9.78 | ||||
| 2025-08-13 | 13F | Level Four Advisory Services, Llc | 14,409 | -35.90 | 76 | -33.91 | ||||
| 2025-05-14 | 13F | Walleye Capital LLC | 0 | -100.00 | 0 | |||||
| 2025-08-14 | 13F | Hrt Financial Lp | 0 | -100.00 | 0 | |||||
| 2025-08-11 | 13F | Elequin Capital Lp | 0 | -100.00 | 0 | |||||
| 2025-08-14 | 13F | Raymond James Financial Inc | 166,585 | 7.17 | 881 | 9.85 | ||||
| 2025-05-09 | 13F | Shaker Financial Services, LLC | 0 | -100.00 | 0 | |||||
| 2025-05-16 | 13F | Coppell Advisory Solutions LLC | 0 | -100.00 | 0 | |||||
| 2025-05-20 | 13F/A | Colony Group, LLC | 0 | -100.00 | 0 | -100.00 | ||||
| 2025-08-11 | 13F | United Capital Financial Advisers, Llc | 10,447 | 0.00 | 55 | 3.77 | ||||
| 2025-08-08 | 13F | Good Life Advisors, LLC | 14,181 | -0.43 | 75 | 2.74 | ||||
| 2025-08-13 | 13F | WealthTrust Axiom LLC | 352,815 | 0.18 | 1,866 | 2.70 | ||||
| 2025-09-04 | 13F/A | Advisor Group Holdings, Inc. | 506,876 | 4.21 | 2,681 | 6.86 | ||||
| 2025-08-12 | 13F | Steward Partners Investment Advisory, Llc | 13,104 | -24.86 | 69 | -22.47 | ||||
| 2025-07-10 | 13F | Kozak & Associates, Inc. | 1,931 | 10 | ||||||
| 2025-08-05 | 13F | Holistic Financial Partners | 14,440 | 0.00 | 76 | 2.70 | ||||
| 2025-08-14 | 13F | Ieq Capital, Llc | 20,141 | -6.07 | 107 | -3.64 | ||||
| 2025-08-11 | 13F | WPG Advisers, LLC | 7,261 | -30.72 | 38 | -29.63 | ||||
| 2025-07-14 | 13F | Park Avenue Securities Llc | 41,403 | -13.00 | 0 | |||||
| 2025-07-21 | 13F | Ameritas Advisory Services, LLC | 19,010 | 79.17 | 101 | 92.31 | ||||
| 2025-05-09 | 13F | Cornerstone Advisors, LLC | 0 | -100.00 | 0 | -100.00 | ||||
| 2025-07-24 | 13F | Us Bancorp \de\ | 45,074 | 0.00 | 238 | 2.59 | ||||
| 2025-08-07 | 13F | Allworth Financial LP | 1,809 | 3,073.68 | 10 | |||||
| 2025-08-12 | 13F | Advisors Asset Management, Inc. | 121,136 | -60.95 | 641 | -60.00 | ||||
| 2025-08-06 | 13F | Mark Sheptoff Financial Planning, Llc | 1,000 | 0.00 | 5 | 0.00 | ||||
| 2025-07-28 | 13F | Axxcess Wealth Management, Llc | 16,538 | -4.81 | 87 | -2.25 | ||||
| 2025-08-05 | 13F | Sigma Planning Corp | 19,820 | 1.11 | 105 | 2.97 | ||||
| 2025-08-01 | 13F | Envestnet Asset Management Inc | 21,237 | 112 | ||||||
| 2025-07-30 | 13F | Whittier Trust Co | 5 | 0 | ||||||
| 2025-07-15 | 13F | Highland Financial Advisors, LLC | 11,600 | 61 | ||||||
| 2025-07-31 | 13F | Leavell Investment Management, Inc. | 12,500 | 0.00 | 66 | 3.13 | ||||
| 2025-08-29 | 13F | Centaurus Financial, Inc. | 0 | -100.00 | 0 | |||||
| 2025-07-29 | 13F | Private Trust Co Na | 1,000 | 0.00 | 5 | 0.00 | ||||
| 2025-07-25 | 13F | GFS Advisors, LLC | 0 | -100.00 | 0 | |||||
| 2025-08-06 | 13F | Moors & Cabot, Inc. | 73,113 | 2.48 | 387 | 4.89 | ||||
| 2025-08-12 | 13F | Global Retirement Partners, LLC | 22,286 | 0.02 | 118 | 9.35 | ||||
| 2025-05-02 | 13F | BlackRock, Inc. | 0 | -100.00 | 0 | |||||
| 2025-08-11 | 13F | Principal Securities, Inc. | 1,576 | 88.07 | 8 | 100.00 | ||||
| 2025-05-12 | 13F | Wolverine Asset Management Llc | 0 | -100.00 | 0 | |||||
| 2025-04-23 | 13F | Walkner Condon Financial Advisors LLC | 0 | -100.00 | 0 | |||||
| 2025-08-08 | 13F | Pnc Financial Services Group, Inc. | 36,662 | -21.09 | 194 | -19.25 | ||||
| 2025-08-15 | 13F | Morgan Stanley | 10,482,631 | -8.82 | 55,453 | -6.52 | ||||
| 2025-08-08 | 13F | Cetera Investment Advisers | 386,511 | 11.62 | 2,045 | 14.45 | ||||
| 2025-08-11 | 13F | Alteri Wealth LLC | 49,327 | 0.00 | 261 | 2.36 | ||||
| 2025-08-05 | 13F | Burney Co/ | 25,437 | 3.20 | 135 | 5.51 | ||||
| 2025-08-14 | 13F | Wells Fargo & Company/mn | 1,585,773 | 3.01 | 8,389 | 5.60 | ||||
| 2025-08-14 | 13F | UBS Group AG | 5,346,993 | -0.09 | 28,286 | 2.43 | ||||
| 2025-08-04 | 13F | Live Oak Private Wealth LLC | 54,884 | 0.00 | 290 | 2.47 | ||||
| 2025-08-05 | 13F | Tsfg, Llc | 1,500 | 0.00 | 0 | |||||
| 2025-05-06 | 13F | Readystate Asset Management Lp | 0 | -100.00 | 0 | -100.00 | ||||
| 2025-07-07 | 13F | Centurion Wealth Management LLC | 10,295 | 0.00 | 54 | 10.20 | ||||
| 2025-08-14 | 13F/A | Rockefeller Capital Management L.P. | 199,200 | 33.58 | 1,054 | 36.93 | ||||
| 2025-07-21 | 13F | Quattro Financial Advisors Llc | 40,291 | 0.00 | 213 | 2.90 | ||||
| 2025-08-06 | 13F | Penserra Capital Management LLC | 3,696,579 | 3.05 | 20 | 5.56 |