Mga Batayang Estadistika
| Pemilik Institusional | 156 total, 156 long only, 0 short only, 0 long/short - change of 3.29% MRQ |
| Alokasi Portofolio Rata-rata | 0.2155 % - change of -0.56% MRQ |
| Saham Institusional (Jangka Panjang) | 6,241,018 (ex 13D/G) - change of 0.66MM shares 11.91% MRQ |
| Nilai Institusional (Jangka Panjang) | $ 429,395 USD ($1000) |
Kepemilikan Institusional dan Pemegang Saham
iShares Trust - iShares Morningstar Mid-Cap Value ETF (US:IMCV) memiliki 156 pemilik institusional dan pemegang saham yang telah mengajukan formulir 13D/G atau 13F kepada Komisi Bursa Efek (Securities Exchange Commission/SEC). Lembaga-lembaga ini memegang total 6,241,018 saham. Pemegang saham terbesar meliputi Morgan Stanley, Raymond James Financial Inc, Equitable Holdings, Inc., Orgel Wealth Management, LLC, EQ ADVISORS TRUST - EQ/Mid Cap Value Managed Volatility Portfolio Class IB, Commonwealth Equity Services, Llc, Bank Of America Corp /de/, LPL Financial LLC, Advisor Group Holdings, Inc., and Wells Fargo & Company/mn .
Struktur kepemilikan institusional iShares Trust - iShares Morningstar Mid-Cap Value ETF (NasdaqGM:IMCV) menunjukkan posisi terkini di perusahaan oleh institusi dan dana, serta perubahan terbaru dalam ukuran posisi. Pemegang saham utama dapat mencakup investor individu, reksa dana, dana lindung nilai, atau institusi. Jadwal 13D menunjukkan bahwa investor memegang (atau pernah memegang) lebih dari 5% saham perusahaan dan bermaksud (atau pernah bermaksud) untuk secara aktif mengejar perubahan strategi bisnis. Jadwal 13G menunjukkan investasi pasif lebih dari 5%.
The share price as of September 5, 2025 is 79.88 / share. Previously, on September 6, 2024, the share price was 73.70 / share. This represents an increase of 8.38% over that period.

Skor Sentimen Dana
Skor Sentimen Dana (sebelumnya dikenal sebagai Skor Akumulasi Kepemilikan) menemukan saham-saham yang paling banyak dibeli oleh dana. Ini adalah hasil dari model kuantitatif multi-faktor yang canggih yang mengidentifikasi perusahaan dengan tingkat akumulasi institusional tertinggi. Model penilaian menggunakan kombinasi dari total peningkatan pemilik yang diungkapkan, perubahan dalam alokasi portofolio pada pemilik tersebut, dan metrik lainnya. Angka berkisar dari 0 hingga 100, dengan angka yang lebih tinggi menunjukkan tingkat akumulasi yang lebih tinggi dibandingkan dengan perusahaan sejenisnya, dan 50 adalah rata-ratanya.
Frekuensi Pembaruan: Setiap Hari
Lihat Ownership Explorer, yang menyediakan daftar perusahaan dengan peringkat tertinggi.
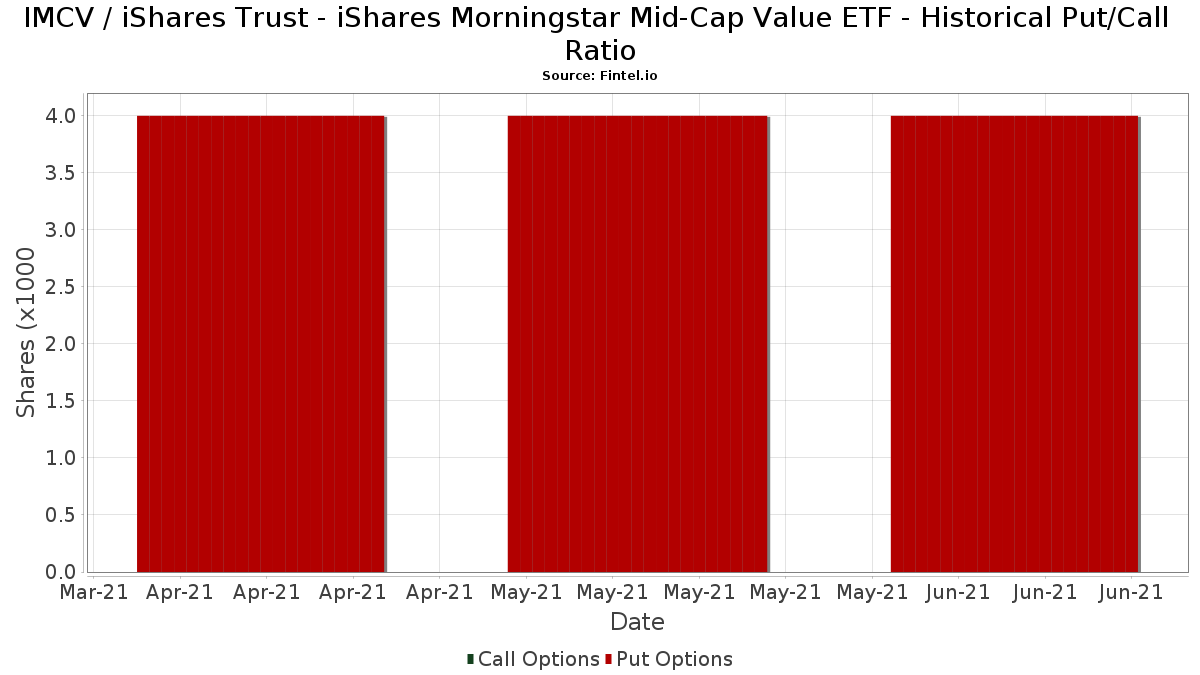
Rasio Put/Call Institusional
Selain melaporkan isu ekuitas dan utang standar, institusi dengan aset di bawah manajemen lebih dari 100 juta dolar AS juga harus mengungkapkan kepemilikan opsi put dan call mereka. Karena opsi put umumnya menunjukkan sentimen negatif, dan opsi call menunjukkan sentimen positif, kita dapat mengetahui sentimen institusional secara keseluruhan dengan memplot rasio put terhadap call. Grafik di sebelah kanan memplot rasio put/call historis untuk instrumen ini.
Menggunakan Rasio Put/Call sebagai indikator sentimen investor mengatasi salah satu kekurangan utama dari penggunaan total kepemilikan institusional, yaitu sejumlah besar aset yang dikelola diinvestasikan secara pasif untuk melacak indeks. Dana yang dikelola secara pasif biasanya tidak membeli opsi, sehingga indikator rasio put/call lebih akurat dalam melacak sentimen dana yang dikelola secara aktif.
Pengajuan 13F dan NPORT
Detail pada pengajuan 13F tersedia gratis. Detail pada pengajuan NP memerlukan keanggotaan premium. Baris berwarna hijau menunjukkan posisi baru. Baris berwarna merah menunjukkan posisi yang sudah ditutup. Klik tautan ini ikon untuk melihat riwayat transaksi selengkapnya.
Tingkatkan
untuk membuka data premium dan mengekspor ke Excel ![]() .
.
| Tanggal File | Sumber | Investor | Ketik | Presyo ng Avg (Silangan) |
Saham | Δ Saham (%) |
Dilaporkan Nilai ($1000) |
Nilai Δ (%) |
Alokasi Port (%) |
|
|---|---|---|---|---|---|---|---|---|---|---|
| 2025-08-14 | 13F | Diversify Advisory Services, LLC | 16,776 | 10.05 | 1,308 | 19.67 | ||||
| 2025-08-04 | 13F | Creative Financial Designs Inc /adv | 154 | 0.65 | 12 | 0.00 | ||||
| 2025-05-05 | 13F | IFP Advisors, Inc | 0 | -100.00 | 0 | |||||
| 2025-07-11 | 13F | Pinnacle Bancorp, Inc. | 56 | 4 | ||||||
| 2025-08-11 | 13F | Citigroup Inc | 9,252 | 70.17 | 703 | 74.19 | ||||
| 2025-07-17 | 13F | Oakworth Capital, Inc. | 3,430 | 0.00 | 261 | 2.36 | ||||
| 2025-08-11 | 13F | Principal Securities, Inc. | 20,007 | 3,337.63 | 1,520 | 3,434.88 | ||||
| 2025-07-16 | 13F | New Insight Wealth Advisors | 3,392 | 0.00 | 258 | 2.39 | ||||
| 2025-08-12 | 13F | LPL Financial LLC | 218,922 | 28.72 | 16,634 | 31.82 | ||||
| 2025-08-14 | 13F | Operose Advisors LLC | 642 | 0.00 | 49 | 2.13 | ||||
| 2025-08-08 | 13F | Cetera Investment Advisers | 47,852 | 115.99 | 3,636 | 121.24 | ||||
| 2025-08-13 | 13F | Jones Financial Companies Lllp | 4,293 | 42.25 | 324 | 46.61 | ||||
| 2025-08-14 | 13F | UBS Group AG | 103,060 | 0.70 | 7,830 | 3.12 | ||||
| 2025-07-15 | 13F | Revisor Wealth Management LLC | 3,428 | -4.46 | 267 | 0.38 | ||||
| 2025-07-30 | 13F | Retirement Planning Group | 16,780 | -6.61 | 1,275 | -4.35 | ||||
| 2025-07-31 | 13F | Cambridge Investment Research Advisors, Inc. | 43,890 | 554.78 | 3 | |||||
| 2025-08-14 | 13F | Ancora Advisors, LLC | 66 | 0.00 | 5 | 25.00 | ||||
| 2025-07-30 | 13F | Black Diamond Financial, LLC | 110,769 | -12.17 | 8,416 | -10.05 | ||||
| 2025-07-22 | 13F | Marietta Wealth Management, LLC | 81,441 | 6.12 | 6,188 | 8.68 | ||||
| 2025-08-04 | 13F | Jim Saulnier & Associates, Llc | 26,375 | -5.88 | 2,004 | -3.61 | ||||
| 2025-08-14 | 13F | Stifel Financial Corp | 43,502 | 0.92 | 3,305 | 3.35 | ||||
| 2025-07-22 | 13F | Red Tortoise LLC | 2 | 0.00 | 0 | |||||
| 2025-07-08 | 13F | Parallel Advisors, LLC | 4,850 | 36.62 | 369 | 39.92 | ||||
| 2025-07-17 | 13F | Sound Income Strategies, LLC | 54 | 0.00 | 4 | 0.00 | ||||
| 2025-08-19 | 13F | Cape Investment Advisory, Inc. | 4,258 | 0.02 | 324 | 2.54 | ||||
| 2025-08-14 | 13F | First Manhattan Co | 7,438 | 0.00 | 565 | 2.54 | ||||
| 2025-08-11 | 13F | HighTower Advisors, LLC | 3,586 | 272 | ||||||
| 2025-08-01 | 13F | Gwn Securities Inc. | 4,092 | 11.77 | 312 | 14.76 | ||||
| 2025-07-21 | 13F | Ameritas Advisory Services, LLC | 768 | 58 | ||||||
| 2025-07-30 | 13F | D.a. Davidson & Co. | 3,197 | 243 | ||||||
| 2025-08-13 | 13F | Summit Financial, LLC | 3,028 | 0.50 | 230 | 3.14 | ||||
| 2025-08-13 | 13F | Level Four Advisory Services, Llc | 12,367 | 0.01 | 940 | 2.40 | ||||
| 2025-07-15 | 13F | James J. Burns & Company, LLC | 20,510 | 235.19 | 1,558 | 243.93 | ||||
| 2025-08-12 | 13F | Proequities, Inc. | 0 | 0 | ||||||
| 2025-08-14 | 13F | Guardian Wealth Advisors, Llc / Nc | 1,208 | -14.27 | 92 | -12.50 | ||||
| 2025-08-14 | 13F | Raymond James Financial Inc | 395,910 | 18.20 | 30,081 | 21.06 | ||||
| 2025-08-11 | 13F | Western Wealth Management, LLC | 2,801 | 0.04 | 213 | 2.42 | ||||
| 2025-08-13 | 13F | Jackson Creek Investment Advisors LLC | 9,460 | 1.21 | 1 | |||||
| 2025-08-14 | 13F | Colony Group, LLC | 24,892 | -19.50 | 1,891 | -17.57 | ||||
| 2025-07-25 | 13F | Courage Miller Partners, LLC | 20,296 | -1.36 | 1,542 | 1.05 | ||||
| 2025-08-14 | 13F | Vivaldi Capital Management, LLC | 26,647 | 18.00 | 2,025 | 20.84 | ||||
| 2025-08-08 | 13F | Pnc Financial Services Group, Inc. | 573 | -13.44 | 44 | -12.24 | ||||
| 2025-08-14 | 13F | Integrated Wealth Concepts LLC | 6,427 | 11.23 | 488 | 14.02 | ||||
| 2025-08-14 | 13F | Smartleaf Asset Management LLC | 2,317 | 18.82 | 175 | 23.24 | ||||
| 2025-08-14 | 13F | Clark Capital Management Group, Inc. | 90,046 | 6,842 | ||||||
| 2025-08-08 | 13F | Emerald Investment Partners, Llc | 36 | 3 | ||||||
| 2025-08-06 | 13F | Commonwealth Equity Services, Llc | 270,105 | 33.06 | 21 | 33.33 | ||||
| 2025-07-09 | 13F | Burt Wealth Advisors | 27,722 | 91.45 | 2,106 | 96.09 | ||||
| 2025-08-05 | 13F | Huntington National Bank | 0 | -100.00 | ||||||
| 2025-07-14 | 13F | Park Avenue Securities Llc | 13,272 | 1 | ||||||
| 2025-07-30 | 13F | Caliber Wealth Management, LLC / KS | 25,541 | -0.24 | 1,941 | 2.16 | ||||
| 2025-07-14 | 13F | Armstrong Advisory Group, Inc | 0 | -100.00 | 0 | |||||
| 2025-08-07 | 13F | Summit Asset Management, LLC | 4,216 | -5.81 | 320 | -3.61 | ||||
| 2025-08-08 | 13F | Islay Capital Management, Llc | 30 | 0.00 | 2 | 0.00 | ||||
| 2025-07-17 | 13F | Gleason Group, Inc. | 266 | 0.76 | 20 | 5.26 | ||||
| 2025-07-21 | 13F | Crews Bank & Trust | 305 | 0.00 | 23 | 4.55 | ||||
| 2025-08-05 | 13F | Bank Of Montreal /can/ | 3,221 | 0.66 | 245 | 2.95 | ||||
| 2025-08-14 | 13F | Royal Bank Of Canada | 92,623 | 146.97 | 7,038 | 152.89 | ||||
| 2025-08-12 | 13F | Global Retirement Partners, LLC | 2,286 | 4,133.33 | 174 | 4,225.00 | ||||
| 2025-08-12 | 13F | Archer Investment Corp | 103 | 24.10 | 8 | 16.67 | ||||
| 2025-08-13 | 13F | Russell Investments Group, Ltd. | 71 | 0.00 | 5 | 0.00 | ||||
| 2025-08-15 | 13F | Equitable Holdings, Inc. | 390,168 | -1.65 | 29,645 | 0.72 | ||||
| 2025-08-04 | 13F | Flagship Harbor Advisors, Llc | 7,021 | 4.51 | 533 | 7.03 | ||||
| 2025-07-29 | 13F | Private Trust Co Na | 832 | 16.69 | 63 | 21.15 | ||||
| 2025-04-29 | 13F | Hm Payson & Co | 500 | -27.01 | 37 | -26.00 | ||||
| 2025-08-15 | 13F | Morgan Stanley | 679,807 | -5.22 | 51,652 | -2.94 | ||||
| 2025-08-12 | 13F | Jpmorgan Chase & Co | 18,151 | 95.87 | 1,379 | 100.73 | ||||
| 2025-08-14 | 13F | Financial Advisory Service, Inc. | 0 | -100.00 | 0 | |||||
| 2025-07-30 | 13F | Pacific Sun Financial Corp | 8,130 | -6.23 | 618 | -4.04 | ||||
| 2025-07-10 | 13F | Orgel Wealth Management, LLC | 359,977 | 5.71 | 27,351 | 8.27 | ||||
| 2025-07-24 | 13F | Us Bancorp \de\ | 505 | 0.00 | 38 | 2.70 | ||||
| 2025-08-08 | 13F | Creative Planning | 6,442 | 0.61 | 489 | 2.95 | ||||
| 2025-08-11 | 13F | Hopwood Financial Services, Inc. | 960 | 0.00 | 73 | 1.41 | ||||
| 2025-07-08 | 13F | Zrc Wealth Management, Llc | 254 | 0.79 | 19 | 5.56 | ||||
| 2025-08-14 | 13F | Comerica Bank | 13,501 | 1.06 | 1,026 | 3.43 | ||||
| 2025-07-14 | 13F | LaFleur & Godfrey LLC | 8,456 | 0.67 | 642 | 3.05 | ||||
| 2025-08-14 | 13F | Bank Of America Corp /de/ | 219,604 | 6.63 | 16,686 | 9.20 | ||||
| 2025-08-05 | 13F | GHP Investment Advisors, Inc. | 83,380 | -0.11 | 6,335 | 2.31 | ||||
| 2025-07-10 | 13F | Wealth Enhancement Advisory Services, Llc | 16,662 | -6.89 | 1,296 | -2.34 | ||||
| 2025-07-14 | 13F | Matrix Trust Co | 201,752 | 1.63 | 15 | 7.14 | ||||
| 2025-07-22 | 13F | Sage Financial Group Inc | 6,780 | -5.98 | 515 | -3.56 | ||||
| 2025-07-23 | 13F | Prime Capital Investment Advisors, LLC | 5,304 | 0.00 | 403 | 2.29 | ||||
| 2025-08-11 | 13F | Cornerstone Planning Group LLC | 15 | 1 | ||||||
| 2025-08-14 | 13F | Jane Street Group, Llc | 0 | -100.00 | 0 | |||||
| 2025-07-29 | 13F | Rodgers & Associates, LTD | 100,912 | 7.15 | 7,667 | 9.73 | ||||
| 2025-08-06 | 13F | Savant Capital, LLC | 5,592 | 2.57 | 425 | 4.95 | ||||
| 2025-07-28 | 13F | Harbour Investments, Inc. | 15 | 0.00 | 1 | 0.00 | ||||
| 2025-08-01 | 13F | Trust Investment Advisors | 2,795 | 0.18 | 212 | 2.91 | ||||
| 2025-07-29 | 13F | Madison Wealth Partners, Inc | 8,616 | 9.15 | 655 | 11.79 | ||||
| 2025-08-14 | 13F | Mml Investors Services, Llc | 42,420 | 25.51 | 3 | 50.00 | ||||
| 2025-07-29 | 13F | Woodard & Co Asset Management Group Inc /adv | 5,652 | -28.11 | 429 | -26.42 | ||||
| 2025-08-14 | 13F | Mariner, LLC | 58,333 | 4.63 | 4,432 | 7.16 | ||||
| 2025-08-15 | 13F | Tower Research Capital LLC (TRC) | 0 | -100.00 | 0 | |||||
| 2025-07-09 | 13F | Dynamic Advisor Solutions LLC | 25,742 | 1,956 | ||||||
| 2025-07-15 | 13F | MCF Advisors LLC | 300 | 0.00 | 23 | 0.00 | ||||
| 2025-08-11 | 13F | Aptus Capital Advisors, LLC | 1,208 | -14.27 | 92 | -12.50 | ||||
| 2025-08-06 | 13F | First Horizon Advisors, Inc. | 217 | 16 | ||||||
| 2025-07-22 | 13F | Merit Financial Group, LLC | 27,450 | 12.34 | 2,086 | 15.07 | ||||
| 2025-08-26 | NP | EQ ADVISORS TRUST - EQ/Mid Cap Value Managed Volatility Portfolio Class IB | 353,811 | -2.05 | 26,883 | 0.31 | ||||
| 2025-07-17 | 13F | Janney Montgomery Scott LLC | 5,370 | 0.00 | 0 | |||||
| 2025-07-25 | 13F | Cwm, Llc | 3,837 | -25.78 | 0 | |||||
| 2025-08-05 | 13F | Plante Moran Financial Advisors, LLC | 3,453 | 0.00 | 262 | 2.34 | ||||
| 2025-08-14 | 13F | McIlrath & Eck, LLC | 540 | 0.00 | 41 | 2.50 | ||||
| 2025-08-14 | 13F | Silvercrest Asset Management Group Llc | 2,706 | 0.00 | 206 | 2.50 | ||||
| 2025-08-13 | 13F | Cresset Asset Management, LLC | 2,745 | 0.00 | 209 | 2.46 | ||||
| 2025-08-14 | 13F | Lebenthal Global Advisors, LLC | 55,748 | 0.66 | 4,236 | 3.09 | ||||
| 2025-08-07 | 13F | Kestra Private Wealth Services, Llc | 3,796 | -15.10 | 288 | -12.99 | ||||
| 2025-08-12 | 13F | Bedel Financial Consulting, Inc. | 75,666 | 1.15 | 5,749 | 6.76 | ||||
| 2025-08-14 | 13F | Citadel Advisors Llc | 0 | -100.00 | 0 | |||||
| 2025-07-30 | 13F | Bogart Wealth, LLC | 464 | 0.22 | 35 | 2.94 | ||||
| 2025-08-12 | 13F | Trivant Custom Portfolio Group, LLC | 5,687 | 13.72 | 432 | 16.44 | ||||
| 2025-07-10 | 13F | Sovran Advisors, LLC | 24,024 | 1,858 | ||||||
| 2025-08-06 | 13F | AE Wealth Management LLC | 0 | -100.00 | 0 | |||||
| 2025-08-05 | 13F | swisspartners Advisors Ltd | 111,620 | 3.25 | 8,471 | 19.43 | ||||
| 2025-08-12 | 13F | O'shaughnessy Asset Management, Llc | 439 | 0.00 | 33 | 3.13 | ||||
| 2025-08-13 | 13F | Northwestern Mutual Wealth Management Co | 50,321 | -1.68 | 3,823 | 0.68 | ||||
| 2025-07-14 | 13F | AdvisorNet Financial, Inc | 155 | 0.00 | 12 | 0.00 | ||||
| 2025-07-22 | 13F | Steele Capital Management, Inc. | 201,752 | 1.63 | 15,329 | 4.09 | ||||
| 2025-08-06 | 13F | DDFG, Inc | 31,915 | 6.26 | 2,425 | 8.80 | ||||
| 2025-08-08 | 13F | TD Capital Management LLC | 202 | 0.50 | 15 | 7.14 | ||||
| 2025-07-17 | 13F | Beacon Capital Management, LLC | 1,404 | 0.00 | 107 | 1.92 | ||||
| 2025-08-08 | 13F | Avantax Advisory Services, Inc. | 60,956 | 4.77 | 4,631 | 7.30 | ||||
| 2025-08-12 | 13F | Ameritas Investment Partners, Inc. | 115 | 0.00 | 9 | 0.00 | ||||
| 2025-08-15 | 13F | Kestra Advisory Services, LLC | 7,562 | 37.72 | 575 | 41.03 | ||||
| 2025-08-01 | 13F | Envestnet Asset Management Inc | 123,020 | 335.19 | 9,347 | 345.73 | ||||
| 2025-08-14 | 13F | GWM Advisors LLC | 945 | 0.53 | 72 | 2.90 | ||||
| 2025-08-14 | 13F | Wells Fargo & Company/mn | 212,788 | 27.26 | 16,168 | 30.33 | ||||
| 2025-08-01 | 13F | Transcend Wealth Collective, Llc | 2,803 | 0.00 | 213 | 2.42 | ||||
| 2025-08-07 | 13F | Cahill Financial Advisors Inc | 4,325 | 0.58 | 329 | 3.14 | ||||
| 2025-08-14 | 13F | Ameriprise Financial Inc | 66,651 | 1.94 | 5,068 | 4.32 | ||||
| 2025-08-12 | 13F | WealthTrak Capital Management LLC | 4,104 | 2.47 | 312 | 4.71 | ||||
| 2025-07-14 | 13F | Signature Securities Group Corporation | 23,119 | -15.61 | 1,757 | -13.58 | ||||
| 2025-08-05 | 13F | Tiaa Trust, National Association | 3,098 | 0.00 | 235 | 2.62 | ||||
| 2025-08-12 | 13F | Steward Partners Investment Advisory, Llc | 13 | 0.00 | 1 | |||||
| 2025-07-29 | 13F | Aire Advisors, Llc | 40,696 | 9.20 | 3,092 | 11.87 | ||||
| 2025-07-29 | 13F | Salomon & Ludwin, LLC | 162 | 0.00 | 13 | 0.00 | ||||
| 2025-07-25 | 13F | Atria Wealth Solutions, Inc. | 25,407 | -6.20 | 1,930 | -3.93 | ||||
| 2025-08-04 | 13F | Assetmark, Inc | 482 | 20.20 | 37 | 24.14 | ||||
| 2025-08-13 | 13F | Baird Financial Group, Inc. | 17,237 | 21.14 | 1,310 | 24.08 | ||||
| 2025-08-14 | 13F | Quantinno Capital Management LP | 0 | -100.00 | 0 | |||||
| 2025-07-21 | 13F | Ameriflex Group, Inc. | 417 | 0.00 | 31 | 3.33 | ||||
| 2025-08-15 | 13F | Captrust Financial Advisors | 12,311 | -10.60 | 935 | -8.42 | ||||
| 2025-08-18 | 13F | Geneos Wealth Management Inc. | 5,394 | 98.60 | 410 | 103.48 | ||||
| 2025-08-08 | 13F | Bouchey Financial Group Ltd | 2,808 | 0.00 | 213 | 2.40 | ||||
| 2025-08-14 | 13F | EP Wealth Advisors, Inc. | 43,166 | 0.00 | 3,280 | 2.40 | ||||
| 2025-08-12 | 13F | J.w. Cole Advisors, Inc. | 5,656 | 430 | ||||||
| 2025-08-14 | 13F | Susquehanna International Group, Llp | 7,643 | -78.00 | 581 | -77.49 | ||||
| 2025-08-08 | 13F | Altfest L J & Co Inc | 3,601 | -50.87 | 274 | -49.72 | ||||
| 2025-07-08 | 13F | Nbc Securities, Inc. | 300 | 0.00 | 0 | |||||
| 2025-08-01 | 13F | PCA Investment Advisory Services Inc. | 13,988 | 0.16 | 1,063 | 2.51 | ||||
| 2025-08-18 | 13F | N.E.W. Advisory Services LLC | 0 | -100.00 | 0 | |||||
| 2025-08-13 | 13F | M&t Bank Corp | 13,727 | -3.74 | 1,043 | -1.42 | ||||
| 2025-08-13 | 13F | Willis Johnson & Associates, Inc. | 4,529 | 0.00 | 344 | 2.38 | ||||
| 2025-08-15 | 13F | CI Private Wealth, LLC | 18,300 | -3.93 | 1,390 | -1.63 | ||||
| 2025-07-29 | NP | EBI - Longview Advantage ETF | 0 | -100.00 | 0 | -100.00 | ||||
| 2025-09-04 | 13F/A | Advisor Group Holdings, Inc. | 218,051 | 4.97 | 16,567 | 7.49 | ||||
| 2025-08-13 | 13F | Millstone Evans Group, LLC | 38,783 | -3.07 | 2,947 | -0.74 | ||||
| 2025-07-22 | 13F | DAVENPORT & Co LLC | 52,522 | 78.58 | 3,991 | 82.94 | ||||
| 2025-08-11 | 13F | Private Advisor Group, LLC | 4,984 | 379 | ||||||
| 2025-08-06 | 13F | Ipsen Advisor Group LLC | 82,303 | 2.75 | 6,253 | 5.23 | ||||
| 2025-07-30 | 13F | Atlantic Edge Private Wealth Management, LLC | 0 | -100.00 | 0 | |||||
| 2025-08-04 | 13F | Clear Investment Research, Llc | 2,012 | 0.20 | 153 | 2.01 | ||||
| 2025-08-12 | 13F | BlackRock, Inc. | 1,500 | 0.00 | 114 | 1.80 | ||||
| 2025-07-25 | 13F | LRI Investments, LLC | 22,656 | 0.00 | 1,721 | 2.44 | ||||
| 2025-07-09 | 13F | Beacon Financial Group | 2,836 | 0.18 | 215 | 2.38 | ||||
| 2025-07-24 | 13F | rebel Financial LLC | 4,342 | 330 | ||||||
| 2025-08-14 | 13F | Fmr Llc | 3,405 | -15.26 | 259 | -13.42 | ||||
| 2025-07-29 | 13F | Gladwyn Financial Advisors, Inc. | 72 | 5 | ||||||
| 2025-08-07 | 13F | Parkside Financial Bank & Trust | 510 | 0.00 | 39 | 2.70 |