Mga Batayang Estadistika
| Pemilik Institusional | 147 total, 147 long only, 0 short only, 0 long/short - change of 4.96% MRQ |
| Alokasi Portofolio Rata-rata | 0.2479 % - change of -18.61% MRQ |
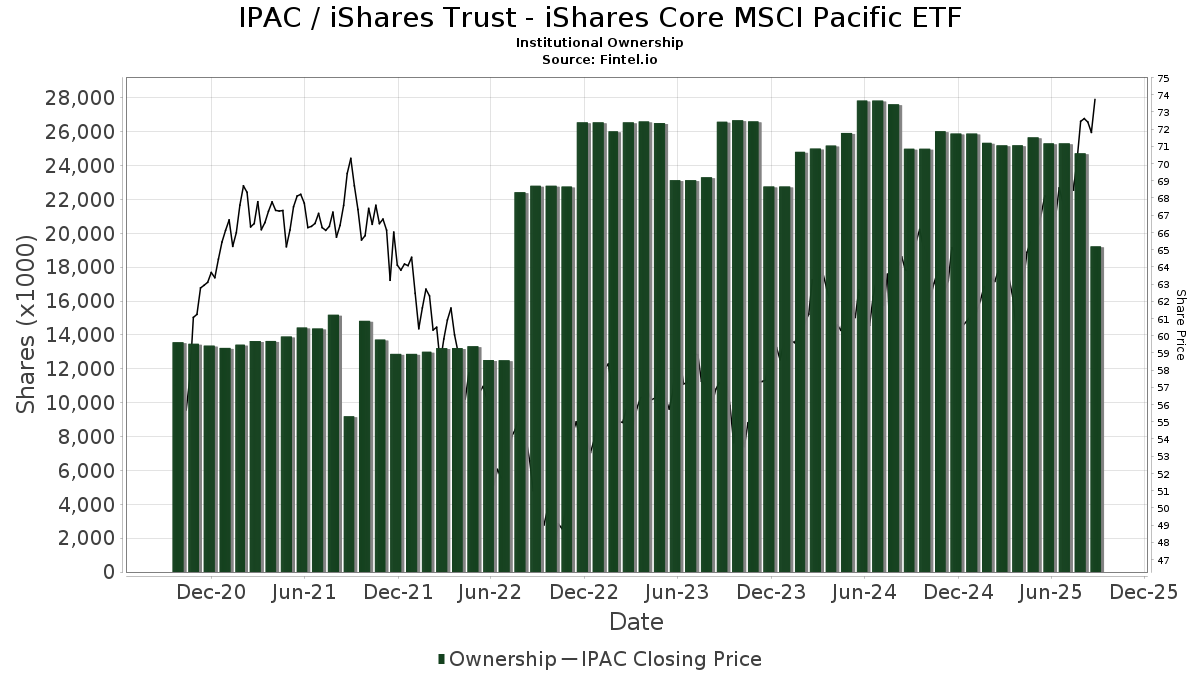
| Saham Institusional (Jangka Panjang) | 19,228,538 (ex 13D/G) - change of -6.08MM shares -24.03% MRQ |
| Nilai Institusional (Jangka Panjang) | $ 1,267,233 USD ($1000) |
Kepemilikan Institusional dan Pemegang Saham
iShares Trust - iShares Core MSCI Pacific ETF (US:IPAC) memiliki 147 pemilik institusional dan pemegang saham yang telah mengajukan formulir 13D/G atau 13F kepada Komisi Bursa Efek (Securities Exchange Commission/SEC). Lembaga-lembaga ini memegang total 19,228,538 saham. Pemegang saham terbesar meliputi Ronald Blue Trust, Inc., Jpmorgan Chase & Co, Assetmark, Inc, Charles Schwab Investment Management Inc, Morgan Stanley, Mather Group, Llc., Envestnet Asset Management Inc, Stifel Financial Corp, Elm Partners Management LLC, and Cetera Investment Advisers .
Struktur kepemilikan institusional iShares Trust - iShares Core MSCI Pacific ETF (ARCA:IPAC) menunjukkan posisi terkini di perusahaan oleh institusi dan dana, serta perubahan terbaru dalam ukuran posisi. Pemegang saham utama dapat mencakup investor individu, reksa dana, dana lindung nilai, atau institusi. Jadwal 13D menunjukkan bahwa investor memegang (atau pernah memegang) lebih dari 5% saham perusahaan dan bermaksud (atau pernah bermaksud) untuk secara aktif mengejar perubahan strategi bisnis. Jadwal 13G menunjukkan investasi pasif lebih dari 5%.
The share price as of September 5, 2025 is 72.79 / share. Previously, on September 9, 2024, the share price was 63.53 / share. This represents an increase of 14.58% over that period.
Skor Sentimen Dana
Skor Sentimen Dana (sebelumnya dikenal sebagai Skor Akumulasi Kepemilikan) menemukan saham-saham yang paling banyak dibeli oleh dana. Ini adalah hasil dari model kuantitatif multi-faktor yang canggih yang mengidentifikasi perusahaan dengan tingkat akumulasi institusional tertinggi. Model penilaian menggunakan kombinasi dari total peningkatan pemilik yang diungkapkan, perubahan dalam alokasi portofolio pada pemilik tersebut, dan metrik lainnya. Angka berkisar dari 0 hingga 100, dengan angka yang lebih tinggi menunjukkan tingkat akumulasi yang lebih tinggi dibandingkan dengan perusahaan sejenisnya, dan 50 adalah rata-ratanya.
Frekuensi Pembaruan: Setiap Hari
Lihat Ownership Explorer, yang menyediakan daftar perusahaan dengan peringkat tertinggi.
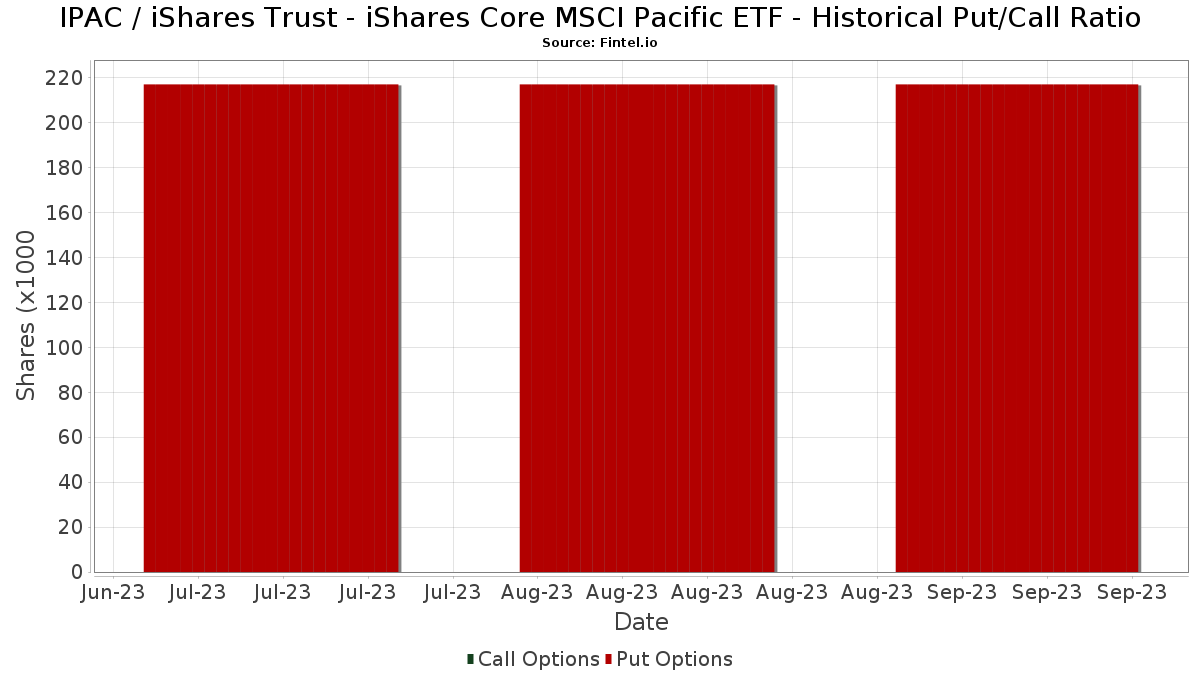
Rasio Put/Call Institusional
Selain melaporkan isu ekuitas dan utang standar, institusi dengan aset di bawah manajemen lebih dari 100 juta dolar AS juga harus mengungkapkan kepemilikan opsi put dan call mereka. Karena opsi put umumnya menunjukkan sentimen negatif, dan opsi call menunjukkan sentimen positif, kita dapat mengetahui sentimen institusional secara keseluruhan dengan memplot rasio put terhadap call. Grafik di sebelah kanan memplot rasio put/call historis untuk instrumen ini.
Menggunakan Rasio Put/Call sebagai indikator sentimen investor mengatasi salah satu kekurangan utama dari penggunaan total kepemilikan institusional, yaitu sejumlah besar aset yang dikelola diinvestasikan secara pasif untuk melacak indeks. Dana yang dikelola secara pasif biasanya tidak membeli opsi, sehingga indikator rasio put/call lebih akurat dalam melacak sentimen dana yang dikelola secara aktif.
Pengajuan 13F dan NPORT
Detail pada pengajuan 13F tersedia gratis. Detail pada pengajuan NP memerlukan keanggotaan premium. Baris berwarna hijau menunjukkan posisi baru. Baris berwarna merah menunjukkan posisi yang sudah ditutup. Klik tautan ini ikon untuk melihat riwayat transaksi selengkapnya.
Tingkatkan
untuk membuka data premium dan mengekspor ke Excel ![]() .
.
| Tanggal File | Sumber | Investor | Ketik | Presyo ng Avg (Silangan) |
Saham | Δ Saham (%) |
Dilaporkan Nilai ($1000) |
Nilai Δ (%) |
Alokasi Port (%) |
|
|---|---|---|---|---|---|---|---|---|---|---|
| 2025-08-14 | 13F | Quantinno Capital Management LP | 18,392 | 1,264 | ||||||
| 2025-07-24 | 13F | Robertson Stephens Wealth Management, LLC | 39,972 | -13.33 | 2,746 | -4.32 | ||||
| 2025-08-08 | 13F | Avantax Advisory Services, Inc. | 3,998 | -26.11 | 275 | -18.45 | ||||
| 2025-07-08 | 13F | Lowe Wealth Advisors, LLC | 2,325 | 0.00 | 160 | 10.42 | ||||
| 2025-08-06 | 13F | Hoxton Planning & Management, LLC | 3,050 | 210 | ||||||
| 2025-05-01 | 13F | Bleakley Financial Group, LLC | 0 | -100.00 | 0 | -100.00 | ||||
| 2025-07-10 | 13F | Global Financial Private Client, LLC | 17,315 | 0.41 | 1,190 | 10.81 | ||||
| 2025-07-02 | 13F | Central Pacific Bank - Trust Division | 9 | 0.00 | 1 | |||||
| 2025-07-16 | 13F | Perigon Wealth Management, LLC | 28,158 | 1,934 | ||||||
| 2025-07-30 | 13F | Bogart Wealth, LLC | 710 | 0.00 | 49 | 9.09 | ||||
| 2025-07-30 | 13F | Rehmann Capital Advisory Group | 6,089 | 0.00 | 418 | 10.58 | ||||
| 2025-04-30 | 13F | Sofos Investments, Inc. | 56,255 | 9.77 | 3,501 | 11.71 | ||||
| 2025-08-14 | 13F | Royal Bank Of Canada | 26,625 | -47.21 | 1,829 | -41.71 | ||||
| 2025-05-09 | 13F | GeoWealth Management, LLC | 0 | -100.00 | 0 | |||||
| 2025-07-29 | 13F | Yoffe Investment Management, LLC | 9,221 | 0.25 | 633 | 10.66 | ||||
| 2025-07-10 | 13F | Wedmont Private Capital | 0 | -100.00 | 0 | |||||
| 2025-07-15 | 13F | Mather Group, Llc. | 653,467 | 8.97 | 44,893 | 20.28 | ||||
| 2025-08-13 | 13F | Invesco Ltd. | 0 | -100.00 | 0 | |||||
| 2025-07-10 | 13F | Security National Bank | 2,080 | 143 | ||||||
| 2025-07-09 | 13F | VisionPoint Advisory Group, LLC | 8,494 | 584 | ||||||
| 2025-08-25 | 13F/A | Promus Capital, LLC | 214 | -33.33 | 15 | -26.32 | ||||
| 2025-07-18 | 13F | Tanager Wealth Management LLP | 10,635 | 731 | ||||||
| 2025-08-15 | 13F | Tower Research Capital LLC (TRC) | 0 | -100.00 | 0 | |||||
| 2025-07-09 | 13F | Sapient Capital Llc | 8,317 | 571 | ||||||
| 2025-07-24 | 13F | Blair William & Co/il | 139 | 10 | ||||||
| 2025-08-14 | 13F | GWM Advisors LLC | 5,410 | -0.92 | 372 | 9.44 | ||||
| 2025-07-16 | 13F | John W. Brooker & Co., CPAs | 0 | -100.00 | 0 | |||||
| 2025-08-04 | 13F | Municipal Employees' Retirement System of Michigan | 0 | -100.00 | 0 | |||||
| 2025-07-28 | 13F | Harbour Investments, Inc. | 21 | 0.00 | 1 | 0.00 | ||||
| 2025-07-08 | 13F | Nbc Securities, Inc. | 349 | 0.00 | 0 | |||||
| 2025-08-12 | 13F | Proequities, Inc. | 0 | 0 | ||||||
| 2025-07-11 | 13F | Mandatum Life Insurance Co Ltd | 155,637 | 24.06 | 10,692 | 36.94 | ||||
| 2025-07-24 | 13F | Ronald Blue Trust, Inc. | 6,996,027 | -3.37 | 480,627 | 6.66 | ||||
| 2025-07-31 | 13F | GenTrust, LLC | 137,140 | -2.23 | 9,422 | 7.93 | ||||
| 2025-07-23 | 13F | Family Legacy, Inc. | 24,220 | 1.59 | 1,664 | 12.14 | ||||
| 2025-08-12 | 13F | BlackRock, Inc. | 205 | 0.00 | 14 | 16.67 | ||||
| 2025-08-05 | 13F | Elm Partners Management LLC | 476,862 | 24.89 | 32,760 | 37.86 | ||||
| 2025-08-12 | 13F | Howe & Rusling Inc | 0 | -100.00 | 0 | -100.00 | ||||
| 2025-08-14 | 13F | Qube Research & Technologies Ltd | 0 | -100.00 | 0 | |||||
| 2025-08-08 | 13F | Compass Wealth Management LLC | 2,961 | -3.27 | 203 | 6.84 | ||||
| 2025-08-14 | 13F | Cardiff Park Advisors, Llc | 1,291 | 0.00 | 89 | 10.00 | ||||
| 2025-07-25 | 13F | Cwm, Llc | 33,730 | 2,558.00 | 2 | |||||
| 2025-08-07 | 13F | Resources Investment Advisors, LLC. | 4,974 | 0.48 | 342 | 10.71 | ||||
| 2025-08-08 | 13F | Creative Planning | 54,251 | -3.60 | 3,727 | 6.42 | ||||
| 2025-08-11 | 13F | United Capital Financial Advisers, Llc | 83,749 | -6.14 | 5,754 | 3.60 | ||||
| 2025-08-08 | 13F | ERTS Wealth Advisors, LLC | 135,449 | -38.78 | 9,305 | -32.43 | ||||
| 2025-08-14 | 13F | Raymond James Financial Inc | 6,076 | 1.57 | 417 | 12.10 | ||||
| 2025-08-15 | 13F | Morgan Stanley | 882,289 | 0.37 | 60,613 | 10.79 | ||||
| 2025-08-07 | 13F | Allworth Financial LP | 3,998 | 0.00 | 275 | 7.45 | ||||
| 2025-08-12 | 13F | Charles Schwab Investment Management Inc | 965,523 | -3.54 | 66,331 | 6.47 | ||||
| 2025-07-31 | 13F | CVA Family Office, LLC | 1,085 | 0.00 | 75 | 10.45 | ||||
| 2025-08-07 | 13F | Addison Advisors LLC | 2,690 | 0.00 | 185 | 10.18 | ||||
| 2025-07-31 | 13F | Wealthfront Advisers Llc | 0 | -100.00 | 0 | |||||
| 2025-07-10 | 13F | Redhawk Wealth Advisors, Inc. | 0 | -100.00 | 0 | |||||
| 2025-08-04 | 13F | Savvy Advisors, Inc. | 3,336 | 229 | ||||||
| 2025-08-19 | 13F | Delos Wealth Advisors, LLC | 10 | 1 | ||||||
| 2025-08-06 | 13F | Legacy Investment Solutions, LLC | 43 | 0.00 | 3 | 0.00 | ||||
| 2025-08-14 | 13F | Mml Investors Services, Llc | 3,900 | 18.47 | 0 | |||||
| 2025-08-08 | 13F | Pnc Financial Services Group, Inc. | 31 | -24.39 | 2 | 0.00 | ||||
| 2025-08-12 | 13F | CIBC Private Wealth Group, LLC | 973 | 13.80 | 67 | 40.43 | ||||
| 2025-05-15 | 13F | Mercer Global Advisors Inc /adv | 0 | -100.00 | 0 | |||||
| 2025-08-08 | 13F | Financial Gravity Companies, Inc. | 59,306 | 16.37 | 4,074 | 30.87 | ||||
| 2025-08-12 | 13F | Atlas Capital Advisors Llc | 27,968 | -13.96 | 1,921 | -5.04 | ||||
| 2025-07-08 | 13F/A | Salem Investment Counselors Inc | 301 | 0.00 | 21 | 11.11 | ||||
| 2025-08-05 | 13F | Harel Insurance Investments & Financial Services Ltd. | 5,434 | 0.00 | 0 | |||||
| 2025-05-09 | 13F | TD Waterhouse Canada Inc. | 0 | -100.00 | 0 | |||||
| 2025-08-11 | 13F | Private Advisor Group, LLC | 4,098 | 282 | ||||||
| 2025-08-06 | 13F | Walkner Condon Financial Advisors LLC | 4,772 | 0.91 | 328 | 11.22 | ||||
| 2025-08-12 | 13F | MAI Capital Management | 2,223 | 0.00 | 153 | 10.14 | ||||
| 2025-08-05 | 13F | Dunhill Financial, LLC | 194 | 13 | ||||||
| 2025-07-21 | 13F | Greenwood Capital Associates Llc | 163,950 | 4.53 | 11,263 | 15.39 | ||||
| 2025-08-14 | 13F | Integrated Wealth Concepts LLC | 3,732 | 2.70 | 256 | 13.27 | ||||
| 2025-08-06 | 13F | Legacy Wealth Managment, LLC/ID | 43 | 0.00 | 3 | 0.00 | ||||
| 2025-05-02 | 13F | Signaturefd, Llc | 0 | -100.00 | 0 | |||||
| 2025-04-04 | 13F | Quent Capital, LLC | 0 | -100.00 | 0 | |||||
| 2025-08-15 | 13F | Captrust Financial Advisors | 4,164 | 0.87 | 286 | 11.72 | ||||
| 2025-08-12 | 13F | Steward Partners Investment Advisory, Llc | 376 | 14.98 | 26 | 25.00 | ||||
| 2025-07-24 | 13F | Williams & Novak, LLC | 10,765 | -12.23 | 740 | -3.15 | ||||
| 2025-08-14 | 13F | Susquehanna International Group, Llp | 75,291 | 234.42 | 5,172 | 269.16 | ||||
| 2025-08-14 | 13F | IHT Wealth Management, LLC | 3,613 | 248 | ||||||
| 2025-08-11 | 13F | Strategic Wealth Partners, Ltd. | 1,484 | 102 | ||||||
| 2025-05-14 | 13F | Capital Analysts, Inc. | 0 | -100.00 | 0 | |||||
| 2025-08-20 | 13F/A | Coppell Advisory Solutions LLC | 6,428 | 442 | ||||||
| 2025-08-01 | 13F | Envestnet Asset Management Inc | 603,458 | -5.69 | 41,453 | 4.09 | ||||
| 2025-07-22 | 13F | Coastal Investment Advisors, Inc. | 4 | 0.00 | 0 | |||||
| 2025-08-13 | 13F | EverSource Wealth Advisors, LLC | 6 | 0.00 | 0 | |||||
| 2025-07-21 | 13F | Mirae Asset Global Investments Co., Ltd. | 7,730 | 6.47 | 531 | 16.70 | ||||
| 2025-07-24 | 13F | JNBA Financial Advisors | 0 | -100.00 | 0 | |||||
| 2025-07-23 | 13F | Vontobel Holding Ltd. | 20,403 | 1.57 | 1,402 | 12.08 | ||||
| 2025-08-14 | 13F | UBS Group AG | 89,476 | -6.53 | 6,147 | 3.19 | ||||
| 2025-07-24 | 13F | Stonebridge Financial Group, LLC | 0 | -100.00 | 0 | |||||
| 2025-08-08 | 13F | Cetera Investment Advisers | 399,916 | -10.49 | 27,474 | -1.20 | ||||
| 2025-07-23 | 13F | Prime Capital Investment Advisors, LLC | 71,965 | -1.06 | 4,944 | 9.19 | ||||
| 2025-08-14 | 13F | Comerica Bank | 916 | 0.00 | 63 | 8.77 | ||||
| 2025-07-23 | 13F | Integris Wealth Management, LLC | 79,110 | -1.05 | 5,435 | 9.20 | ||||
| 2025-08-12 | 13F | Jpmorgan Chase & Co | 1,823,056 | 61.26 | 125,244 | 78.00 | ||||
| 2025-04-22 | 13F/A | NorthRock Partners, LLC | 0 | -100.00 | 0 | -100.00 | ||||
| 2025-05-09 | 13F | Atria Wealth Solutions, Inc. | 0 | -100.00 | 0 | |||||
| 2025-08-04 | 13F | B&l Asset Management Llc | 8,750 | 601 | ||||||
| 2025-08-28 | NP | ELM - Elm Market Navigator ETF | 293,528 | 11.04 | 20,165 | 22.57 | ||||
| 2025-08-04 | 13F | AlphaStar Capital Management, LLC | 175,984 | 0.86 | 12,090 | 11.34 | ||||
| 2025-08-12 | 13F | LPL Financial LLC | 93,974 | 7.34 | 6,456 | 18.50 | ||||
| 2025-07-25 | 13F | Inman Jager Wealth Management, LLC | 14,139 | -3.85 | 971 | 6.12 | ||||
| 2025-07-22 | 13F | Belpointe Asset Management LLC | 4,739 | -3.13 | 326 | 6.91 | ||||
| 2025-08-05 | 13F | Bank Of Montreal /can/ | 482 | -15.44 | 33 | -5.71 | ||||
| 2025-08-15 | 13F | CI Private Wealth, LLC | 9,644 | -1.03 | 663 | 9.24 | ||||
| 2025-08-07 | 13F | FDx Advisors, Inc. | 48,948 | -5.47 | 3 | 0.00 | ||||
| 2025-08-14 | 13F | Vident Advisory, LLC | 140,242 | 2.67 | 9,635 | 13.31 | ||||
| 2025-07-22 | 13F | Iron Horse Wealth Management, LLC | 340 | 19.72 | 23 | 35.29 | ||||
| 2025-08-15 | 13F | Blue Edge Capital, LLC | 120,729 | 0.01 | 8,294 | 10.40 | ||||
| 2025-07-17 | 13F | Guyasuta Investment Advisors Inc | 4,077 | 0.00 | 280 | 10.67 | ||||
| 2025-07-03 | 13F | Garde Capital, Inc. | 142,939 | 0.64 | 9,820 | 11.09 | ||||
| 2025-07-07 | 13F | Kings Path Partners LLC | 586 | -47.58 | 40 | -42.03 | ||||
| 2025-08-14 | 13F | Vista Private Wealth Partners. LLC | 37,724 | 7.60 | 2,592 | 18.74 | ||||
| 2025-08-14 | 13F | Ameriprise Financial Inc | 6,284 | -6.64 | 432 | 3.11 | ||||
| 2025-07-29 | 13F | APCM Wealth Management for Individuals | 3,014 | 207 | ||||||
| 2025-08-11 | 13F | HighTower Advisors, LLC | 13,670 | 7.63 | 939 | 18.86 | ||||
| 2025-08-13 | 13F | Millington Financial Advisors, LLC | 26,822 | -8.28 | 1,886 | 7.53 | ||||
| 2025-08-04 | 13F | Assetmark, Inc | 989,465 | -10.59 | 67,976 | -1.31 | ||||
| 2025-08-13 | 13F | Allie Family Office LLC | 3,167 | 0.00 | 218 | 3.33 | ||||
| 2025-08-06 | 13F | AE Wealth Management LLC | 570 | 216.67 | 39 | 254.55 | ||||
| 2025-08-14 | 13F | Fmr Llc | 7,556 | -2.39 | 519 | 7.90 | ||||
| 2025-08-14 | 13F | Wells Fargo & Company/mn | 138,231 | 15.03 | 9,496 | 26.97 | ||||
| 2025-08-08 | 13F | Gts Securities Llc | 10,241 | 704 | ||||||
| 2025-08-11 | 13F | PAX Financial Group, LLC | 26,661 | -15.13 | 1,832 | -6.34 | ||||
| 2025-08-14 | 13F | Citadel Advisors Llc | 313,669 | 1,532.08 | 21,549 | 1,701.76 | ||||
| 2025-08-06 | 13F | Csenge Advisory Group | 9,073 | -3.46 | 612 | 5.15 | ||||
| 2025-07-31 | 13F | Cambridge Investment Research Advisors, Inc. | 8,558 | 24.79 | 1 | |||||
| 2025-07-25 | 13F | Richardson Financial Services Inc. | 19,560 | -9.31 | 1,339 | -0.30 | ||||
| 2025-08-05 | 13F | Mission Wealth Management, Lp | 3,650 | 0.00 | 251 | 10.13 | ||||
| 2025-08-14 | 13F | Lazard Asset Management Llc | 94,159 | -19.32 | 6 | -14.29 | ||||
| 2025-07-29 | 13F | Koshinski Asset Management, Inc. | 2,998 | 206 | ||||||
| 2025-07-15 | 13F | LVZ Advisors, Inc. | 0 | -100.00 | 0 | |||||
| 2025-05-01 | 13F | Ballentine Partners, LLC | 0 | -100.00 | 0 | |||||
| 2025-07-24 | 13F | Brandywine Oak Private Wealth Llc | 9,446 | 0.00 | 649 | 10.39 | ||||
| 2025-09-04 | 13F/A | Advisor Group Holdings, Inc. | 196,038 | 116.28 | 12,724 | 125.51 | ||||
| 2025-07-25 | 13F | Presilium Private Wealth, Llc | 28,112 | -45.32 | 1,931 | -39.66 | ||||
| 2025-04-16 | 13F | Wealth Enhancement Advisory Services, Llc | 0 | -100.00 | 0 | |||||
| 2025-07-30 | 13F | TFB Advisors LLC | 3,094 | -5.38 | 213 | 4.43 | ||||
| 2025-08-13 | 13F | Northwestern Mutual Wealth Management Co | 2,056 | 34.47 | 141 | 48.42 | ||||
| 2025-07-14 | 13F | Southland Equity Partners LLC | 4,223 | -0.66 | 290 | 9.85 | ||||
| 2025-08-11 | 13F | Principal Securities, Inc. | 0 | -100.00 | 0 | |||||
| 2025-07-18 | 13F | Truist Financial Corp | 40,441 | -0.94 | 2,778 | 9.37 | ||||
| 2025-08-12 | 13F | AlphaCore Capital LLC | 195 | 0.00 | 13 | 8.33 | ||||
| 2025-07-31 | 13F | Brian Low Financial Group, Llc | 4,724 | 325 | ||||||
| 2025-08-11 | 13F | Aptus Capital Advisors, LLC | 56 | 5.66 | 4 | 0.00 | ||||
| 2025-08-06 | 13F | Commonwealth Equity Services, Llc | 12,264 | -15.26 | 1 | |||||
| 2025-08-13 | 13F | Willis Johnson & Associates, Inc. | 34,776 | -4.92 | 2,389 | 4.96 | ||||
| 2025-08-15 | 13F | Keel Point, LLC | 3,122 | 214 | ||||||
| 2025-08-14 | 13F | Bank Of America Corp /de/ | 232,501 | -27.57 | 15,973 | -20.06 | ||||
| 2025-08-14 | 13F | CoreCap Advisors, LLC | 16 | 0.00 | 1 | |||||
| 2025-07-23 | 13F | BankPlus Trust Department | 38 | 0.00 | 3 | 0.00 | ||||
| 2025-07-11 | 13F | Farther Finance Advisors, LLC | 4,679 | -5.30 | 321 | 4.56 | ||||
| 2025-07-23 | 13F | Godsey & Gibb Associates | 0 | -100.00 | 0 | |||||
| 2025-07-24 | 13F | Us Bancorp \de\ | 8,030 | 0.51 | 552 | 10.87 | ||||
| 2025-07-18 | 13F | Dogwood Wealth Management LLC | 31,748 | -9.17 | 2,145 | -1.38 | ||||
| 2025-08-08 | 13F | Smithfield Trust Co | 352,399 | 12.00 | 24 | 26.32 | ||||
| 2025-05-12 | 13F | Aveo Capital Partners, LLC | 0 | -100.00 | 0 | |||||
| 2025-07-23 | 13F | Columbus Macro, LLC | 88,990 | -26.47 | 6,114 | -18.85 | ||||
| 2025-08-14 | 13F | Jane Street Group, Llc | 0 | -100.00 | 0 | |||||
| 2025-08-13 | 13F | Northern Trust Corp | 10,565 | 0.00 | 726 | 10.35 | ||||
| 2025-08-14 | 13F | Stifel Financial Corp | 549,389 | 2.05 | 37,743 | 12.65 | ||||
| 2025-07-21 | 13F | Fortis Capital Advisors, LLC | 4,739 | -3.01 | 326 | 6.91 | ||||
| 2025-08-13 | 13F | Jones Financial Companies Lllp | 1,213 | 16.97 | 83 | 27.69 | ||||
| 2025-08-14 | 13F | Modern Wealth Management, LLC | 3,021 | 208 | ||||||
| 2025-08-01 | 13F | Bessemer Group Inc | 206,182 | 22.26 | 14 | 40.00 | ||||
| 2025-08-12 | 13F | O'shaughnessy Asset Management, Llc | 594 | 4,142.86 | 41 | |||||
| 2025-08-08 | 13F | Capital Investment Advisory Services, LLC | 1,646 | -5.78 | 113 | 4.63 | ||||
| 2025-07-23 | 13F | Element Wealth, LLC | 8,878 | -7.16 | 610 | 2.35 | ||||
| 2025-08-12 | 13F | Pathstone Holdings, LLC | 3,930 | 0.00 | 270 | 10.25 | ||||
| 2025-08-12 | 13F | Global Retirement Partners, LLC | 236 | -7.45 | 16 | 6.67 | ||||
| 2025-04-24 | 13F | Wingate Wealth Advisors, Inc. | 0 | -100.00 | 0 | |||||
| 2025-08-11 | 13F | Edgemoor Investment Advisors, Inc. | 5,310 | 0.00 | 365 | 10.30 | ||||
| 2025-08-13 | 13F | Amundi | 87,887 | -9.65 | 6,027 | 2.90 | ||||
| 2025-05-15 | 13F | Oxford Financial Group Ltd | 0 | -100.00 | 0 | |||||
| 2025-08-06 | 13F | Hallmark Capital Management Inc | 158,671 | -3.71 | 10,901 | 6.28 | ||||
| 2025-07-25 | 13F | Concurrent Investment Advisors, LLC | 7,279 | 500 | ||||||
| 2025-08-14 | 13F | Hrt Financial Lp | 0 | -100.00 | 0 |
Other Listings
| MX:IPAC |