Mga Batayang Estadistika
| Pemilik Institusional | 231 total, 230 long only, 0 short only, 1 long/short - change of 7.94% MRQ |
| Alokasi Portofolio Rata-rata | 0.7283 % - change of -9.09% MRQ |
| Saham Institusional (Jangka Panjang) | 61,856,294 (ex 13D/G) - change of 3.90MM shares 6.74% MRQ |
| Nilai Institusional (Jangka Panjang) | $ 3,821,083 USD ($1000) |
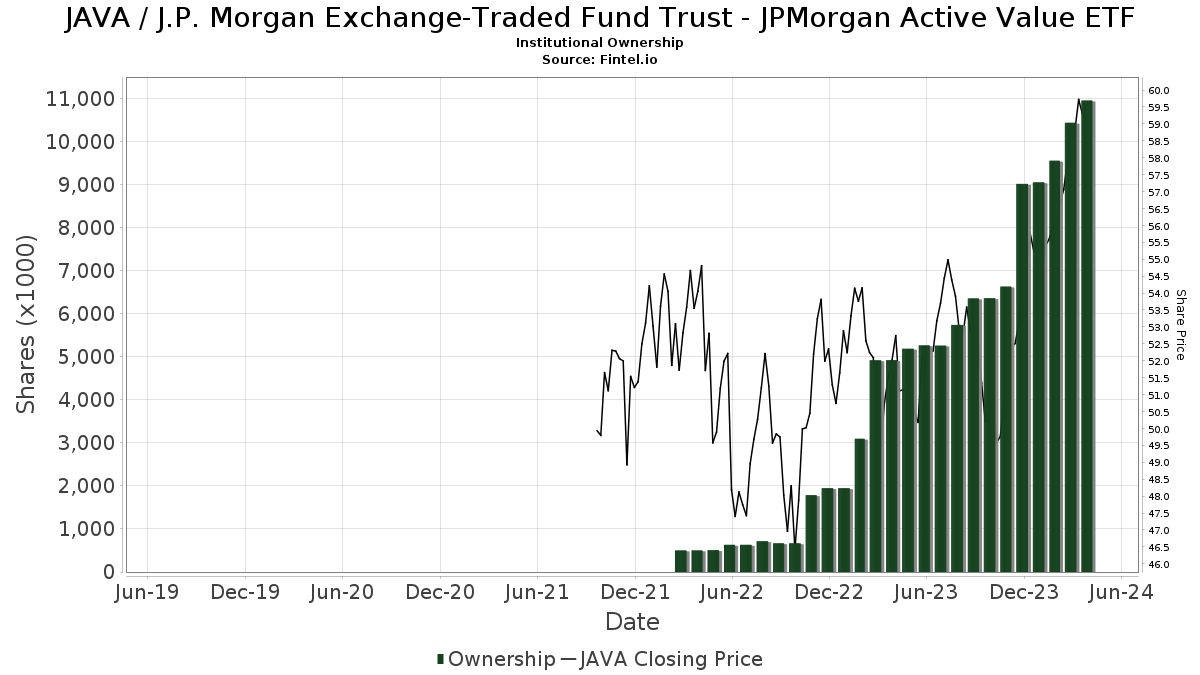
Kepemilikan Institusional dan Pemegang Saham
J.P. Morgan Exchange-Traded Fund Trust - JPMorgan Active Value ETF (US:JAVA) memiliki 231 pemilik institusional dan pemegang saham yang telah mengajukan formulir 13D/G atau 13F kepada Komisi Bursa Efek (Securities Exchange Commission/SEC). Lembaga-lembaga ini memegang total 61,856,294 saham. Pemegang saham terbesar meliputi Jpmorgan Chase & Co, LPL Financial LLC, Sagespring Wealth Partners, Llc, Dynasty Wealth Management, Llc, ADVANCED SERIES TRUST - AST T. Rowe Price Growth Opportunities Portfolio, Advanced Series Trust - Ast J.p. Morgan Strategic Opportunities Portfolio, Ameriprise Financial Inc, ADVANCED SERIES TRUST - AST J.P. Morgan Global Thematic Portfolio, Morgan Stanley, and Janney Montgomery Scott LLC .
Struktur kepemilikan institusional J.P. Morgan Exchange-Traded Fund Trust - JPMorgan Active Value ETF (ARCA:JAVA) menunjukkan posisi terkini di perusahaan oleh institusi dan dana, serta perubahan terbaru dalam ukuran posisi. Pemegang saham utama dapat mencakup investor individu, reksa dana, dana lindung nilai, atau institusi. Jadwal 13D menunjukkan bahwa investor memegang (atau pernah memegang) lebih dari 5% saham perusahaan dan bermaksud (atau pernah bermaksud) untuk secara aktif mengejar perubahan strategi bisnis. Jadwal 13G menunjukkan investasi pasif lebih dari 5%.
The share price as of September 5, 2025 is 68.06 / share. Previously, on September 6, 2024, the share price was 61.34 / share. This represents an increase of 10.96% over that period.
Skor Sentimen Dana
Skor Sentimen Dana (sebelumnya dikenal sebagai Skor Akumulasi Kepemilikan) menemukan saham-saham yang paling banyak dibeli oleh dana. Ini adalah hasil dari model kuantitatif multi-faktor yang canggih yang mengidentifikasi perusahaan dengan tingkat akumulasi institusional tertinggi. Model penilaian menggunakan kombinasi dari total peningkatan pemilik yang diungkapkan, perubahan dalam alokasi portofolio pada pemilik tersebut, dan metrik lainnya. Angka berkisar dari 0 hingga 100, dengan angka yang lebih tinggi menunjukkan tingkat akumulasi yang lebih tinggi dibandingkan dengan perusahaan sejenisnya, dan 50 adalah rata-ratanya.
Frekuensi Pembaruan: Setiap Hari
Lihat Ownership Explorer, yang menyediakan daftar perusahaan dengan peringkat tertinggi.
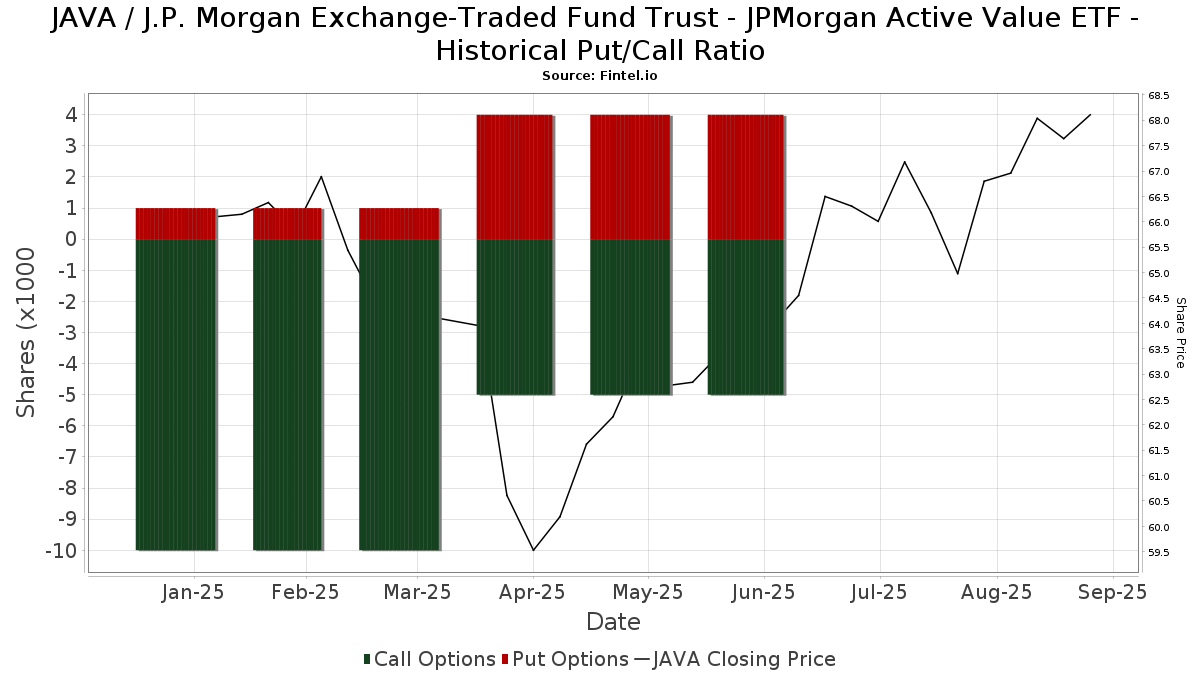
Rasio Put/Call Institusional
Selain melaporkan isu ekuitas dan utang standar, institusi dengan aset di bawah manajemen lebih dari 100 juta dolar AS juga harus mengungkapkan kepemilikan opsi put dan call mereka. Karena opsi put umumnya menunjukkan sentimen negatif, dan opsi call menunjukkan sentimen positif, kita dapat mengetahui sentimen institusional secara keseluruhan dengan memplot rasio put terhadap call. Grafik di sebelah kanan memplot rasio put/call historis untuk instrumen ini.
Menggunakan Rasio Put/Call sebagai indikator sentimen investor mengatasi salah satu kekurangan utama dari penggunaan total kepemilikan institusional, yaitu sejumlah besar aset yang dikelola diinvestasikan secara pasif untuk melacak indeks. Dana yang dikelola secara pasif biasanya tidak membeli opsi, sehingga indikator rasio put/call lebih akurat dalam melacak sentimen dana yang dikelola secara aktif.
Pengajuan 13F dan NPORT
Detail pada pengajuan 13F tersedia gratis. Detail pada pengajuan NP memerlukan keanggotaan premium. Baris berwarna hijau menunjukkan posisi baru. Baris berwarna merah menunjukkan posisi yang sudah ditutup. Klik tautan ini ikon untuk melihat riwayat transaksi selengkapnya.
Tingkatkan
untuk membuka data premium dan mengekspor ke Excel ![]() .
.
| Tanggal File | Sumber | Investor | Ketik | Presyo ng Avg (Silangan) |
Saham | Δ Saham (%) |
Dilaporkan Nilai ($1000) |
Nilai Δ (%) |
Alokasi Port (%) |
|
|---|---|---|---|---|---|---|---|---|---|---|
| 2025-07-21 | 13F | Fairvoy Private Wealth, LLC | 10,169 | -1.32 | 666 | 1.83 | ||||
| 2025-07-25 | 13F | M.e. Allison & Co., Inc. | 10,365 | -1.44 | 679 | 1.50 | ||||
| 2025-08-11 | 13F | Principal Securities, Inc. | 921 | 145.60 | 60 | 160.87 | ||||
| 2025-08-13 | 13F | Gateway Wealth Partners, LLC | 6,716 | -29.51 | 440 | -27.44 | ||||
| 2025-08-14 | 13F | Benjamin Edwards Inc | 83,618 | 317.26 | 5,477 | 330.24 | ||||
| 2025-08-08 | 13F | Good Life Advisors, LLC | 11,601 | -7.23 | 760 | -4.41 | ||||
| 2025-07-31 | 13F | MN Wealth Advisors, LLC | 119,706 | -3.23 | 7,841 | -0.25 | ||||
| 2025-07-17 | 13F | Worth Financial Advisory Group, LLC | 9,465 | 5.99 | 620 | 9.17 | ||||
| 2025-08-11 | 13F | Private Advisor Group, LLC | 183,071 | 23.33 | 11,991 | 27.14 | ||||
| 2025-08-12 | 13F | Wayfinding Financial, LLC | 16,312 | -3.04 | 1 | 0.00 | ||||
| 2025-08-04 | 13F | Spire Wealth Management | 384 | 7.26 | 25 | 13.64 | ||||
| 2025-07-17 | 13F | Sound Income Strategies, LLC | 63 | 0.00 | 4 | 0.00 | ||||
| 2025-07-14 | 13F | Farmers & Merchants Investments Inc | 239 | 0.00 | 16 | 0.00 | ||||
| 2025-08-13 | 13F | Custom Index Systems, Llc | 7,598 | -5.47 | 498 | -2.55 | ||||
| 2025-05-13 | 13F | Quadrant Capital Group Llc | 0 | -100.00 | 0 | |||||
| 2025-08-29 | 13F | Total Investment Management Inc | 607 | 40 | ||||||
| 2025-07-28 | 13F | Mutual Advisors, LLC | 10,371 | -5.53 | 695 | 3.89 | ||||
| 2025-08-04 | 13F | IFG Advisory, LLC | 15,048 | 20.45 | 986 | 24.21 | ||||
| 2025-07-22 | 13F | DAVENPORT & Co LLC | 88,564 | 6.81 | 5,801 | 10.10 | ||||
| 2025-08-11 | 13F | Landaas & Co /wi /adv | 18,068 | 313.64 | 1,183 | 325.54 | ||||
| 2025-08-12 | 13F | Jpmorgan Chase & Co | 13,865,481 | 3.24 | 908,189 | 6.42 | ||||
| 2025-07-14 | 13F | CRA Financial Services, LLC | 4,061 | 21.73 | 266 | 25.59 | ||||
| 2025-08-11 | 13F | Synergy Investment Management, LLC | 0 | -100.00 | 0 | |||||
| 2025-07-31 | 13F | Oppenheimer & Co Inc | 6,568 | 27.07 | 430 | 31.10 | ||||
| 2025-08-05 | 13F | BCGM Wealth Management, LLC | 149,549 | 10.39 | 9,795 | 13.80 | ||||
| 2025-08-14 | 13F | Atomi Financial Group, Inc. | 23,982 | 1,571 | ||||||
| 2025-08-14 | 13F | Synovus Financial Corp | 44,414 | 28.37 | 2,911 | 32.39 | ||||
| 2025-07-31 | 13F | Gill Capital Partners, Llc | 129,507 | 14.64 | 8,483 | 18.18 | ||||
| 2025-07-22 | 13F | Miracle Mile Advisors, LLC | 98,789 | 6,471 | ||||||
| 2025-07-23 | 13F | Country Club Bank /gfn | 35,173 | 8.26 | 2,299 | 12.31 | ||||
| 2025-07-15 | 13F | Avaii Wealth Management, Llc | 6,214 | -50.19 | 407 | -48.61 | ||||
| 2025-04-11 | 13F | Principia Wealth Advisory, LLC | 0 | -100.00 | 0 | -100.00 | ||||
| 2025-08-14 | 13F | Heritage Wealth Management, Inc. | 25,358 | 41.36 | 1,661 | 45.74 | ||||
| 2025-08-05 | 13F | GPS Wealth Strategies Group, LLC | 6,422 | 0.12 | 421 | 3.19 | ||||
| 2025-08-07 | 13F | Weil Company, Inc. | 146,126 | 128.72 | 9,571 | 135.80 | ||||
| 2025-08-12 | 13F | Resolute Wealth Strategies, LLC | 171,641 | 3.02 | 11,242 | 6.20 | ||||
| 2025-08-14 | 13F | Bank Of America Corp /de/ | 666,072 | 23.27 | 43,628 | 27.07 | ||||
| 2025-05-13 | 13F | SFI Advisors, LLC | 0 | -100.00 | 0 | |||||
| 2025-08-08 | 13F | Kingsview Wealth Management, LLC | 34,672 | 0.23 | 2,271 | 3.28 | ||||
| 2025-07-16 | 13F | Signaturefd, Llc | 140 | 0.00 | 9 | 12.50 | ||||
| 2025-07-17 | 13F | Clear Point Advisors Inc. | 8,736 | 0.37 | 572 | 3.44 | ||||
| 2025-07-22 | 13F | Siligmueller & Norvid Wealth Advisors LLC | 11,029 | 10.29 | 728 | 14.65 | ||||
| 2025-07-29 | 13F | Stratos Wealth Partners, LTD. | 6,860 | 1.57 | 449 | 4.66 | ||||
| 2025-08-13 | 13F | Cary Street Partners Financial Llc | 1,812 | 13.25 | 119 | 16.83 | ||||
| 2025-07-21 | 13F | Ascent Group, LLC | 21,450 | 4.67 | 1,405 | 7.83 | ||||
| 2025-07-30 | 13F | D.a. Davidson & Co. | 27,113 | -19.02 | 1,776 | -16.55 | ||||
| 2025-07-10 | 13F | Exchange Traded Concepts, Llc | 119,988 | 24.53 | 7,859 | 28.37 | ||||
| 2025-08-18 | 13F | Geneos Wealth Management Inc. | 3,564 | 20.81 | 233 | 24.60 | ||||
| 2025-07-10 | 13F | Triangle Securities Wealth Management | 240,257 | 0.97 | 15,737 | 4.08 | ||||
| 2025-08-14 | 13F | Qube Research & Technologies Ltd | 1,939 | 127 | ||||||
| 2025-07-02 | 13F | Crumly & Associates Inc. | 40,571 | -41.91 | 2,657 | -40.12 | ||||
| 2025-07-29 | 13F | Quotient Wealth Partners, LLC | 24,223 | 16.90 | 1,587 | 20.52 | ||||
| 2025-08-01 | 13F | Private Wealth Partners, LLC | 13,150 | 0.00 | 861 | 3.11 | ||||
| 2025-08-04 | 13F | Assetmark, Inc | 39 | -93.09 | 3 | -94.29 | ||||
| 2025-08-13 | 13F | Renaissance Technologies Llc | 3,800 | 249 | ||||||
| 2025-07-16 | 13F | Beaumont Financial Advisors, LLC | 16,606 | -0.95 | 1,088 | 2.07 | ||||
| 2025-08-12 | 13F | Gladstone Institutional Advisory LLC | 44,123 | 69.24 | 2,890 | 74.52 | ||||
| 2025-07-16 | 13F | Stephenson National Bank & Trust | 732,726 | 1.32 | 47,994 | 4.45 | ||||
| 2025-08-04 | 13F | Arkadios Wealth Advisors | 48,031 | 47.18 | 3,146 | 51.76 | ||||
| 2025-07-28 | 13F | Axxcess Wealth Management, Llc | 4,332 | 284 | ||||||
| 2025-07-25 | 13F | LRI Investments, LLC | 21,350 | 16.35 | 1,398 | 20.00 | ||||
| 2025-07-22 | 13F | Gemmer Asset Management LLC | 81,380 | 3.11 | 5,330 | 6.30 | ||||
| 2025-07-14 | 13F | Strategic Planning Group, Llc | 26,010 | -11.60 | 1,704 | -8.88 | ||||
| 2025-07-14 | 13F | AdvisorNet Financial, Inc | 6,713 | 10.23 | 440 | 13.73 | ||||
| 2025-08-05 | 13F | Simplex Trading, Llc | 175 | 0 | ||||||
| 2025-07-25 | 13F | Priebe Wealth Holdings LLC | 32,577 | -5.61 | 2,134 | -2.69 | ||||
| 2025-08-08 | 13F | Emerald Investment Partners, Llc | 159 | 0.00 | 10 | 0.00 | ||||
| 2025-08-12 | 13F | Change Path, LLC | 32,037 | -9.94 | 2,098 | -7.17 | ||||
| 2025-07-22 | 13F | Firethorn Wealth Partners, Llc | 7,871 | 9.52 | 516 | 12.94 | ||||
| 2025-07-09 | 13F | Massmutual Trust Co Fsb/adv | 25,229 | -8.87 | 1,652 | -6.08 | ||||
| 2025-08-05 | 13F | Huntington National Bank | 1 | 0.00 | 0 | |||||
| 2025-08-12 | 13F | Steward Partners Investment Advisory, Llc | 2,704 | -2.77 | 177 | 0.57 | ||||
| 2025-08-12 | 13F | Proequities, Inc. | 0 | 0 | ||||||
| 2025-08-13 | 13F | Capital Analysts, Inc. | 31,637 | 355.73 | 2 | |||||
| 2025-07-11 | 13F | SILVER OAK SECURITIES, Inc | 17,971 | -1.71 | 1,177 | 2.17 | ||||
| 2025-08-08 | 13F | Pnc Financial Services Group, Inc. | 1,030,558 | -0.19 | 67,502 | 2.89 | ||||
| 2025-08-14 | 13F | Stifel Financial Corp | 232,309 | 8.47 | 15,216 | 11.82 | ||||
| 2025-08-14 | 13F | Compass Wealth Management, LLC/GA | 74,815 | 4,900 | ||||||
| 2025-08-15 | 13F | Captrust Financial Advisors | 77,662 | -6.01 | 5,087 | -3.12 | ||||
| 2025-05-12 | 13F | Greenwich Wealth Management LLC | 0 | -100.00 | 0 | |||||
| 2025-07-16 | 13F | ORG Partners LLC | 17,585 | 1,166 | ||||||
| 2025-07-28 | 13F | Rosenberg Matthew Hamilton | 311 | -29.32 | 20 | -25.93 | ||||
| 2025-08-18 | 13F | Arq Wealth Advisors, Llc | 156,817 | 0.00 | 9,964 | 0.00 | ||||
| 2025-08-14 | 13F | Mml Investors Services, Llc | 77,973 | 9.42 | 5 | 25.00 | ||||
| 2025-08-14 | 13F | UBS Group AG | 744,703 | 1.92 | 48,778 | 5.06 | ||||
| 2025-07-25 | 13F | Commonwealth Financial Services, LLC | 112,198 | 8.67 | 7,349 | 12.01 | ||||
| 2025-07-08 | 13F | Parallel Advisors, LLC | 1,840 | 0.00 | 121 | 3.45 | ||||
| 2025-08-19 | 13F | Advisory Services Network, LLC | 11,205 | -13.73 | 736 | -10.91 | ||||
| 2025-08-08 | 13F | Fortis Group Advisors, LLC | 7,712 | 506 | ||||||
| 2025-08-07 | 13F | Resources Investment Advisors, LLC. | 9,389 | 0.37 | 615 | 3.37 | ||||
| 2025-09-04 | 13F/A | Advisor Group Holdings, Inc. | 470,924 | 8.94 | 30,855 | 12.30 | ||||
| 2025-08-13 | 13F | WCG Wealth Advisors LLC | 429,236 | 4.02 | 28,115 | 7.24 | ||||
| 2025-08-08 | 13F | Hartland & Co., LLC | 35 | 0.00 | 2 | 0.00 | ||||
| 2025-08-12 | 13F | O'shaughnessy Asset Management, Llc | 6,939 | 266.56 | 455 | 278.33 | ||||
| 2025-08-19 | 13F | National Asset Management, Inc. | 0 | -100.00 | 0 | |||||
| 2025-07-31 | 13F | Cambridge Investment Research Advisors, Inc. | 139,197 | 38.05 | 9 | 50.00 | ||||
| 2025-07-17 | 13F | Nelson, Van Denburg & Campbell Wealth Management Group, LLC | 1,061,689 | 4.70 | 69,541 | 7.93 | ||||
| 2025-07-22 | 13F | Unique Wealth, Llc | 200,067 | -7.47 | 13,104 | -4.61 | ||||
| 2025-08-14 | 13F | GWM Advisors LLC | 72,593 | 394.37 | 4,755 | 409.54 | ||||
| 2025-08-01 | 13F | Rossby Financial, LCC | 122 | 0.00 | 8 | 0.00 | ||||
| 2025-08-13 | 13F | Twin Peaks Wealth Advisors, LLC | 10,511 | 4.24 | 695 | 14.52 | ||||
| 2025-07-11 | 13F | Orrstown Financial Services Inc | 639,323 | 5.53 | 41,876 | 8.78 | ||||
| 2025-08-06 | 13F | Prospera Financial Services Inc | 4,682 | 31.52 | 307 | 35.84 | ||||
| 2025-08-05 | 13F | Westside Investment Management, Inc. | 4,631 | 0.00 | 307 | 4.78 | ||||
| 2025-08-05 | 13F | EPG Wealth Management LLC | 0 | -100.00 | 0 | |||||
| 2025-08-05 | 13F | Bank Of Montreal /can/ | 737 | 210.97 | 48 | 220.00 | ||||
| 2025-08-13 | 13F | MONECO Advisors, LLC | 8,967 | 0.58 | 587 | 3.71 | ||||
| 2025-07-23 | 13F | HMV Wealth Advisors, LLC | 0 | -100.00 | 0 | |||||
| 2025-08-06 | 13F | Commonwealth Equity Services, Llc | 1,025,317 | 6.12 | 67 | 9.84 | ||||
| 2025-08-07 | 13F | Nwam Llc | 4,541 | -15.42 | 301 | -12.02 | ||||
| 2025-05-12 | 13F | Aveo Capital Partners, LLC | 0 | -100.00 | 0 | |||||
| 2025-08-15 | 13F | Kestra Advisory Services, LLC | 542,816 | 15.41 | 35,554 | 18.97 | ||||
| 2025-07-25 | 13F | Northwest Capital Management Inc | 8,331 | -41.05 | 546 | -39.31 | ||||
| 2025-07-28 | 13F | WealthPlan Investment Management, LLC | 21,463 | 1,406 | ||||||
| 2025-07-17 | 13F | Albion Financial Group /ut | 4,850 | 0.00 | 318 | 2.92 | ||||
| 2025-08-04 | 13F | Daymark Wealth Partners, Llc | 348,530 | -4.95 | 22,829 | -2.02 | ||||
| 2025-07-25 | 13F | Bill Few Associates, Inc. | 6,949 | 455 | ||||||
| 2025-07-28 | 13F | Arlington Financial Advisors, LLC | 334,644 | 7.54 | 21,919 | 10.86 | ||||
| 2025-08-11 | 13F | Perennial Investment Advisors, LLC | 53,410 | 282.18 | 3,498 | 294.36 | ||||
| 2025-08-14 | 13F | Susquehanna International Group, Llp | 24,809 | -67.29 | 1,625 | -66.29 | ||||
| 2025-08-01 | 13F/A | GGM Financials LLC | 84,736 | -0.33 | 5,550 | 2.76 | ||||
| 2025-08-13 | 13F | Summit Wealth Group Llc / Co | 11,688 | 766 | ||||||
| 2025-08-14 | 13F | TCG Advisory Services, LLC | 7,881 | 516 | ||||||
| 2025-07-29 | 13F | Stephens Inc /ar/ | 6,260 | 0.00 | 410 | 3.27 | ||||
| 2025-07-24 | 13F | 3Chopt Investment Partners, LLC | 21,818 | -30.77 | 1,429 | -28.62 | ||||
| 2025-07-22 | 13F | Merit Financial Group, LLC | 7,990 | 523 | ||||||
| 2025-07-24 | 13F | Us Bancorp \de\ | 2,311 | 151 | ||||||
| 2025-07-21 | 13F | Ameriflex Group, Inc. | 315 | 0.32 | 21 | 5.26 | ||||
| 2025-07-15 | 13F | Centerline Wealth Advisors, LLC | 127,225 | 8,333 | ||||||
| 2025-07-25 | 13F | Envestnet Portfolio Solutions, Inc. | 0 | -100.00 | 0 | |||||
| 2025-07-17 | 13F | Janney Montgomery Scott LLC | 1,477,592 | 0.02 | 97 | 3.23 | ||||
| 2025-07-29 | 13F | Signature Estate & Investment Advisors Llc | 8,813 | 577 | ||||||
| 2025-08-08 | 13F/A | Ignite Planners, LLC | 9,311 | 11.26 | 617 | 19.38 | ||||
| 2025-08-14 | 13F | Integrated Wealth Concepts LLC | 6,886 | -93.21 | 451 | -93.00 | ||||
| 2025-08-11 | 13F | Aptus Capital Advisors, LLC | 1,546 | 6.92 | 101 | 10.99 | ||||
| 2025-04-29 | 13F | Financial Network Wealth Management LLC | 2,861 | 0 | ||||||
| 2025-08-12 | 13F | J.w. Cole Advisors, Inc. | 7,609 | -10.28 | 498 | -7.43 | ||||
| 2025-08-13 | 13F | Northwestern Mutual Wealth Management Co | 14,208 | 213.43 | 931 | 222.92 | ||||
| 2025-05-13 | 13F | Eaton Financial Holdings Company, LLC | 0 | -100.00 | 0 | |||||
| 2025-05-15 | 13F | Smith, Moore & Co. | 0 | -100.00 | 0 | |||||
| 2025-07-24 | 13F | Cyndeo Wealth Partners, LLC | 44,708 | -1.73 | 2,928 | 1.31 | ||||
| 2025-08-12 | 13F | Intellus Advisors LLC | 460,972 | 2.47 | 30,194 | 5.64 | ||||
| 2025-08-07 | 13F | Americana Partners, LLC | 537,843 | 1.20 | 35,229 | 4.32 | ||||
| 2025-07-29 | 13F | Independence Asset Advisors, LLC | 8,404 | 78.85 | 550 | 84.56 | ||||
| 2025-07-25 | 13F | Concurrent Investment Advisors, LLC | 35,495 | 534.18 | 2,325 | 554.65 | ||||
| 2025-07-16 | 13F | Perigon Wealth Management, LLC | 60,011 | 12.53 | 3,931 | 16.00 | ||||
| 2025-07-25 | 13F | Atria Wealth Solutions, Inc. | 29,469 | -11.48 | 1,931 | -8.70 | ||||
| 2025-08-08 | 13F | Keyvantage Wealth, Llc | 201,693 | 3.50 | 13,211 | 6.69 | ||||
| 2025-08-14 | 13F | Mariner, LLC | 24,096 | 31.33 | 1,578 | 35.45 | ||||
| 2025-07-22 | 13F | Sutton Place Investors Llc | 12,635 | -4.08 | 828 | -1.08 | ||||
| 2025-07-25 | 13F | NorthRock Partners, LLC | 0 | -100.00 | 0 | |||||
| 2025-08-05 | 13F | 5T Wealth, LLC | 43,752 | -11.01 | 2,866 | -8.26 | ||||
| 2025-07-23 | 13F | Clear Creek Financial Management, LLC | 13,369 | 2.22 | 876 | 5.29 | ||||
| 2025-08-11 | 13F | HighTower Advisors, LLC | 63,749 | 6.48 | 4,176 | 9.75 | ||||
| 2025-07-08 | 13F | Prism Advisors, Inc. | 221,610 | -4.96 | 14,515 | -2.03 | ||||
| 2025-07-25 | 13F | Apollon Wealth Management, LLC | 3,100 | 203 | ||||||
| 2025-07-30 | 13F | Wbh Advisory Inc | 20,812 | 1,363 | ||||||
| 2025-07-21 | 13F | Ameritas Advisory Services, LLC | 735 | 48 | ||||||
| 2025-08-14 | 13F | Vista Private Wealth Partners. LLC | 84,580 | 0.84 | 5,540 | 3.94 | ||||
| 2025-08-13 | 13F | Cary Street Partner Investment Advisory Llc | 7,903 | -12.63 | 518 | -9.93 | ||||
| 2025-07-23 | 13F | Litman Gregory Asset Management LLC | 11,385 | -12.40 | 746 | -9.70 | ||||
| 2025-07-11 | 13F | First PREMIER Bank | 4,718 | 0 | ||||||
| 2025-07-22 | 13F | PUREfi Wealth, LLC | 11,696 | 75.27 | 766 | 80.66 | ||||
| 2025-08-07 | 13F | Fagan Associates, Inc. | 53,807 | 5.60 | 3,524 | 8.87 | ||||
| 2025-07-11 | 13F | Pinnacle Bancorp, Inc. | 1,288 | 119.05 | 84 | 127.03 | ||||
| 2025-07-16 | 13F | Blue Oak Capital, LLC | 38,569 | -2.20 | 2,526 | 0.84 | ||||
| 2025-08-18 | 13F | Tyler-Stone Wealth Management | 184,536 | -6.13 | 12,087 | -3.23 | ||||
| 2025-07-07 | 13F | Thurston, Springer, Miller, Herd & Titak, Inc. | 25,877 | 1,921.64 | 1,695 | 1,991.36 | ||||
| 2025-08-14 | 13F | Visionary Wealth Advisors | 5,731 | -36.01 | 375 | -34.09 | ||||
| 2025-07-30 | 13F | LGT Financial Advisors LLC | 949 | -15.87 | 62 | -12.68 | ||||
| 2025-08-14 | 13F | Wells Fargo & Company/mn | 194,890 | 84.62 | 12,765 | 90.32 | ||||
| 2025-07-28 | 13F | Sagespring Wealth Partners, Llc | 3,069,729 | 9.48 | 201,067 | 12.86 | ||||
| 2025-08-06 | 13F | Convergence Financial, LLC | 330,056 | 5.59 | 21,619 | 8.85 | ||||
| 2025-07-17 | 13F | MBA Advisors LLC | 4,566 | -1.95 | 299 | 1.36 | ||||
| 2025-08-14 | 13F | Ameriprise Financial Inc | 2,449,480 | 13.26 | 160,457 | 16.77 | ||||
| 2025-07-18 | 13F | Centricity Wealth Management, LLC | 610 | 0.00 | 40 | 2.63 | ||||
| 2025-07-01 | 13F | Harbor Investment Advisory, Llc | 5,816 | 11.61 | 381 | 14.80 | ||||
| 2025-08-12 | 13F | Ci Investments Inc. | 426,368 | 12.15 | 28 | 12.50 | ||||
| 2025-07-28 | 13F | Harbour Investments, Inc. | 65,427 | 4.22 | 4,285 | 7.45 | ||||
| 2025-08-14 | 13F | Royal Bank Of Canada | 572,371 | 4.40 | 37,490 | 7.62 | ||||
| 2025-08-15 | 13F | Sugar Maple Asset Management, LLC | 26,357 | -3.33 | 1,726 | -0.35 | ||||
| 2025-07-22 | 13F | Belpointe Asset Management LLC | 9,197 | 6.90 | 602 | 10.26 | ||||
| 2025-08-06 | 13F | Nvwm, Llc | 8,003 | 0.00 | 524 | 3.15 | ||||
| 2025-08-06 | 13F | Summit Wealth & Retirement Planning, Inc. | 3,178 | 0.00 | 208 | 3.48 | ||||
| 2025-08-18 | 13F | N.E.W. Advisory Services LLC | 0 | -100.00 | 0 | |||||
| 2025-08-14 | 13F | Great Valley Advisor Group, Inc. | 689,583 | 21.47 | 45,168 | 25.21 | ||||
| 2025-08-14 | 13F | Comerica Bank | 5,675 | -6.46 | 372 | -3.64 | ||||
| 2025-08-05 | 13F | Strategic Financial Concepts, LLC | 0 | -100.00 | 0 | |||||
| 2025-08-08 | 13F | Creative Planning | 4,113 | 269 | ||||||
| 2025-08-11 | 13F | Citigroup Inc | 7,548 | 494 | ||||||
| 2025-08-27 | NP | Advanced Series Trust - Ast J.p. Morgan Strategic Opportunities Portfolio | 2,843,874 | 0.00 | 186,274 | 3.08 | ||||
| 2025-08-01 | 13F | Envestnet Asset Management Inc | 1,203,193 | 1.14 | 78,809 | 4.26 | ||||
| 2025-08-11 | 13F | Western Wealth Management, LLC | 37,959 | -0.32 | 2,486 | 2.77 | ||||
| 2025-08-05 | 13F | Fourth Dimension Wealth, LLC | 0 | -100.00 | 0 | |||||
| 2025-08-12 | 13F | LPL Financial LLC | 4,972,206 | 28.22 | 325,679 | 32.17 | ||||
| 2025-08-13 | 13F | Capital Advisors Wealth Management, LLC | 3,390 | -1.11 | 222 | 2.30 | ||||
| 2025-08-13 | 13F | Flow Traders U.s. Llc | 4,950 | 0 | ||||||
| 2025-08-13 | 13F | StoneX Group Inc. | 23,072 | 3.75 | 1,511 | 6.94 | ||||
| 2025-08-15 | 13F | Equitable Holdings, Inc. | 33,935 | -5.02 | 2,223 | -2.11 | ||||
| 2025-07-24 | 13F | Financial Connections Group, Inc. | 7,437 | -28.39 | 0 | |||||
| 2025-08-12 | 13F | Financial Advocates Investment Management | 45,433 | 2,976 | ||||||
| 2025-08-13 | 13F | Jones Financial Companies Lllp | 489,254 | 42.50 | 31,983 | 47.83 | ||||
| 2025-07-10 | 13F | Atticus Wealth Management, Llc | 2,207 | 145 | ||||||
| 2025-08-15 | 13F | Tower Research Capital LLC (TRC) | 7,841 | 514 | ||||||
| 2025-08-08 | 13F | Cetera Investment Advisers | 1,192,349 | 5.91 | 78,099 | 9.18 | ||||
| 2025-08-04 | 13F | WNY Asset Management, LLC | 399,217 | -8.82 | 26,149 | -6.01 | ||||
| 2025-07-24 | 13F | IFP Advisors, Inc | 18,664 | 74.84 | 1,223 | 80.24 | ||||
| 2025-07-18 | 13F | Bartlett & Co. Wealth Management Llc | 21 | 0.00 | 1 | 0.00 | ||||
| 2025-08-06 | 13F | AE Wealth Management LLC | 2,808 | 0.00 | 184 | 2.81 | ||||
| 2025-07-31 | 13F | Oak Harbor Wealth Partners, Llc | 5,106 | 27.81 | 334 | 32.02 | ||||
| 2025-08-13 | 13F | GeoWealth Management, LLC | 6,887 | 0.98 | 451 | 4.16 | ||||
| 2025-08-15 | 13F | First Heartland Consultants, Inc. | 42,523 | 2,785 | ||||||
| 2025-08-08 | 13F | SBI Securities Co., Ltd. | 55 | 34.15 | 4 | 50.00 | ||||
| 2025-08-11 | 13F | Lake Street Financial Llc | 15,233 | 1.63 | 998 | 4.73 | ||||
| 2025-08-04 | 13F | Atria Investments Llc | 41,973 | 36.47 | 2,749 | 40.69 | ||||
| 2025-04-21 | 13F | PSI Advisors, LLC | 0 | -100.00 | 0 | |||||
| 2025-07-25 | 13F | Cwm, Llc | 294,055 | 91.68 | 19 | 111.11 | ||||
| 2025-08-06 | 13F | Mascagni Wealth Management, Inc. | 24,676 | -8.84 | 1,616 | -5.99 | ||||
| 2025-08-14 | 13F | Jane Street Group, Llc | 0 | -100.00 | 0 | |||||
| 2025-08-06 | 13F | Vestmark Advisory Solutions, Inc. | 1,155,023 | 115.42 | 75,654 | 122.07 | ||||
| 2025-08-14 | 13F | Citadel Advisors Llc | Call | 5,200 | -50.00 | 341 | -48.48 | |||
| 2025-08-14 | 13F | Citadel Advisors Llc | 29,559 | 10,970.79 | 1,936 | 12,000.00 | ||||
| 2025-08-05 | 13F | Obermeyer Wood Investment Counsel, Lllp | 8,372 | 0.00 | 548 | 3.20 | ||||
| 2025-07-11 | 13F | CMH Wealth Management LLC | 42,995 | -1.85 | 2,816 | 1.19 | ||||
| 2025-08-27 | NP | ADVANCED SERIES TRUST - AST T. Rowe Price Growth Opportunities Portfolio | 2,976,490 | -12.93 | 194,960 | -10.25 | ||||
| 2025-07-10 | 13F | Wealth Enhancement Advisory Services, Llc | 30,535 | 5.05 | 2,039 | 10.46 | ||||
| 2025-07-09 | 13F | Krilogy Financial LLC | 11,385 | -0.95 | 746 | 2.05 | ||||
| 2025-08-12 | 13F | Frontier Asset Management, LLC | 15,911 | -1.50 | 1,042 | 1.56 | ||||
| 2025-06-26 | NP | FLCE - Frontier Asset U.S. Large Cap Equity ETF | 105,444 | 9.43 | 6,497 | 1.99 | ||||
| 2025-08-08 | 13F | Thoroughbred Financial Services, Llc | 7,156 | -7.83 | 0 | |||||
| 2025-08-14 | 13F | Raymond James Financial Inc | 768,996 | -15.41 | 50,369 | -12.80 | ||||
| 2025-07-30 | 13F | Whittier Trust Co Of Nevada Inc | 2,094 | 21.96 | 137 | 25.69 | ||||
| 2025-07-11 | 13F | Farther Finance Advisors, LLC | 9,923 | -8.48 | 650 | -5.67 | ||||
| 2025-08-08 | 13F | Comprehensive Financial Planning, Inc./PA | 95 | 1.06 | 6 | 0.00 | ||||
| 2025-07-11 | 13F | Seacrest Wealth Management, Llc | 6,175 | 17.26 | 404 | 20.96 | ||||
| 2025-07-17 | 13F | Alliance Wealth Advisors, LLC | 7,852 | -12.27 | 514 | -9.51 | ||||
| 2025-08-08 | 13F | Atlanta Consulting Group Advisors, LLC | 15,924 | 11.59 | 1,043 | 15.12 | ||||
| 2025-07-15 | 13F | BKA Wealth Consulting, Inc. | 5,122 | 336 | ||||||
| 2025-07-31 | 13F | FSM Wealth Advisors, LLC | 425,087 | 15.31 | 28,154 | 20.19 | ||||
| 2025-07-29 | 13F | Private Trust Co Na | 12,663 | 274.64 | 829 | 287.38 | ||||
| 2025-08-14 | 13F | Citadel Advisors Llc | Put | 4,600 | 228.57 | 301 | 242.05 | |||
| 2025-08-14 | 13F | IHT Wealth Management, LLC | 6,639 | 99.13 | 435 | 106.67 | ||||
| 2025-08-08 | 13F | Avantax Advisory Services, Inc. | 18,660 | 49.78 | 1,222 | 54.49 | ||||
| 2025-08-14 | 13F | Colony Group, LLC | 383,578 | 6.24 | 25,124 | 9.52 | ||||
| 2025-08-15 | 13F | Morgan Stanley | 1,555,179 | 13.04 | 101,864 | 16.53 | ||||
| 2025-08-12 | 13F | Global Retirement Partners, LLC | 66,093 | 21,015.97 | 4,329 | 22,684.21 | ||||
| 2025-08-13 | 13F | Kuhn & Co Investment Counsel | 13,562 | -12.84 | 888 | -10.12 | ||||
| 2025-08-27 | NP | ADVANCED SERIES TRUST - AST J.P. Morgan Global Thematic Portfolio | 1,858,236 | -4.45 | 121,714 | -1.50 | ||||
| 2025-08-11 | 13F | Ritter Daniher Financial Advisory LLC / DE | 30,062 | -12.76 | 1,969 | -10.05 | ||||
| 2025-07-21 | 13F | Triad Wealth Partners, LLC | 33,467 | 71.31 | 2,192 | 76.63 | ||||
| 2025-08-05 | 13F | Dynasty Wealth Management, Llc | 2,983,626 | -3.62 | 195,428 | -0.64 | ||||
| 2025-07-25 | 13F | We Are One Seven, LLC | 22,956 | 1,504 |