Mga Batayang Estadistika
| Pemilik Institusional | 137 total, 137 long only, 0 short only, 0 long/short - change of 8.66% MRQ |
| Alokasi Portofolio Rata-rata | 0.3005 % - change of -22.28% MRQ |
| Saham Institusional (Jangka Panjang) | 9,882,667 (ex 13D/G) - change of -0.41MM shares -4.00% MRQ |
| Nilai Institusional (Jangka Panjang) | $ 389,759 USD ($1000) |
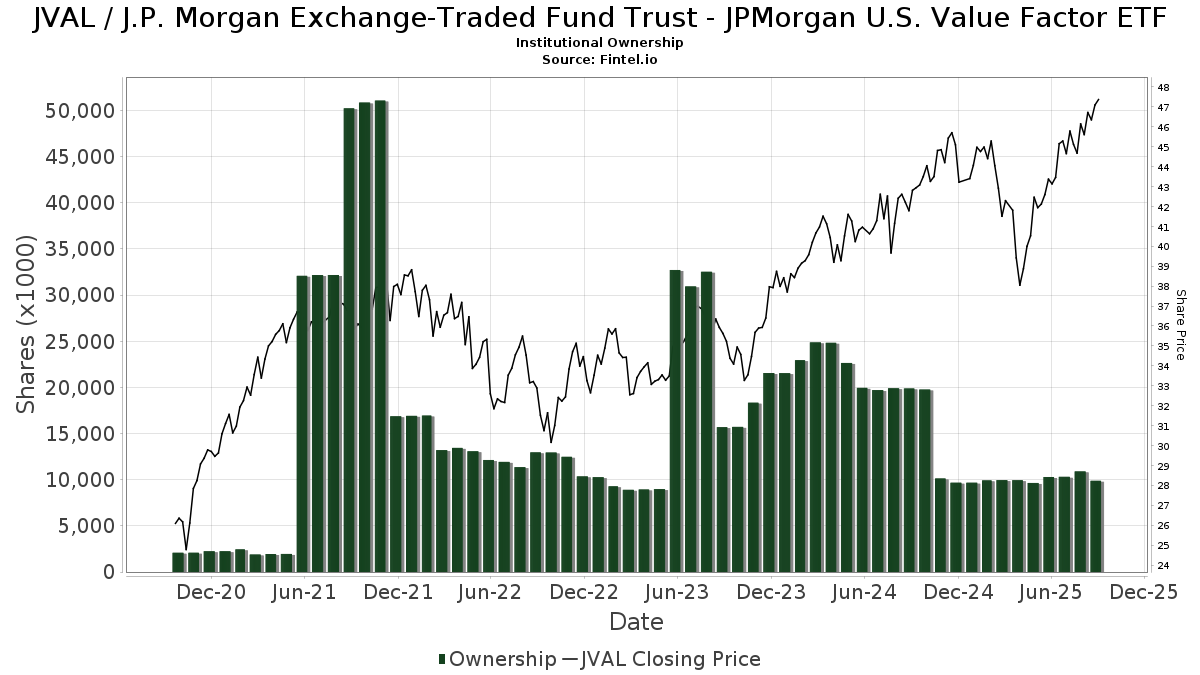
Kepemilikan Institusional dan Pemegang Saham
J.P. Morgan Exchange-Traded Fund Trust - JPMorgan U.S. Value Factor ETF (US:JVAL) memiliki 137 pemilik institusional dan pemegang saham yang telah mengajukan formulir 13D/G atau 13F kepada Komisi Bursa Efek (Securities Exchange Commission/SEC). Lembaga-lembaga ini memegang total 9,882,667 saham. Pemegang saham terbesar meliputi Cobblestone Capital Advisors Llc /ny/, LPL Financial LLC, Avidian Wealth Solutions, LLC, Cwm, Llc, Cerity Partners LLC, Bank Of America Corp /de/, Jpmorgan Chase & Co, Mainsail Financial Group, LLC, PFSEX - RiskPro® 30+ Fund Class R, and Apeiron RIA LLC .
Struktur kepemilikan institusional J.P. Morgan Exchange-Traded Fund Trust - JPMorgan U.S. Value Factor ETF (ARCA:JVAL) menunjukkan posisi terkini di perusahaan oleh institusi dan dana, serta perubahan terbaru dalam ukuran posisi. Pemegang saham utama dapat mencakup investor individu, reksa dana, dana lindung nilai, atau institusi. Jadwal 13D menunjukkan bahwa investor memegang (atau pernah memegang) lebih dari 5% saham perusahaan dan bermaksud (atau pernah bermaksud) untuk secara aktif mengejar perubahan strategi bisnis. Jadwal 13G menunjukkan investasi pasif lebih dari 5%.
The share price as of September 5, 2025 is 46.98 / share. Previously, on September 6, 2024, the share price was 41.32 / share. This represents an increase of 13.68% over that period.
Skor Sentimen Dana
Skor Sentimen Dana (sebelumnya dikenal sebagai Skor Akumulasi Kepemilikan) menemukan saham-saham yang paling banyak dibeli oleh dana. Ini adalah hasil dari model kuantitatif multi-faktor yang canggih yang mengidentifikasi perusahaan dengan tingkat akumulasi institusional tertinggi. Model penilaian menggunakan kombinasi dari total peningkatan pemilik yang diungkapkan, perubahan dalam alokasi portofolio pada pemilik tersebut, dan metrik lainnya. Angka berkisar dari 0 hingga 100, dengan angka yang lebih tinggi menunjukkan tingkat akumulasi yang lebih tinggi dibandingkan dengan perusahaan sejenisnya, dan 50 adalah rata-ratanya.
Frekuensi Pembaruan: Setiap Hari
Lihat Ownership Explorer, yang menyediakan daftar perusahaan dengan peringkat tertinggi.
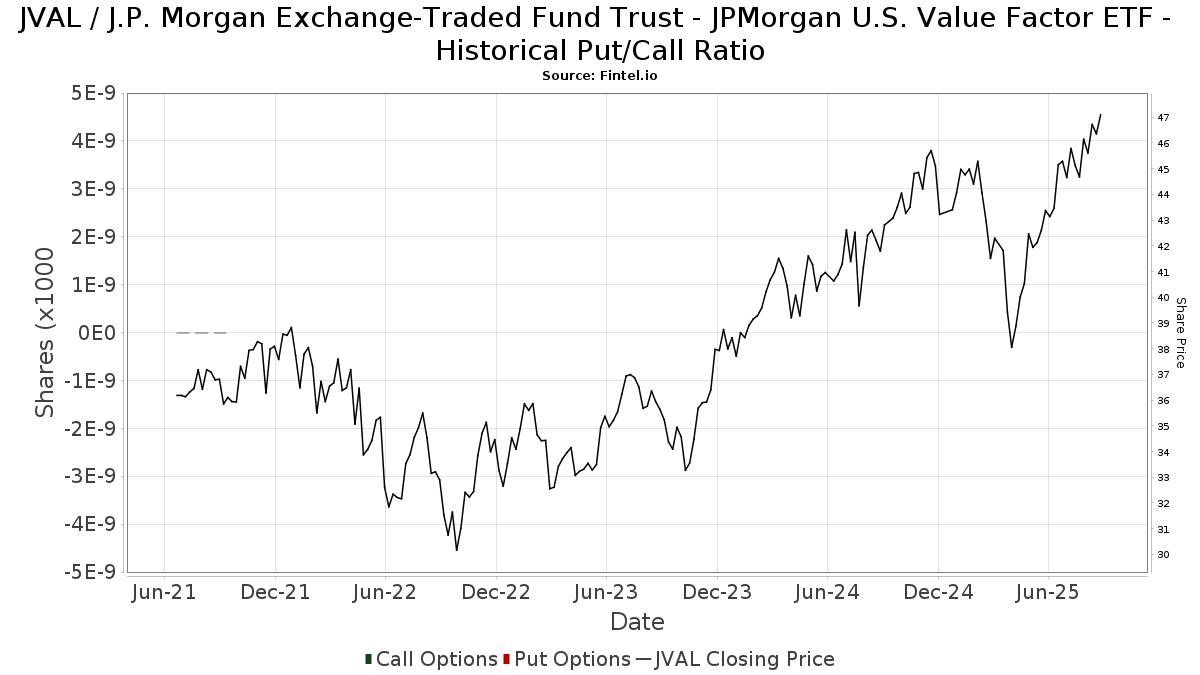
Rasio Put/Call Institusional
Selain melaporkan isu ekuitas dan utang standar, institusi dengan aset di bawah manajemen lebih dari 100 juta dolar AS juga harus mengungkapkan kepemilikan opsi put dan call mereka. Karena opsi put umumnya menunjukkan sentimen negatif, dan opsi call menunjukkan sentimen positif, kita dapat mengetahui sentimen institusional secara keseluruhan dengan memplot rasio put terhadap call. Grafik di sebelah kanan memplot rasio put/call historis untuk instrumen ini.
Menggunakan Rasio Put/Call sebagai indikator sentimen investor mengatasi salah satu kekurangan utama dari penggunaan total kepemilikan institusional, yaitu sejumlah besar aset yang dikelola diinvestasikan secara pasif untuk melacak indeks. Dana yang dikelola secara pasif biasanya tidak membeli opsi, sehingga indikator rasio put/call lebih akurat dalam melacak sentimen dana yang dikelola secara aktif.
Pengajuan 13F dan NPORT
Detail pada pengajuan 13F tersedia gratis. Detail pada pengajuan NP memerlukan keanggotaan premium. Baris berwarna hijau menunjukkan posisi baru. Baris berwarna merah menunjukkan posisi yang sudah ditutup. Klik tautan ini ikon untuk melihat riwayat transaksi selengkapnya.
Tingkatkan
untuk membuka data premium dan mengekspor ke Excel ![]() .
.
| Tanggal File | Sumber | Investor | Ketik | Presyo ng Avg (Silangan) |
Saham | Δ Saham (%) |
Dilaporkan Nilai ($1000) |
Nilai Δ (%) |
Alokasi Port (%) |
|
|---|---|---|---|---|---|---|---|---|---|---|
| 2025-07-17 | 13F | Janney Montgomery Scott LLC | 7,092 | -42.22 | 0 | |||||
| 2025-07-17 | 13F | Mainsail Financial Group, LLC | 366,260 | 0.72 | 16,324 | 8.38 | ||||
| 2025-07-24 | 13F | 3Chopt Investment Partners, LLC | 4,961 | 219 | ||||||
| 2025-08-14 | 13F | Mariner, LLC | 15,747 | -2.74 | 696 | 3.88 | ||||
| 2025-08-07 | 13F | Addison Advisors LLC | 18,590 | 70.71 | 822 | 82.26 | ||||
| 2025-08-12 | 13F | Jaffetilchin Investment Partners, LLC | 28,179 | -2.68 | 1,246 | 3.92 | ||||
| 2025-07-08 | 13F | Gallacher Capital Management LLC | 39,258 | -0.46 | 1,736 | 6.31 | ||||
| 2025-08-05 | 13F | Sigma Planning Corp | 48,659 | 4.73 | 2,152 | 11.85 | ||||
| 2025-08-14 | 13F | CoreCap Advisors, LLC | 7,562 | -0.68 | 334 | 6.03 | ||||
| 2025-08-13 | 13F | Gateway Wealth Partners, LLC | 22,627 | 1,001 | ||||||
| 2025-03-31 | NP | PFSEX - RiskPro® 30+ Fund Class R | 247,560 | -1.96 | 11,128 | 2.49 | ||||
| 2025-07-18 | 13F | Truist Financial Corp | 8,779 | -34.22 | 388 | -29.71 | ||||
| 2025-07-09 | 13F | Alesco Advisors Llc | 8,975 | 3.52 | 397 | 10.31 | ||||
| 2025-07-16 | 13F | Kathmere Capital Management, LLC | 143,006 | 36.24 | 6,325 | 45.50 | ||||
| 2025-08-13 | 13F | Flow Traders U.s. Llc | 0 | -100.00 | 0 | |||||
| 2025-07-14 | 13F | Cobblestone Asset Management LLC | 24,621 | 15.58 | 1,089 | 23.36 | ||||
| 2025-08-06 | 13F | Adviser Investments LLC | 8,522 | -0.65 | 377 | 5.92 | ||||
| 2025-08-19 | 13F | National Asset Management, Inc. | 19,147 | 847 | ||||||
| 2025-07-31 | 13F | MN Wealth Advisors, LLC | 19,892 | 70.79 | 880 | 82.37 | ||||
| 2025-08-12 | 13F | Jpmorgan Chase & Co | 401,083 | 42.89 | 17,740 | 52.59 | ||||
| 2025-08-14 | 13F | TCG Advisory Services, LLC | 23,278 | -27.43 | 1,030 | -22.52 | ||||
| 2025-08-12 | 13F | MAI Capital Management | 20,350 | 0.49 | 900 | 7.40 | ||||
| 2025-08-06 | 13F | First Horizon Advisors, Inc. | 1,164 | 0.00 | 51 | 6.25 | ||||
| 2025-05-01 | 13F | Steel Peak Wealth Management LLC | 0 | -100.00 | 0 | |||||
| 2025-08-14 | 13F | Fmr Llc | 447 | 14.91 | 20 | 18.75 | ||||
| 2025-08-13 | 13F | Russell Investments Group, Ltd. | 18 | 0.00 | 1 | |||||
| 2025-08-08 | 13F | Mv Capital Management, Inc. | 153 | 0.00 | 7 | 0.00 | ||||
| 2025-08-14 | 13F | Royal Bank Of Canada | 6,631 | -32.18 | 293 | -27.65 | ||||
| 2025-08-14 | 13F | Smartleaf Asset Management LLC | 0 | 0 | ||||||
| 2025-07-22 | 13F | Miracle Mile Advisors, LLC | 7,996 | 0.00 | 354 | 6.65 | ||||
| 2025-08-12 | 13F | O'shaughnessy Asset Management, Llc | 5,630 | -0.35 | 249 | 6.41 | ||||
| 2025-08-13 | 13F | Colonial Trust Co / SC | 0 | -100.00 | 0 | |||||
| 2025-08-12 | 13F | NWF Advisory Services Inc. | 5,177 | 0.00 | 214 | -4.04 | ||||
| 2025-08-14 | 13F | Integrated Wealth Concepts LLC | 76,234 | -19.35 | 3,372 | -13.90 | ||||
| 2025-08-05 | 13F | 5T Wealth, LLC | 25,616 | 12.53 | 1,133 | 20.17 | ||||
| 2025-08-08 | 13F | L & S Advisors Inc | 18,349 | 16.32 | 812 | 24.20 | ||||
| 2025-08-01 | 13F | Ashton Thomas Private Wealth, LLC | 14,375 | 97.11 | 636 | 110.26 | ||||
| 2025-08-29 | 13F | Total Investment Management Inc | 126 | 6 | ||||||
| 2025-07-21 | 13F | Ascent Group, LLC | 4,530 | 200 | ||||||
| 2025-08-06 | 13F | Legacy Investment Solutions, LLC | 0 | -100.00 | 0 | |||||
| 2025-07-29 | 13F | Planned Solutions, Inc. | 152,636 | -38.27 | 6,751 | -34.08 | ||||
| 2025-08-13 | 13F | Cresset Asset Management, LLC | 24,406 | 0.00 | 1,079 | 6.83 | ||||
| 2025-07-16 | 13F | Blue Oak Capital, LLC | 16,148 | -7.63 | 714 | -1.38 | ||||
| 2025-08-15 | 13F | Morgan Stanley | 106,553 | -10.31 | 4,713 | -4.23 | ||||
| 2025-08-14 | 13F | Comerica Bank | 7,383 | 1.10 | 327 | 7.95 | ||||
| 2025-08-11 | 13F | Invenio Wealth Partners Llc | 0 | -100.00 | 0 | |||||
| 2025-08-12 | 13F | Proequities, Inc. | 0 | 0 | ||||||
| 2025-08-14 | 13F | Wells Fargo & Company/mn | 900 | -91.58 | 40 | -91.18 | ||||
| 2025-07-11 | 13F | Pinnacle Bancorp, Inc. | 10 | 0.00 | 0 | |||||
| 2025-07-25 | 13F | Envestnet Portfolio Solutions, Inc. | 48,365 | -11.99 | 2,139 | -6.02 | ||||
| 2025-07-23 | 13F | Defined Financial Planning LLC | 161,785 | 14.68 | 7,211 | 23.46 | ||||
| 2025-07-16 | 13F | Perigon Wealth Management, LLC | 7,262 | 1.54 | 321 | 8.45 | ||||
| 2025-08-14 | 13F | UBS Group AG | 540 | 19.47 | 24 | 27.78 | ||||
| 2025-08-15 | 13F | Captrust Financial Advisors | 4,974 | -2.79 | 220 | 4.27 | ||||
| 2025-07-30 | 13F | First Citizens Bank & Trust Co | 50,693 | -12.16 | 2,242 | -6.19 | ||||
| 2025-08-13 | 13F | Cerity Partners LLC | 551,676 | 1.45 | 24,401 | 8.33 | ||||
| 2025-08-08 | 13F | Crossmark Global Holdings, Inc. | 58,094 | -4.52 | 2,564 | 1.95 | ||||
| 2025-08-13 | 13F | Cary Street Partners Financial Llc | 25,020 | 0.47 | 1,107 | 7.27 | ||||
| 2025-07-07 | 13F | Versant Capital Management, Inc | 46 | 0.00 | 2 | 100.00 | ||||
| 2025-08-06 | 13F | Modera Wealth Management, LLC | 4,867 | 0.00 | 215 | 6.97 | ||||
| 2025-08-14 | 13F | Chilton Investment Co Llc | 7,983 | 0.00 | 353 | 6.97 | ||||
| 2025-08-14 | 13F | Goodwin Investment Advisory | 4,985 | 0.00 | 220 | 6.80 | ||||
| 2025-07-17 | 13F | Fifth Third Securities, Inc. | 50,002 | 1.27 | 2,212 | 8.12 | ||||
| 2025-08-13 | 13F | Cary Street Partner Investment Advisory Llc | 18 | -25.00 | 1 | |||||
| 2025-08-04 | 13F | Northwest Financial Advisors | 7,990 | -27.48 | 353 | -22.59 | ||||
| 2025-08-14 | 13F | Federation des caisses Desjardins du Quebec | 15,280 | -97.07 | 676 | -96.88 | ||||
| 2025-08-14 | 13F | Guardian Wealth Advisors, Llc / Nc | 478 | 0.00 | 21 | 10.53 | ||||
| 2025-07-28 | 13F | Sagespring Wealth Partners, Llc | 31,433 | -2.38 | 1,390 | 4.28 | ||||
| 2025-08-04 | 13F | Assetmark, Inc | 34 | -40.35 | 2 | -50.00 | ||||
| 2025-07-30 | 13F | Crewe Advisors LLC | 137 | 6 | ||||||
| 2025-08-08 | 13F | Thoroughbred Financial Services, Llc | 27,842 | -20.44 | 1 | 0.00 | ||||
| 2025-08-14 | 13F | Jane Street Group, Llc | 0 | -100.00 | 0 | |||||
| 2025-08-08 | 13F | Campbell Deegan Wealth Management, LLC | 4,638 | 205 | ||||||
| 2025-08-11 | 13F | Private Advisor Group, LLC | 12,659 | 1.19 | 560 | 7.92 | ||||
| 2025-07-21 | 13F | Ameritas Advisory Services, LLC | 10,899 | 10.85 | 482 | 18.43 | ||||
| 2025-04-28 | 13F | Strategic Financial Concepts, LLC | 0 | -100.00 | 0 | -100.00 | ||||
| 2025-08-11 | 13F | Aptus Capital Advisors, LLC | 478 | 0.00 | 21 | 10.53 | ||||
| 2025-07-22 | 13F | Berger Financial Group, Inc | 4,542 | -9.32 | 201 | -3.38 | ||||
| 2025-08-14 | 13F | Bank Of America Corp /de/ | 496,878 | 9.09 | 21,977 | 16.49 | ||||
| 2025-07-22 | 13F | Confluence Wealth Services, Inc. | 52,310 | 0.01 | 2,314 | 13.77 | ||||
| 2025-07-30 | 13F | Retirement Planning Group | 19,932 | -21.76 | 882 | -16.49 | ||||
| 2025-08-12 | 13F | Global Retirement Partners, LLC | 1,500 | -1.38 | 66 | 1.54 | ||||
| 2025-08-14 | 13F | Qube Research & Technologies Ltd | 1,342 | -14.69 | 59 | -9.23 | ||||
| 2025-08-14 | 13F | Susquehanna International Group, Llp | 8,064 | -58.61 | 357 | -55.89 | ||||
| 2025-08-06 | 13F | Summit Wealth & Retirement Planning, Inc. | 4,580 | 203 | ||||||
| 2025-08-12 | 13F | Steward Partners Investment Advisory, Llc | 143 | 0.00 | 6 | 20.00 | ||||
| 2025-07-22 | 13F | Coastal Investment Advisors, Inc. | 600 | 0.00 | 27 | 8.33 | ||||
| 2025-07-30 | 13F | Patten Group, Inc. | 12,118 | -6.19 | 536 | 0.00 | ||||
| 2025-08-04 | 13F | Spire Wealth Management | 4,966 | -1.23 | 220 | 5.29 | ||||
| 2025-08-14 | 13F | Goldman Sachs Group Inc | 71,816 | 3,176 | ||||||
| 2025-09-04 | 13F/A | Advisor Group Holdings, Inc. | 188,691 | 22.21 | 8,346 | 30.51 | ||||
| 2025-08-27 | 13F | Barnes Wealth Management Group, Inc | 8,156 | -2.44 | 361 | 4.05 | ||||
| 2025-08-11 | 13F | Rothschild Investment Llc | 217 | 0.00 | 10 | 12.50 | ||||
| 2025-08-26 | 13F/A | Thrivent Financial For Lutherans | 0 | -100.00 | 0 | -100.00 | ||||
| 2025-07-07 | 13F | Park Edge Advisors, LLC | 4,750 | 210 | ||||||
| 2025-04-14 | 13F | Umb Bank N A/mo | 0 | -100.00 | 0 | |||||
| 2025-08-12 | 13F | PSI Advisors, LLC | 0 | -100.00 | 0 | |||||
| 2025-07-14 | 13F | Acropolis Investment Management, LLC | 9,650 | -4.36 | 427 | 2.16 | ||||
| 2025-08-14 | 13F | EP Wealth Advisors, Inc. | 51,872 | -0.88 | 2,294 | 5.86 | ||||
| 2025-08-12 | 13F | CIBC Private Wealth Group, LLC | 19,651 | -15.25 | 869 | 3.70 | ||||
| 2025-08-14 | 13F | Mml Investors Services, Llc | 5,198 | 0.33 | 0 | |||||
| 2025-08-19 | 13F | Advisory Services Network, LLC | 5,349 | 239 | ||||||
| 2025-08-15 | 13F | Tower Research Capital LLC (TRC) | 4,501 | -24.49 | 199 | -19.11 | ||||
| 2025-07-09 | 13F | Heritage Wealth Architects, Inc. | 42,024 | -0.70 | 1,859 | 6.05 | ||||
| 2025-08-13 | 13F | Capital Analysts, Inc. | 1,134 | 19.49 | 0 | |||||
| 2025-07-24 | 13F | Ronald Blue Trust, Inc. | 18,306 | 91.91 | 810 | 104.81 | ||||
| 2025-08-11 | 13F | HighTower Advisors, LLC | 20,531 | 14.67 | 908 | 22.54 | ||||
| 2025-08-11 | 13F | Intrust Bank Na | 72,829 | -0.20 | 3,221 | 6.59 | ||||
| 2025-09-03 | 13F | American Trust | 6,488 | 287 | ||||||
| 2025-07-17 | 13F | Park Place Capital Corp | 1,180 | 0.00 | 53 | 8.33 | ||||
| 2025-05-15 | 13F/A | Orion Portfolio Solutions, LLC | 173,874 | -11.88 | 7,202 | -15.51 | ||||
| 2025-04-08 | 13F | Parallel Advisors, LLC | 0 | -100.00 | 0 | |||||
| 2025-07-25 | 13F | Cwm, Llc | 853,589 | 0.53 | 38 | 5.71 | ||||
| 2025-08-13 | 13F | Northwestern Mutual Wealth Management Co | 76,784 | 3.70 | 3,396 | 10.73 | ||||
| 2025-08-06 | 13F | Commonwealth Equity Services, Llc | 149,798 | 0.19 | 7 | 0.00 | ||||
| 2025-08-12 | 13F | Auxano Advisors, LLC | 5,121 | 0.69 | 226 | 7.62 | ||||
| 2025-08-18 | 13F/A | National Bank Of Canada /fi/ | 106 | 0.00 | 5 | 0.00 | ||||
| 2025-08-01 | 13F | Howard Capital Management Inc. | 10,763 | 0.00 | 476 | 6.97 | ||||
| 2025-08-08 | 13F | Accredited Investors Inc. | 4,800 | 212 | ||||||
| 2025-08-07 | 13F | Apeiron RIA LLC | 228,112 | 5.68 | 10,089 | 12.85 | ||||
| 2025-04-30 | 13F | Stratos Wealth Partners, LTD. | 0 | -100.00 | 0 | |||||
| 2025-07-10 | 13F | Wealth Enhancement Advisory Services, Llc | 33,143 | 8.72 | 1,505 | 19.18 | ||||
| 2025-07-24 | 13F | Columbia Advisory Partners Llc | 165,954 | 18.12 | 7,340 | 26.14 | ||||
| 2025-08-28 | 13F/A | Lavaca Capital Llc | 2,619 | -2.96 | 116 | 3.60 | ||||
| 2025-08-14 | 13F | Mpwm Advisory Solutions, Llc | 158 | 0.00 | 7 | 0.00 | ||||
| 2025-07-24 | 13F | IFP Advisors, Inc | 612 | 27 | ||||||
| 2025-08-08 | 13F | Avantax Advisory Services, Inc. | 6,929 | 5.82 | 306 | 12.92 | ||||
| 2025-07-22 | 13F | MBL Wealth, LLC | 12,000 | 0.00 | 531 | 6.64 | ||||
| 2025-08-13 | 13F | SCS Capital Management LLC | 17,721 | 0.00 | 784 | 6.68 | ||||
| 2025-08-18 | 13F | Goodman Advisory Group, LLC | 0 | -100.00 | 0 | |||||
| 2025-08-14 | 13F | GWM Advisors LLC | 18,466 | 15.13 | 817 | 22.89 | ||||
| 2025-07-31 | 13F | Cambridge Investment Research Advisors, Inc. | 22,996 | -3.62 | 1 | |||||
| 2025-08-07 | 13F | Allworth Financial LP | 87 | 0.00 | 4 | 0.00 | ||||
| 2025-07-30 | 13F | Avidian Wealth Solutions, LLC | 961,736 | 81.46 | 42,538 | 93.77 | ||||
| 2025-08-11 | 13F | Wealthspire Advisors, LLC | 8,884 | -9.04 | 393 | -2.97 | ||||
| 2025-08-13 | 13F | Twin Peaks Wealth Advisors, LLC | 778 | 35 | ||||||
| 2025-08-04 | 13F | Atria Investments Llc | 159,559 | 15.35 | 7,057 | 23.18 | ||||
| 2025-08-01 | 13F | Envestnet Asset Management Inc | 7,234 | -39.82 | 320 | -35.81 | ||||
| 2025-07-21 | 13F | Triad Wealth Partners, LLC | 6,447 | 285 | ||||||
| 2025-08-12 | 13F | LPL Financial LLC | 994,237 | 1.42 | 43,975 | 8.30 | ||||
| 2025-08-08 | 13F | Gts Securities Llc | 16,193 | 716 | ||||||
| 2025-08-12 | 13F | Burk Holdings LLC | 5,956 | 0.00 | 263 | 6.91 | ||||
| 2025-08-04 | 13F | Daymark Wealth Partners, Llc | 47,667 | 57.19 | 2,108 | 67.83 | ||||
| 2025-08-14 | 13F | Raymond James Financial Inc | 130,935 | -1.03 | 5,791 | 5.69 | ||||
| 2025-08-14 | 13F | Citadel Advisors Llc | 18,920 | -63.81 | 837 | -61.39 | ||||
| 2025-08-27 | 13F/A | Brinker Capital Investments, LLC | 158,665 | -8.75 | 7,018 | -2.56 | ||||
| 2025-05-16 | 13F | Legacy Wealth Managment, LLC/ID | 0 | -100.00 | 0 | |||||
| 2025-08-06 | 13F | AE Wealth Management LLC | 0 | -100.00 | 0 | |||||
| 2025-07-29 | 13F | Private Trust Co Na | 1,009 | 0.00 | 45 | 7.32 | ||||
| 2025-08-18 | 13F | Geneos Wealth Management Inc. | 1,942 | 0.00 | 86 | 6.25 | ||||
| 2025-08-01 | 13F | Cobblestone Capital Advisors Llc /ny/ | 1,189,925 | -0.57 | 52,630 | 6.17 | ||||
| 2025-08-14 | 13F | Boston Private Wealth Llc | 33,570 | -30.81 | 1,485 | -26.13 | ||||
| 2025-08-08 | 13F | Cetera Investment Advisers | 167,694 | 0.81 | 7,417 | 7.65 | ||||
| 2025-04-23 | 13F | Creative Financial Designs Inc /adv | 0 | -100.00 | 0 | |||||
| 2025-07-11 | 13F | Farther Finance Advisors, LLC | 1,558 | 98.22 | 69 | 112.50 |
Other Listings
| MX:JVAL |