Mga Batayang Estadistika
| Pemilik Institusional | 178 total, 176 long only, 0 short only, 2 long/short - change of 1.70% MRQ |
| Alokasi Portofolio Rata-rata | 0.0777 % - change of 9.50% MRQ |
| Saham Institusional (Jangka Panjang) | 3,138,970 (ex 13D/G) - change of 0.16MM shares 5.26% MRQ |
| Nilai Institusional (Jangka Panjang) | $ 216,048 USD ($1000) |
Kepemilikan Institusional dan Pemegang Saham
VanEck ETF Trust - VanEck Agribusiness ETF (US:MOO) memiliki 178 pemilik institusional dan pemegang saham yang telah mengajukan formulir 13D/G atau 13F kepada Komisi Bursa Efek (Securities Exchange Commission/SEC). Lembaga-lembaga ini memegang total 3,138,970 saham. Pemegang saham terbesar meliputi 1832 Asset Management L.P., Morgan Stanley, Bank Of America Corp /de/, LPL Financial LLC, UBS Group AG, Money Design Co.,Ltd., Cetera Investment Advisers, RLY - SPDR SSGA Multi-Asset Real Return ETF, Oppenheimer Asset Management Inc., and Barry Investment Advisors, LLC .
Struktur kepemilikan institusional VanEck ETF Trust - VanEck Agribusiness ETF (ARCA:MOO) menunjukkan posisi terkini di perusahaan oleh institusi dan dana, serta perubahan terbaru dalam ukuran posisi. Pemegang saham utama dapat mencakup investor individu, reksa dana, dana lindung nilai, atau institusi. Jadwal 13D menunjukkan bahwa investor memegang (atau pernah memegang) lebih dari 5% saham perusahaan dan bermaksud (atau pernah bermaksud) untuk secara aktif mengejar perubahan strategi bisnis. Jadwal 13G menunjukkan investasi pasif lebih dari 5%.
The share price as of September 5, 2025 is 74.44 / share. Previously, on September 6, 2024, the share price was 72.00 / share. This represents an increase of 3.39% over that period.

Skor Sentimen Dana
Skor Sentimen Dana (sebelumnya dikenal sebagai Skor Akumulasi Kepemilikan) menemukan saham-saham yang paling banyak dibeli oleh dana. Ini adalah hasil dari model kuantitatif multi-faktor yang canggih yang mengidentifikasi perusahaan dengan tingkat akumulasi institusional tertinggi. Model penilaian menggunakan kombinasi dari total peningkatan pemilik yang diungkapkan, perubahan dalam alokasi portofolio pada pemilik tersebut, dan metrik lainnya. Angka berkisar dari 0 hingga 100, dengan angka yang lebih tinggi menunjukkan tingkat akumulasi yang lebih tinggi dibandingkan dengan perusahaan sejenisnya, dan 50 adalah rata-ratanya.
Frekuensi Pembaruan: Setiap Hari
Lihat Ownership Explorer, yang menyediakan daftar perusahaan dengan peringkat tertinggi.
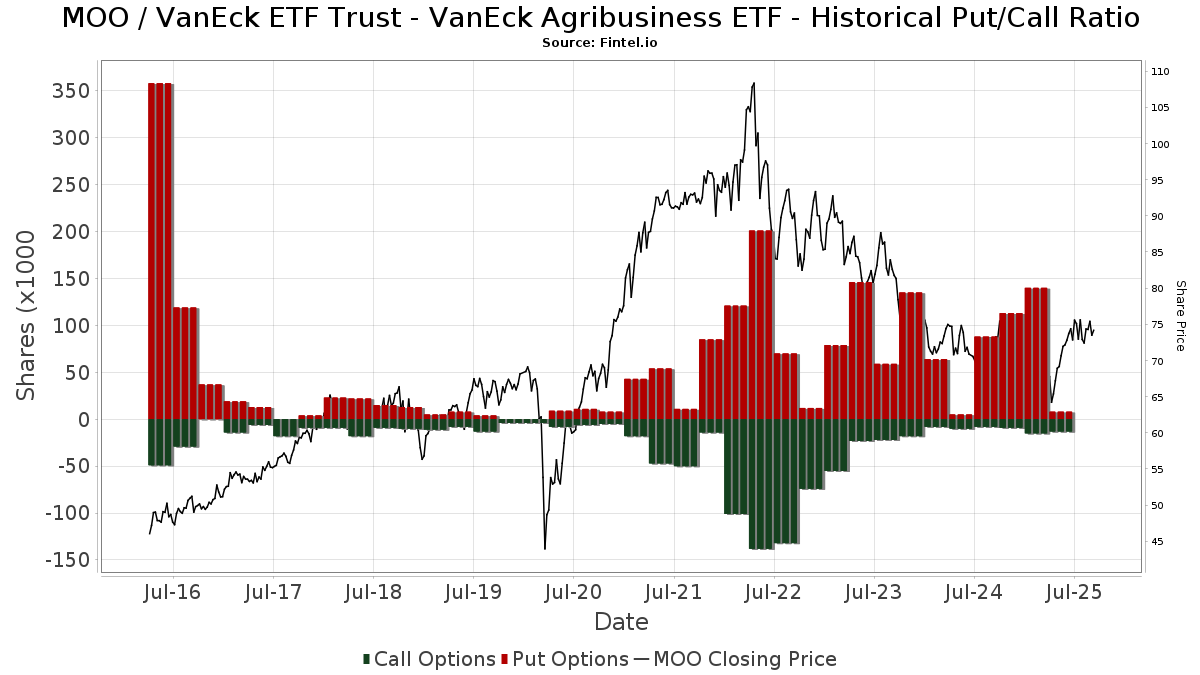
Rasio Put/Call Institusional
Selain melaporkan isu ekuitas dan utang standar, institusi dengan aset di bawah manajemen lebih dari 100 juta dolar AS juga harus mengungkapkan kepemilikan opsi put dan call mereka. Karena opsi put umumnya menunjukkan sentimen negatif, dan opsi call menunjukkan sentimen positif, kita dapat mengetahui sentimen institusional secara keseluruhan dengan memplot rasio put terhadap call. Grafik di sebelah kanan memplot rasio put/call historis untuk instrumen ini.
Menggunakan Rasio Put/Call sebagai indikator sentimen investor mengatasi salah satu kekurangan utama dari penggunaan total kepemilikan institusional, yaitu sejumlah besar aset yang dikelola diinvestasikan secara pasif untuk melacak indeks. Dana yang dikelola secara pasif biasanya tidak membeli opsi, sehingga indikator rasio put/call lebih akurat dalam melacak sentimen dana yang dikelola secara aktif.
Pengajuan 13F dan NPORT
Detail pada pengajuan 13F tersedia gratis. Detail pada pengajuan NP memerlukan keanggotaan premium. Baris berwarna hijau menunjukkan posisi baru. Baris berwarna merah menunjukkan posisi yang sudah ditutup. Klik tautan ini ikon untuk melihat riwayat transaksi selengkapnya.
Tingkatkan
untuk membuka data premium dan mengekspor ke Excel ![]() .
.
| Tanggal File | Sumber | Investor | Ketik | Presyo ng Avg (Silangan) |
Saham | Δ Saham (%) |
Dilaporkan Nilai ($1000) |
Nilai Δ (%) |
Alokasi Port (%) |
|
|---|---|---|---|---|---|---|---|---|---|---|
| 2025-08-14 | 13F | Banque Transatlantique SA | 0 | -100.00 | 0 | |||||
| 2025-07-24 | 13F | Comprehensive Money Management Services LLC | 17,980 | 1.09 | 1,324 | 9.61 | ||||
| 2025-04-28 | 13F | Coastline Trust Co | 0 | -100.00 | 0 | |||||
| 2025-08-14 | 13F | Benjamin Edwards Inc | 0 | -100.00 | 0 | |||||
| 2025-08-12 | 13F | Steward Partners Investment Advisory, Llc | 150 | 0.00 | 11 | 10.00 | ||||
| 2025-08-14 | 13F | Jane Street Group, Llc | 39,357 | 745.48 | 2,897 | 816.77 | ||||
| 2025-08-14 | 13F | Strategic Wealth Designers | 1,179 | -96.32 | 87 | -95.84 | ||||
| 2025-07-31 | 13F | CVA Family Office, LLC | 2,247 | 0.00 | 165 | 8.55 | ||||
| 2025-08-07 | 13F | Allworth Financial LP | 85 | 0.00 | 6 | 20.00 | ||||
| 2025-08-13 | 13F | Jones Financial Companies Lllp | 2,265 | -0.40 | 166 | 8.50 | ||||
| 2025-07-31 | 13F | Wealthfront Advisers Llc | 4,780 | 352 | ||||||
| 2025-08-14 | 13F | Peapack Gladstone Financial Corp | 2,807 | -12.47 | 0 | |||||
| 2025-08-12 | 13F | Change Path, LLC | 4,249 | -18.02 | 313 | -11.11 | ||||
| 2025-08-05 | 13F | Bank Of Montreal /can/ | 863 | -36.68 | 64 | -31.52 | ||||
| 2025-08-13 | 13F | Cresset Asset Management, LLC | 26,058 | 0.00 | 1,918 | 8.42 | ||||
| 2025-07-30 | 13F | Whittier Trust Co | 11 | 1 | ||||||
| 2025-08-01 | 13F | Rossby Financial, LCC | 67 | 0.00 | 5 | 0.00 | ||||
| 2025-08-14 | 13F | Harwood Advisory Group, LLC | 29 | 0.00 | 2 | 100.00 | ||||
| 2025-08-11 | 13F | TD Waterhouse Canada Inc. | 315 | 23 | ||||||
| 2025-07-30 | 13F | Whittier Trust Co Of Nevada Inc | 378 | -2.83 | 28 | 3.85 | ||||
| 2025-08-11 | 13F | Principal Securities, Inc. | 0 | -100.00 | 0 | |||||
| 2025-07-28 | 13F | Harbour Investments, Inc. | 389 | 0.00 | 29 | 7.69 | ||||
| 2025-08-14 | 13F | Widmann Financial Services, Inc. | 24,282 | 2.12 | 1,788 | 10.72 | ||||
| 2025-07-24 | 13F | Financial Connections Group, Inc. | 100 | 0.00 | 0 | |||||
| 2025-07-24 | 13F | Horizon Bancorp Inc /in/ | 12 | 0.00 | 0 | |||||
| 2025-07-25 | 13F | NorthRock Partners, LLC | 2,125 | 0.00 | 156 | 8.33 | ||||
| 2025-08-14 | 13F | Private Wealth Advisors, LLC | 2,819 | 208 | ||||||
| 2025-08-14 | 13F | Goldman Sachs Group Inc | 29,389 | 7.71 | 2,164 | 16.79 | ||||
| 2025-08-12 | 13F | SRS Capital Advisors, Inc. | 198 | 0.00 | 15 | 7.69 | ||||
| 2025-07-29 | 13F | Angeles Wealth Management, Llc | 100 | 0.00 | 7 | 16.67 | ||||
| 2025-09-04 | 13F/A | Advisor Group Holdings, Inc. | 19,237 | -45.52 | 1,417 | -40.95 | ||||
| 2025-04-09 | 13F | Mechanics Bank Trust Department | 0 | -100.00 | 0 | |||||
| 2025-08-08 | 13F | Schwarz Dygos Wheeler Investment Advisors Llc | 0 | -100.00 | 0 | |||||
| 2025-08-12 | 13F | Proequities, Inc. | 0 | 0 | ||||||
| 2025-07-22 | 13F | Valley National Advisers Inc | 0 | -100.00 | 0 | |||||
| 2025-08-06 | 13F | Commonwealth Equity Services, Llc | 29,161 | -2.87 | 2 | 0.00 | ||||
| 2025-08-14 | 13F | Wells Fargo & Company/mn | 40,891 | 34.47 | 3,010 | 45.83 | ||||
| 2025-08-15 | 13F | Tower Research Capital LLC (TRC) | 0 | -100.00 | 0 | |||||
| 2025-08-18 | 13F | Wolverine Trading, Llc | Put | 0 | -100.00 | 0 | ||||
| 2025-08-13 | 13F | Copley Financial Group, Inc. | 7,746 | -6.74 | 570 | 1.24 | ||||
| 2025-08-18 | 13F | Wolverine Trading, Llc | 0 | -100.00 | 0 | |||||
| 2025-08-13 | 13F | Transce3nd, LLC | 163 | -26.58 | 12 | -20.00 | ||||
| 2025-07-11 | 13F | Farther Finance Advisors, LLC | 108 | 575.00 | 8 | 600.00 | ||||
| 2025-08-13 | 13F | Colonial Trust Co / SC | 1,900 | 0.00 | 140 | 8.59 | ||||
| 2025-07-31 | 13F | Leavell Investment Management, Inc. | 7,167 | -0.17 | 528 | 8.21 | ||||
| 2025-08-14 | 13F | GWM Advisors LLC | 216 | -40.98 | 16 | -37.50 | ||||
| 2025-05-13 | 13F | Bokf, Na | 0 | -100.00 | 0 | -100.00 | ||||
| 2025-08-11 | 13F | Citigroup Inc | 3 | 0.00 | 0 | |||||
| 2025-08-05 | 13F | Verity Asset Management, Inc. | 0 | -100.00 | 0 | |||||
| 2025-08-14 | 13F | CoreCap Advisors, LLC | 494 | 0.00 | 36 | 9.09 | ||||
| 2025-07-31 | 13F | Oppenheimer & Co Inc | 4,099 | 302 | ||||||
| 2025-07-16 | 13F | Register Financial Advisors LLC | 169 | 0.00 | 12 | 9.09 | ||||
| 2025-08-06 | 13F | Moors & Cabot, Inc. | 3,949 | 0.51 | 291 | 9.02 | ||||
| 2025-08-14 | 13F | Glenmede Investment Management, LP | 2,527 | 186 | ||||||
| 2025-08-14 | 13F | Stamos Capital Partners, L.p. | 10,613 | 43.65 | 781 | 55.89 | ||||
| 2025-07-31 | 13F | Oppenheimer Asset Management Inc. | 65,134 | 4,795 | ||||||
| 2025-08-15 | 13F | Kestra Advisory Services, LLC | 0 | -100.00 | 0 | |||||
| 2025-08-14 | 13F | Citadel Advisors Llc | Call | 0 | -100.00 | 0 | ||||
| 2025-07-16 | 13F/A | CX Institutional | 12 | 0.00 | 0 | |||||
| 2025-07-17 | 13F | Janney Montgomery Scott LLC | 5,265 | -6.88 | 0 | |||||
| 2025-07-08 | 13F | Nbc Securities, Inc. | 2,680 | -26.54 | 0 | |||||
| 2025-08-11 | 13F | HighTower Advisors, LLC | 12,956 | -19.74 | 954 | -12.97 | ||||
| 2025-07-21 | 13F | Credential Securities Inc. | 0 | -100.00 | 0 | -100.00 | ||||
| 2025-08-13 | 13F | Scotia Capital Inc. | 17,968 | -3.35 | 1,323 | 4.75 | ||||
| 2025-08-04 | 13F | Spire Wealth Management | 300 | -95.24 | 22 | -94.85 | ||||
| 2025-08-05 | 13F | GPS Wealth Strategies Group, LLC | 319 | 23 | ||||||
| 2025-08-13 | 13F | Flow Traders U.s. Llc | 26,920 | 2 | ||||||
| 2025-08-05 | 13F | Simplex Trading, Llc | 0 | -100.00 | 0 | |||||
| 2025-08-01 | 13F | Envestnet Asset Management Inc | 21,417 | -3.50 | 1,577 | 4.65 | ||||
| 2025-08-18 | 13F/A | National Bank Of Canada /fi/ | 2,408 | -21.79 | 177 | -15.79 | ||||
| 2025-08-06 | 13F | Prospera Financial Services Inc | 4,531 | 5.25 | 334 | 14.04 | ||||
| 2025-08-08 | 13F | Larson Financial Group LLC | 49 | 0.00 | 4 | 0.00 | ||||
| 2025-08-14 | 13F | Ameriprise Financial Inc | 40,398 | 0.57 | 2,974 | 9.10 | ||||
| 2025-08-14 | 13F | Van Eck Associates Corp | 265 | -98.60 | 0 | -100.00 | ||||
| 2025-08-14 | 13F | Royal Bank Of Canada | 40,016 | 124.96 | 2,946 | 143.67 | ||||
| 2025-04-23 | 13F | GenTrust, LLC | 0 | -100.00 | 0 | |||||
| 2025-07-17 | 13F | Vermillion Wealth Management, Inc. | 21 | 0.00 | 2 | 0.00 | ||||
| 2025-07-23 | 13F | Fortis Advisors, LLC | 45,464 | -0.72 | 3,347 | 7.69 | ||||
| 2025-07-10 | 13F | Wealth Enhancement Advisory Services, Llc | 5,268 | 397 | ||||||
| 2025-07-16 | 13F | Essex Financial Services, Inc. | 5,568 | 0.00 | 410 | 8.20 | ||||
| 2025-08-15 | 13F | Captrust Financial Advisors | 4,749 | 48.45 | 350 | 60.83 | ||||
| 2025-03-24 | 13F/A | Wellington Management Group Llp | 0 | -100.00 | 0 | |||||
| 2025-08-13 | 13F | Truvestments Capital Llc | 600 | 0.00 | 44 | 10.00 | ||||
| 2025-05-14 | 13F | 1620 Investment Advisors, Inc. | 0 | -100.00 | 0 | |||||
| 2025-04-23 | 13F | Mascagni Wealth Management, Inc. | 0 | -100.00 | 0 | -100.00 | ||||
| 2025-08-14 | 13F | Mml Investors Services, Llc | 2,804 | 0 | ||||||
| 2025-07-28 | 13F | Pettinga Financial Advisors, LLC | 5,315 | -12.00 | 391 | -4.63 | ||||
| 2025-08-14 | 13F | Hrt Financial Lp | 0 | -100.00 | 0 | |||||
| 2025-08-14 | 13F | Susquehanna International Group, Llp | 7,625 | -81.53 | 561 | -79.99 | ||||
| 2025-08-14 | 13F | Susquehanna International Group, Llp | Call | 13,800 | 2.22 | 1,016 | 10.81 | |||
| 2025-08-14 | 13F | Susquehanna International Group, Llp | Put | 3,300 | -96.03 | 243 | -95.72 | |||
| 2025-05-15 | 13F | Two Sigma Investments, Lp | 0 | -100.00 | 0 | |||||
| 2025-08-11 | 13F | Rothschild Investment Llc | 600 | 0.00 | 44 | 10.00 | ||||
| 2025-08-08 | 13F | Meridian Wealth Management, LLC | 8,300 | 22.06 | 611 | 32.54 | ||||
| 2025-08-05 | 13F | Gould Asset Management Llc /ca/ | 3,277 | 8.80 | 241 | 18.14 | ||||
| 2025-08-13 | 13F | Northwestern Mutual Wealth Management Co | 2,955 | -2.89 | 218 | 5.34 | ||||
| 2025-08-07 | 13F | CENTRAL TRUST Co | 1,625 | 0.00 | 120 | 8.18 | ||||
| 2025-06-26 | NP | HRLIX - The Hartford Global Real Asset Fund Class I | 1,932 | -16.40 | 133 | -16.87 | ||||
| 2025-08-12 | 13F | Deutsche Bank Ag\ | 60 | 0.00 | 4 | 0.00 | ||||
| 2025-08-11 | 13F | Synergy Investment Management, LLC | 0 | -100.00 | 0 | |||||
| 2025-07-21 | 13F | First National Bank & Trust Co Of Newtown | 16,057 | -0.62 | 1,182 | 7.85 | ||||
| 2025-07-23 | 13F | Nbt Bank N A /ny | 20,581 | -3.89 | 1,515 | 4.27 | ||||
| 2025-08-04 | 13F | Creative Financial Designs Inc /adv | 345 | 0.00 | 25 | 8.70 | ||||
| 2025-08-13 | 13F | 1832 Asset Management L.P. | 545,736 | -0.58 | 40,177 | 7.81 | ||||
| 2025-07-16 | 13F | Highline Wealth Partners Llc | 300 | 22 | ||||||
| 2025-07-24 | 13F | Costello Asset Management, INC | 132 | 0.00 | 10 | 12.50 | ||||
| 2025-04-15 | 13F | Transform Wealth, LLC | 33,269 | -23.56 | 2,259 | -19.59 | ||||
| 2025-08-12 | 13F | Jpmorgan Chase & Co | 11,741 | 18.05 | 864 | 28.00 | ||||
| 2025-08-14 | 13F | UBS Group AG | 160,630 | 0.60 | 11,826 | 9.09 | ||||
| 2025-08-14 | 13F | Financial Advisory Service, Inc. | 334 | 0.00 | 25 | 9.09 | ||||
| 2025-08-08 | 13F | Capital Investment Advisory Services, LLC | 1,119 | 0.00 | 82 | 9.33 | ||||
| 2025-04-21 | 13F | ORG Partners LLC | 0 | -100.00 | 0 | |||||
| 2025-08-13 | 13F | Capital Analysts, Inc. | 298 | 0.00 | 0 | |||||
| 2025-08-01 | 13F | Bessemer Group Inc | 1,108 | 0.00 | 0 | |||||
| 2025-08-14 | 13F | Daiwa Securities Group Inc. | 30,350 | -6.47 | 2 | 0.00 | ||||
| 2025-05-15 | 13F | Glenmede Trust Co Na | 2,900 | -6.45 | 197 | -2.00 | ||||
| 2025-08-06 | 13F | First Horizon Advisors, Inc. | 150 | 0.00 | 11 | 10.00 | ||||
| 2025-07-21 | 13F | HighMark Wealth Management LLC | 226 | 0.00 | 17 | 6.67 | ||||
| 2025-08-15 | 13F | CI Private Wealth, LLC | 11,958 | 93.15 | 880 | 109.52 | ||||
| 2025-08-11 | 13F | Aptus Capital Advisors, LLC | 24 | 0.00 | 2 | 0.00 | ||||
| 2025-08-13 | 13F | Baird Financial Group, Inc. | 31,279 | 38.81 | 2,303 | 50.56 | ||||
| 2025-07-31 | 13F | Conservest Capital Advisors, Inc. | 38,960 | -3.77 | 2,868 | 4.37 | ||||
| 2025-08-14 | 13F | Stifel Financial Corp | 44,478 | 672.59 | 3,274 | 739.49 | ||||
| 2025-08-06 | 13F | Ethos Financial Group, LLC | 10,726 | -1.69 | 790 | 6.62 | ||||
| 2025-08-12 | 13F | MAI Capital Management | 7,833 | 1.95 | 577 | 10.56 | ||||
| 2025-07-29 | 13F | Private Trust Co Na | 1,550 | 114 | ||||||
| 2025-08-06 | 13F | AE Wealth Management LLC | 770 | -33.91 | 57 | -29.11 | ||||
| 2025-08-18 | 13F | Geneos Wealth Management Inc. | 476 | 35 | ||||||
| 2025-04-15 | 13F | Wealthcare Advisory Partners LLC | 0 | -100.00 | 0 | |||||
| 2025-08-11 | 13F | ICICI Prudential Asset Management Co Ltd | 34,942 | 0.00 | 2,572 | 8.43 | ||||
| 2025-08-08 | 13F | Cetera Investment Advisers | 88,079 | 4.21 | 6,484 | 13.02 | ||||
| 2025-08-18 | 13F | Tyler-Stone Wealth Management | 3,122 | -26.59 | 230 | -20.49 | ||||
| 2025-08-04 | 13F | JDM Financial Group LLC | 104 | 108.00 | 8 | 133.33 | ||||
| 2025-08-14 | 13F | Principal Street Partners, LLC | 16,064 | 36.82 | 1,183 | 48.31 | ||||
| 2025-05-05 | 13F | Peterson Wealth Services | 0 | -100.00 | 0 | |||||
| 2025-07-17 | 13F | Barry Investment Advisors, LLC | 62,267 | 2.78 | 4,584 | 11.48 | ||||
| 2025-07-25 | 13F | Cwm, Llc | 1,574 | 40.41 | 0 | |||||
| 2025-08-08 | 13F | Gts Securities Llc | 0 | -100.00 | 0 | |||||
| 2025-07-11 | 13F | Mandatum Life Insurance Co Ltd | 39,588 | 24.58 | 2,914 | 35.10 | ||||
| 2025-07-21 | 13F | Ntv Asset Management Llc | 7,266 | -6.44 | 535 | 1.33 | ||||
| 2025-07-15 | 13F | BigSur Wealth Management LLC | 350 | 0.00 | 26 | 8.70 | ||||
| 2025-07-24 | 13F | Ronald Blue Trust, Inc. | 449 | 0.00 | 33 | 10.00 | ||||
| 2025-07-21 | 13F | Ameritas Advisory Services, LLC | 721 | 53 | ||||||
| 2025-08-12 | 13F | Founders Financial Alliance, LLC | 42 | -12.50 | 3 | 0.00 | ||||
| 2025-08-14 | 13F | Bank Of America Corp /de/ | 264,492 | -7.00 | 19,472 | 0.85 | ||||
| 2025-08-15 | 13F | Morgan Stanley | 292,092 | 3.49 | 21,504 | 12.22 | ||||
| 2025-08-01 | 13F | Solstein Capital, LLC | 8 | 0.00 | 1 | |||||
| 2025-07-16 | 13F | Arkansas Financial Group, Inc. | 11,152 | -3.07 | 833 | 14.42 | ||||
| 2025-08-12 | 13F | Global Retirement Partners, LLC | 87 | 155.88 | 6 | 200.00 | ||||
| 2025-08-14 | 13F | NCM Capital Management, LLC | 5,001 | 0.00 | 368 | 8.55 | ||||
| 2025-07-16 | 13F | St Germain D J Co Inc | 750 | 0.00 | 55 | 10.00 | ||||
| 2025-08-12 | 13F | BlackRock, Inc. | 3,426 | 0.00 | 252 | 8.62 | ||||
| 2025-08-14 | 13F | Ancora Advisors, LLC | 350 | 0.00 | 26 | 8.70 | ||||
| 2025-08-14 | 13F | Guardian Wealth Advisors, Llc / Nc | 9 | 0.00 | 1 | |||||
| 2025-08-08 | 13F | SBI Securities Co., Ltd. | 1,658 | -7.43 | 122 | 0.83 | ||||
| 2025-07-30 | 13F | Brookstone Capital Management | 5,636 | 5.01 | 415 | 13.74 | ||||
| 2025-07-16 | 13F | ORG Wealth Partners, LLC | 77 | 0.00 | 6 | 0.00 | ||||
| 2025-07-24 | 13F | Us Bancorp \de\ | 23,905 | -0.17 | 1,760 | 8.25 | ||||
| 2025-08-13 | 13F | Rsm Us Wealth Management Llc | 3,966 | 0.00 | 292 | 8.18 | ||||
| 2025-07-08 | 13F | Lowe Wealth Advisors, LLC | 200 | 0.00 | 15 | 7.69 | ||||
| 2025-08-05 | 13F | Carolinas Wealth Consulting Llc | 0 | -100.00 | 0 | -100.00 | ||||
| 2025-08-08 | 13F | Citizens Financial Group Inc/ri | 9,446 | 0.00 | 695 | 8.42 | ||||
| 2025-07-08 | 13F | Parallel Advisors, LLC | 570 | 0.00 | 42 | 7.89 | ||||
| 2025-08-12 | 13F | Coldstream Capital Management Inc | 0 | -100.00 | 0 | |||||
| 2025-08-11 | 13F | Nomura Asset Management Co Ltd | 100 | 0.00 | 7 | 16.67 | ||||
| 2025-08-12 | 13F | Franklin Resources Inc | 5,037 | 0.00 | 371 | 8.50 | ||||
| 2025-07-31 | 13F | Cambridge Investment Research Advisors, Inc. | 4,992 | 7.01 | 0 | |||||
| 2025-08-04 | 13F | Arkadios Wealth Advisors | 5,950 | 4.39 | 438 | 13.47 | ||||
| 2025-07-28 | 13F | Copia Wealth Management | 40 | 3 | ||||||
| 2025-08-15 | 13F | Equitable Holdings, Inc. | 8,992 | 107.05 | 662 | 124.83 | ||||
| 2025-07-28 | 13F | Alpine Woods Capital Investors, Llc | 3,000 | 0.00 | 221 | 8.37 | ||||
| 2025-08-13 | 13F | Cerity Partners LLC | 4,691 | 345 | ||||||
| 2025-07-17 | 13F | Fifth Third Securities, Inc. | 7,492 | 2.31 | 552 | 10.87 | ||||
| 2025-07-30 | 13F | Cullen/frost Bankers, Inc. | 31,000 | 0.00 | 2,282 | 8.46 | ||||
| 2025-07-10 | 13F | Sovran Advisors, LLC | 7,287 | 29.06 | 545 | 46.24 | ||||
| 2025-08-19 | 13F | Anchor Investment Management, LLC | 2,544 | 0.00 | 187 | 8.72 | ||||
| 2025-07-17 | 13F | Sound Income Strategies, LLC | 243 | 0.00 | 18 | 6.25 | ||||
| 2025-08-12 | 13F | Howe & Rusling Inc | 100 | 7 | ||||||
| 2025-07-24 | 13F | Blair William & Co/il | 8,173 | 3.81 | 602 | 12.55 | ||||
| 2025-08-14 | 13F | Old Mission Capital Llc | 18,260 | 1,344 | ||||||
| 2025-07-18 | 13F | O'ROURKE & COMPANY, Inc | 4,402 | -25.72 | 324 | -19.40 | ||||
| 2025-08-11 | 13F | Private Advisor Group, LLC | 6,422 | -4.80 | 473 | 3.28 | ||||
| 2025-07-31 | 13F | Money Design Co.,Ltd. | 90,243 | -7.17 | 7 | 0.00 | ||||
| 2025-08-12 | 13F | LPL Financial LLC | 218,449 | 51.43 | 16,082 | 64.22 | ||||
| 2025-07-29 | 13F | JTC Employer Solutions Trusteee Ltd | 1,802 | 0.00 | 0 | |||||
| 2025-08-14 | 13F | Oxford Financial Group Ltd | 415 | 0.00 | 31 | 7.14 | ||||
| 2025-07-09 | 13F | First Financial Corp /in/ | 4,000 | 0.00 | 294 | 8.49 | ||||
| 2025-07-29 | 13F | Mb, Levis & Associates, Llc | 16 | 0.00 | 1 | 0.00 | ||||
| 2025-08-27 | NP | RLY - SPDR SSGA Multi-Asset Real Return ETF This fund is a listed as child fund of State Street Corp and if that institution has disclosed ownership in this security, then these positions will not be double counted when calculating total shares and total value | 85,851 | 405.72 | 6,320 | 448.61 | ||||
| 2025-08-05 | 13F | Westside Investment Management, Inc. | 866 | 20.95 | 64 | 31.25 | ||||
| 2025-08-14 | 13F | Raymond James Financial Inc | 31,336 | 1.64 | 2,307 | 10.18 | ||||
| 2025-07-11 | 13F/A | Umb Bank N A/mo | 4,472 | 0.00 | 329 | 8.58 | ||||
| 2025-07-30 | 13F | Journey Advisory Group, LLC | 5,413 | -87.52 | 399 | -86.49 | ||||
| 2025-08-13 | 13F/A | Claudia M.p. Batlle, Crp (r) Llc | 16,427 | 1,209 | ||||||
| 2025-04-30 | 13F | ARGI Investment Services, LLC | 0 | -100.00 | 0 | |||||
| 2025-08-14 | 13F | Federation des caisses Desjardins du Quebec | 3,410 | -0.06 | 251 | 8.66 | ||||
| 2025-08-04 | 13F | Linscomb & Williams, Inc. | 8,600 | 0.00 | 633 | 8.58 | ||||
| 2025-07-25 | 13F | LRI Investments, LLC | 315 | 38.16 | 23 | 53.33 | ||||
| 2025-08-14 | 13F | Citadel Advisors Llc | 9,636 | -73.07 | 709 | -70.81 | ||||
| 2025-08-14 | 13F | Citadel Advisors Llc | Put | 4,900 | 19.51 | 361 | 29.50 | |||
| 2025-08-14 | 13F | Fmr Llc | 2,606 | 31.09 | 192 | 42.54 | ||||
| 2025-08-14 | 13F | Comerica Bank | 18,815 | 3.53 | 1,385 | 12.33 | ||||
| 2025-08-08 | 13F | Pnc Financial Services Group, Inc. | 245 | 0.00 | 18 | 12.50 | ||||
| 2025-07-29 | 13F | Primoris Wealth Advisors, Llc | 53,175 | 3,915 | ||||||
| 2025-07-23 | 13F | Wormser Freres Gestion | 700 | 0.00 | 51 | 8.51 | ||||
| 2025-08-05 | 13F | Huntington National Bank | 10 | 12.50 | ||||||
| 2025-08-14 | 13F | Kovitz Investment Group Partners, LLC | 22,844 | 1,682 | ||||||
| 2025-05-19 | 13F | Heck Capital Advisors, LLC | 0 | 0 | ||||||
| 2025-08-14 | 13F | State Street Corp | 2,800 | -49.09 | 206 | -44.77 | ||||
| 2025-08-12 | 13F | Picton Mahoney Asset Management | 500 | 0.00 | 0 | |||||
| 2025-08-14 | 13F | IHT Wealth Management, LLC | 31,880 | -9.94 | 2,347 | -2.37 | ||||
| 2025-08-14 | 13F | Qube Research & Technologies Ltd | 50 | -25.37 | 4 | -25.00 | ||||
| 2025-08-13 | 13F | Mount Yale Investment Advisors, LLC | 34 | 3 | ||||||
| 2025-08-01 | 13F | Brinker Capital Investments, LLC | 0 | -100.00 | 0 | |||||
| 2025-04-22 | 13F | Castleview Partners, Llc | 0 | -100.00 | 0 | |||||
| 2025-08-07 | 13F | Commerce Bank | 12,995 | -0.57 | 957 | 7.78 |