Mga Batayang Estadistika
| Pemilik Institusional | 167 total, 163 long only, 0 short only, 4 long/short - change of 112.66% MRQ |
| Alokasi Portofolio Rata-rata | 0.0766 % - change of -81.61% MRQ |
| Saham Institusional (Jangka Panjang) | 8,254,831 (ex 13D/G) - change of 4.17MM shares 102.01% MRQ |
| Nilai Institusional (Jangka Panjang) | $ 176,491 USD ($1000) |
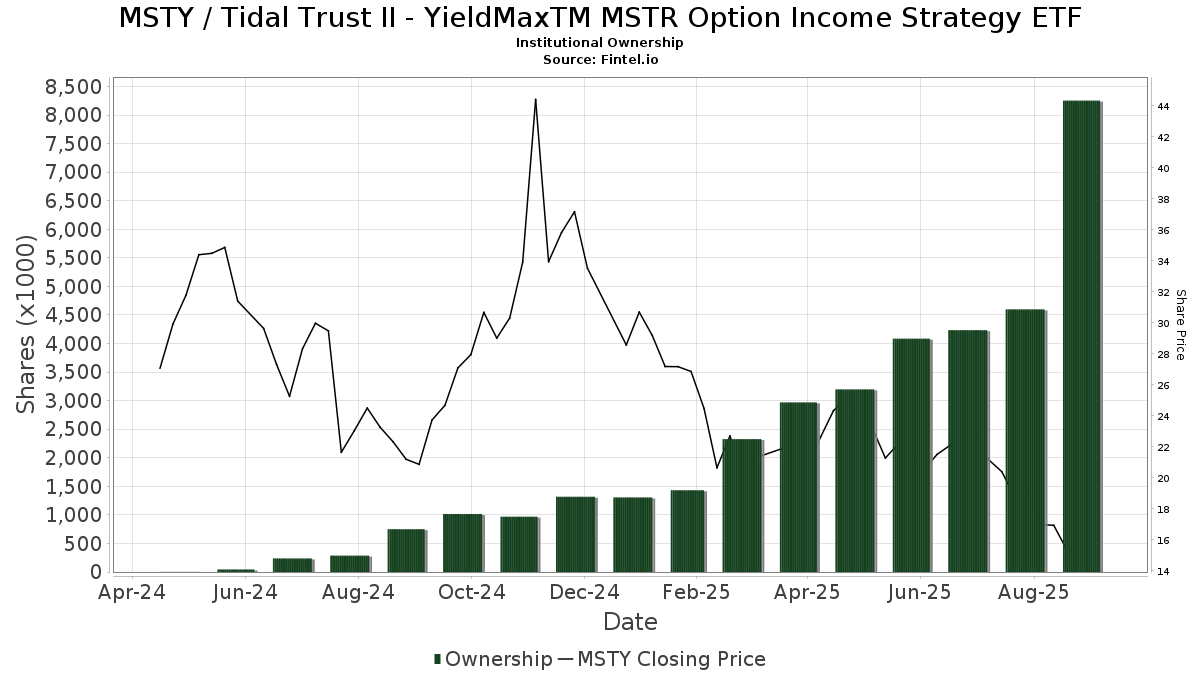
Kepemilikan Institusional dan Pemegang Saham
Tidal Trust II - YieldMaxTM MSTR Option Income Strategy ETF (US:MSTY) memiliki 167 pemilik institusional dan pemegang saham yang telah mengajukan formulir 13D/G atau 13F kepada Komisi Bursa Efek (Securities Exchange Commission/SEC). Lembaga-lembaga ini memegang total 8,254,831 saham. Pemegang saham terbesar meliputi Toroso Investments, LLC, YMAX - YieldMaxTM Universe Fund of Option Income ETFs, Citadel Advisors Llc, Susquehanna International Group, Llp, Susquehanna International Group, Llp, Private Advisor Group, LLC, Jane Street Group, Llc, Citadel Advisors Llc, Jump Financial, LLC, and Jane Street Group, Llc .
Struktur kepemilikan institusional Tidal Trust II - YieldMaxTM MSTR Option Income Strategy ETF (ARCA:MSTY) menunjukkan posisi terkini di perusahaan oleh institusi dan dana, serta perubahan terbaru dalam ukuran posisi. Pemegang saham utama dapat mencakup investor individu, reksa dana, dana lindung nilai, atau institusi. Jadwal 13D menunjukkan bahwa investor memegang (atau pernah memegang) lebih dari 5% saham perusahaan dan bermaksud (atau pernah bermaksud) untuk secara aktif mengejar perubahan strategi bisnis. Jadwal 13G menunjukkan investasi pasif lebih dari 5%.
The share price as of September 5, 2025 is 15.62 / share. Previously, on September 9, 2024, the share price was 20.53 / share. This represents a decline of 23.92% over that period.
Skor Sentimen Dana
Skor Sentimen Dana (sebelumnya dikenal sebagai Skor Akumulasi Kepemilikan) menemukan saham-saham yang paling banyak dibeli oleh dana. Ini adalah hasil dari model kuantitatif multi-faktor yang canggih yang mengidentifikasi perusahaan dengan tingkat akumulasi institusional tertinggi. Model penilaian menggunakan kombinasi dari total peningkatan pemilik yang diungkapkan, perubahan dalam alokasi portofolio pada pemilik tersebut, dan metrik lainnya. Angka berkisar dari 0 hingga 100, dengan angka yang lebih tinggi menunjukkan tingkat akumulasi yang lebih tinggi dibandingkan dengan perusahaan sejenisnya, dan 50 adalah rata-ratanya.
Frekuensi Pembaruan: Setiap Hari
Lihat Ownership Explorer, yang menyediakan daftar perusahaan dengan peringkat tertinggi.
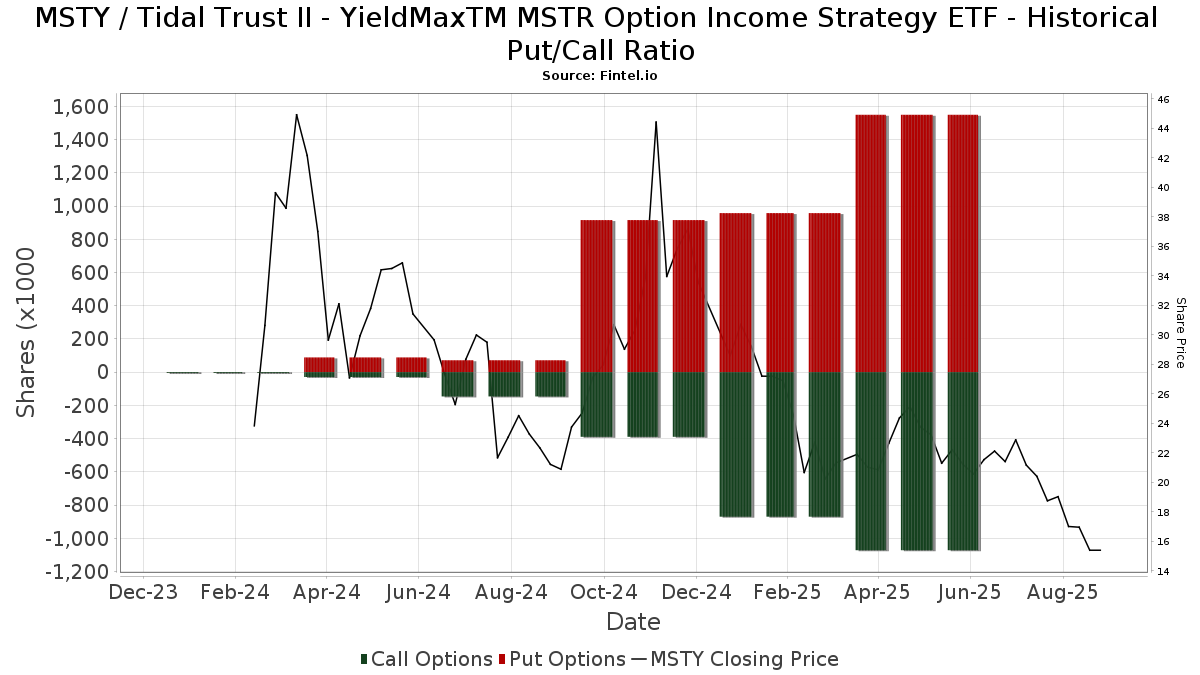
Rasio Put/Call Institusional
Selain melaporkan isu ekuitas dan utang standar, institusi dengan aset di bawah manajemen lebih dari 100 juta dolar AS juga harus mengungkapkan kepemilikan opsi put dan call mereka. Karena opsi put umumnya menunjukkan sentimen negatif, dan opsi call menunjukkan sentimen positif, kita dapat mengetahui sentimen institusional secara keseluruhan dengan memplot rasio put terhadap call. Grafik di sebelah kanan memplot rasio put/call historis untuk instrumen ini.
Menggunakan Rasio Put/Call sebagai indikator sentimen investor mengatasi salah satu kekurangan utama dari penggunaan total kepemilikan institusional, yaitu sejumlah besar aset yang dikelola diinvestasikan secara pasif untuk melacak indeks. Dana yang dikelola secara pasif biasanya tidak membeli opsi, sehingga indikator rasio put/call lebih akurat dalam melacak sentimen dana yang dikelola secara aktif.
Pengajuan 13F dan NPORT
Detail pada pengajuan 13F tersedia gratis. Detail pada pengajuan NP memerlukan keanggotaan premium. Baris berwarna hijau menunjukkan posisi baru. Baris berwarna merah menunjukkan posisi yang sudah ditutup. Klik tautan ini ikon untuk melihat riwayat transaksi selengkapnya.
Tingkatkan
untuk membuka data premium dan mengekspor ke Excel ![]() .
.
| Tanggal File | Sumber | Investor | Ketik | Presyo ng Avg (Silangan) |
Saham | Δ Saham (%) |
Dilaporkan Nilai ($1000) |
Nilai Δ (%) |
Alokasi Port (%) |
|
|---|---|---|---|---|---|---|---|---|---|---|
| 2025-07-08 | 13F | Arlington Trust Co LLC | 220 | 5 | ||||||
| 2025-07-14 | 13F | Sowell Financial Services LLC | 11,794 | 261 | ||||||
| 2025-08-05 | 13F | Lifeworks Advisors, LLC | 38,025 | 126.66 | 843 | 147.21 | ||||
| 2025-08-06 | 13F | AE Wealth Management LLC | 7,550 | 5.59 | 167 | 15.17 | ||||
| 2025-04-28 | 13F | Strategic Financial Concepts, LLC | 0 | -100.00 | 0 | -100.00 | ||||
| 2025-08-11 | 13F | HighTower Advisors, LLC | 14,265 | 316 | ||||||
| 2025-08-12 | 13F | Proequities, Inc. | 0 | 0 | ||||||
| 2025-08-06 | 13F | ZEGA Investments, LLC | 17,435 | 36.37 | 387 | 49.03 | ||||
| 2025-08-13 | 13F | Natixis | 53,065 | 23.96 | 1,165 | 32.84 | ||||
| 2025-08-27 | 13F/A | Brinker Capital Investments, LLC | 65,718 | 1,457 | ||||||
| 2025-07-14 | 13F | AdvisorNet Financial, Inc | 3,774 | -41.10 | 84 | -36.15 | ||||
| 2025-08-01 | 13F | Belvedere Trading LLC | 4,982 | -79.86 | 110 | -78.09 | ||||
| 2025-08-01 | 13F | Belvedere Trading LLC | Call | 12,900 | 5.74 | 286 | 14.92 | |||
| 2025-08-01 | 13F | Belvedere Trading LLC | Put | 20,600 | -41.14 | 457 | -35.86 | |||
| 2025-08-12 | 13F | Aspiring Ventures, LLC | 154,150 | 3,418 | ||||||
| 2025-07-15 | 13F | Financial Partners Group, Inc | 27,073 | 600 | ||||||
| 2025-08-13 | 13F | Texas Capital Bank Wealth Management Services Inc | 42,952 | 952 | ||||||
| 2025-08-14 | 13F | Harwood Advisory Group, LLC | 40 | 1 | ||||||
| 2025-07-09 | 13F | Fiduciary Alliance LLC | 75,767 | 99.42 | 1,680 | 117.49 | ||||
| 2025-08-14 | 13F | TCG Advisory Services, LLC | 13,701 | 304 | ||||||
| 2025-07-10 | 13F | Signal Advisors Wealth, LLC | 68,742 | 1,524 | ||||||
| 2025-07-16 | 13F | Instrumental Wealth, Llc | 71,133 | 61.63 | 1,593 | 53.47 | ||||
| 2025-05-15 | 13F | Dimension Capital Management Llc | 0 | -100.00 | 0 | -100.00 | ||||
| 2025-07-16 | 13F | ORG Partners LLC | 8,872 | 191 | ||||||
| 2025-07-17 | 13F | Sound Income Strategies, LLC | 1,500 | 33 | ||||||
| 2025-07-16 | 13F | Strategic Investment Solutions, Inc. /IL | 139 | 3 | ||||||
| 2025-08-14 | 13F | Private Wealth Advisors, LLC | 12,124 | 269 | ||||||
| 2025-08-12 | 13F | Change Path, LLC | 16,359 | 363 | ||||||
| 2025-08-13 | 13F | StoneX Group Inc. | 101,726 | 369.24 | 2,255 | 412.50 | ||||
| 2025-08-14 | 13F | Toroso Investments, LLC | 1,432,831 | 26.46 | 31,766 | 37.90 | ||||
| 2025-07-25 | 13F | Cwm, Llc | 121 | -73.64 | 0 | |||||
| 2025-08-14 | 13F | Susquehanna International Group, Llp | Put | 581,400 | 131.08 | 12,890 | 151.98 | |||
| 2025-08-14 | 13F | Susquehanna International Group, Llp | 536,093 | 261.98 | 11,885 | 294.85 | ||||
| 2025-08-06 | 13F | Prospera Financial Services Inc | 44,514 | 987 | ||||||
| 2025-08-14 | 13F | Susquehanna International Group, Llp | Call | 88,200 | -16.00 | 1,955 | -8.39 | |||
| 2025-08-12 | 13F | MAI Capital Management | 1,000 | 0.00 | 22 | 10.00 | ||||
| 2025-07-16 | 13F | Kiley Juergens Wealth Management, Llc | 10,785 | 239 | ||||||
| 2025-08-08 | 13F | Foundations Investment Advisors, LLC | 9,092 | 202 | ||||||
| 2025-08-13 | 13F | Beacon Pointe Advisors, LLC | 31,081 | 689 | ||||||
| 2025-08-13 | 13F | Avestar Capital, LLC | 14,900 | 330 | ||||||
| 2025-08-12 | 13F | Global Retirement Partners, LLC | 5,849 | 130 | ||||||
| 2025-08-14 | 13F | Mml Investors Services, Llc | 18,179 | -9.93 | 0 | |||||
| 2025-08-07 | 13F | CENTRAL TRUST Co | 500 | 11 | ||||||
| 2025-07-01 | 13F | Stonehearth Capital Management, LLC | 10,364 | 230 | ||||||
| 2025-08-13 | 13F | Northwestern Mutual Wealth Management Co | 46 | 1 | ||||||
| 2025-08-14 | 13F | McIlrath & Eck, LLC | 5,627 | 125 | ||||||
| 2025-07-30 | 13F | Pittenger & Anderson Inc | 680 | 15 | ||||||
| 2025-08-13 | 13F | Continuum Advisory, LLC | 0 | -100.00 | 0 | |||||
| 2025-08-04 | 13F | Hantz Financial Services, Inc. | 85 | 0 | ||||||
| 2025-08-11 | 13F | Cornerstone Planning Group LLC | 12,176 | 223 | ||||||
| 2025-07-10 | 13F | Wealth Enhancement Advisory Services, Llc | 69,034 | 77.73 | 1,442 | 82.76 | ||||
| 2025-08-14 | 13F | SIH Partners, LLLP | 108,032 | 2,395 | ||||||
| 2025-08-15 | 13F | CI Private Wealth, LLC | 44,572 | 199.24 | 988 | 227.15 | ||||
| 2025-07-14 | 13F | Proathlete Wealth Management Llc | 188 | 4 | ||||||
| 2025-08-04 | 13F | Migdal Insurance & Financial Holdings Ltd. | 0 | -100.00 | 0 | |||||
| 2025-08-06 | 13F | Legacy Investment Solutions, LLC | 12,048 | 267 | ||||||
| 2025-08-14 | 13F | Coppell Advisory Solutions LLC | 0 | -100.00 | 0 | |||||
| 2025-07-28 | 13F | BRYN MAWR TRUST Co | 6,915 | 26.23 | 153 | 37.84 | ||||
| 2025-08-14 | 13F | Visionary Wealth Advisors | 24,971 | 52.68 | 554 | 66.57 | ||||
| 2025-07-24 | 13F | PDS Planning, Inc | 13,269 | 294 | ||||||
| 2025-08-14 | 13F | Wells Fargo & Company/mn | 4 | 300.00 | 0 | |||||
| 2025-08-14 | 13F | SWAN Capital LLC | 283 | 6 | ||||||
| 2025-08-06 | 13F | Walkner Condon Financial Advisors LLC | 0 | -100.00 | 0 | |||||
| 2025-08-06 | 13F | Wedbush Securities Inc | 12,765 | 0 | ||||||
| 2025-08-11 | 13F | United Advisor Group, LLC | 20,744 | 460 | ||||||
| 2025-08-08 | 13F | Meridian Wealth Management, LLC | 20,451 | 453 | ||||||
| 2025-08-14 | 13F | Raymond James Financial Inc | 1,644 | 36 | ||||||
| 2025-04-09 | 13F | Worth Asset Management, LLC | 0 | -100.00 | 0 | |||||
| 2025-07-21 | 13F | Hilltop National Bank | 87 | 0.00 | 2 | -50.00 | ||||
| 2025-08-14 | 13F | Beaird Harris Wealth Management, LLC | 4,051 | 90 | ||||||
| 2025-08-14 | 13F | Jane Street Group, Llc | Call | 304,100 | -27.78 | 6,742 | -21.25 | |||
| 2025-08-04 | 13F | Wealth Management Associates, Inc. | 10,570 | 234 | ||||||
| 2025-07-28 | 13F | Kiker Wealth Management, LLC | 355 | 25.89 | 8 | 40.00 | ||||
| 2025-08-14 | 13F | Jane Street Group, Llc | Put | 474,700 | 49.94 | 10,524 | 63.52 | |||
| 2025-08-08 | 13F | Creative Planning | 30,689 | 680 | ||||||
| 2025-08-14 | 13F | Toronto Dominion Bank | 5,000 | 150.00 | 111 | 170.73 | ||||
| 2025-08-18 | 13F | Hollencrest Capital Management | 500 | 11 | ||||||
| 2025-08-11 | 13F | BluePath Capital Management, LLC | 54,787 | 23.47 | 1,215 | 34.59 | ||||
| 2025-08-05 | 13F | Simplex Trading, Llc | 206,692 | 68.30 | 5 | 100.00 | ||||
| 2025-05-12 | 13F | Fmr Llc | 0 | -100.00 | 0 | |||||
| 2025-07-28 | 13F | Frazier Financial Advisors, LLC | 25 | 0.00 | 1 | |||||
| 2025-08-15 | 13F | Tower Research Capital LLC (TRC) | 0 | -100.00 | 0 | -100.00 | ||||
| 2025-07-21 | 13F | Ameritas Advisory Services, LLC | 1,718 | 38 | ||||||
| 2025-08-13 | 13F | Kilter Group LLC | 150 | 3 | ||||||
| 2025-07-24 | 13F | Us Bancorp \de\ | 5,650 | 125 | ||||||
| 2025-08-12 | 13F | Jpmorgan Chase & Co | 0 | -100.00 | 0 | -100.00 | ||||
| 2025-07-30 | 13F | Evermay Wealth Management Llc | 202 | 4 | ||||||
| 2025-08-14 | 13F | Citadel Advisors Llc | Put | 474,000 | 33.56 | 10,509 | 45.64 | |||
| 2025-08-14 | 13F | TT Capital Management LLC | 83,000 | 1,843 | ||||||
| 2025-08-14 | 13F | Citadel Advisors Llc | Call | 667,600 | 101.08 | 14,801 | 119.29 | |||
| 2025-06-26 | NP | YMAX - YieldMaxTM Universe Fund of Option Income ETFs | 1,049,840 | 15.24 | 25,553 | 4.47 | ||||
| 2025-08-12 | 13F | SRS Capital Advisors, Inc. | 0 | -100.00 | 0 | -100.00 | ||||
| 2025-08-04 | 13F | Spire Wealth Management | 915 | 71.35 | 20 | 100.00 | ||||
| 2025-08-11 | 13F | Principal Securities, Inc. | 6,499 | 4,937.98 | 144 | 4,700.00 | ||||
| 2025-07-17 | 13F | Investment Research & Advisory Group, Inc. | 50 | 1 | ||||||
| 2025-07-16 | 13F | Signaturefd, Llc | 3,754 | 50.16 | 83 | 66.00 | ||||
| 2025-08-14 | 13F | Prelude Capital Management, Llc | 100,000 | 2,217 | ||||||
| 2025-08-08 | 13F | Avantax Advisory Services, Inc. | 21,263 | -3.03 | 471 | 5.84 | ||||
| 2025-07-21 | 13F | HighMark Wealth Management LLC | 123 | 3 | ||||||
| 2025-05-19 | 13F/A | Jane Street Group, Llc | 0 | -100.00 | 0 | -100.00 | ||||
| 2025-08-14 | 13F | Royal Bank Of Canada | 10,601 | 235 | ||||||
| 2025-08-14 | 13F | Citadel Advisors Llc | 0 | -100.00 | 0 | |||||
| 2025-08-15 | 13F | Captrust Financial Advisors | 15,382 | 341 | ||||||
| 2025-08-13 | 13F | BCJ Capital Management, LLC | 9,525 | 211 | ||||||
| 2025-07-10 | 13F | Redhawk Wealth Advisors, Inc. | 16,513 | 38.75 | 366 | 51.87 | ||||
| 2025-08-14 | 13F | Federation des caisses Desjardins du Quebec | 207,522 | 105.47 | 4,599 | 123.96 | ||||
| 2025-08-14 | 13F | Group One Trading, L.p. | 174,193 | -21.32 | 3,862 | -14.20 | ||||
| 2025-08-05 | 13F | Huntington National Bank | 256 | |||||||
| 2025-08-13 | 13F | Finer Wealth Management, Inc. | 14,874 | 330 | ||||||
| 2025-08-13 | 13F | Lauer Wealth, LLC | 29,845 | 579 | ||||||
| 2025-08-08 | 13F | Everett Harris & Co /ca/ | 10,555 | 234 | ||||||
| 2025-08-14 | 13F | Mariner, LLC | 25,258 | -10.91 | 560 | -2.95 | ||||
| 2025-08-01 | 13F | Winebrenner Capital Management Llc | 10,500 | 0.00 | 233 | 8.92 | ||||
| 2025-08-14 | 13F | Headlands Technologies LLC | 709 | -44.91 | 16 | -42.31 | ||||
| 2025-08-14 | 13F | UBS Group AG | 3,837 | 39.43 | 85 | 54.55 | ||||
| 2025-07-16 | 13F | Legend Financial Advisors, Inc. | 500 | 11 | ||||||
| 2025-08-12 | 13F | Maripau Wealth Management Llc | 45,852 | 1,017 | ||||||
| 2025-05-28 | 13F | Silicon Valley Capital Partners | 214 | 4 | ||||||
| 2025-08-07 | 13F | Argent Advisors, Inc. | 50,000 | 150.00 | 1,108 | 172.91 | ||||
| 2025-07-31 | 13F | Cambridge Investment Research Advisors, Inc. | 15,906 | -13.66 | 0 | |||||
| 2025-07-08 | 13F | Parallel Advisors, LLC | 667 | 15 | ||||||
| 2025-07-11 | 13F | Kapstone Financial Advisors LLC | 18,077 | 401 | ||||||
| 2025-08-18 | 13F | Geneos Wealth Management Inc. | 623 | 72.58 | 14 | 85.71 | ||||
| 2025-08-08 | 13F | Larson Financial Group LLC | 752 | 26.17 | 17 | 33.33 | ||||
| 2025-05-13 | 13F | SHEPHERD WEALTH MANAGEMENT Ltd LIABILITY Co | 0 | -100.00 | 0 | |||||
| 2025-07-30 | 13F | FNY Investment Advisers, LLC | 8,200 | 355.56 | 0 | |||||
| 2025-08-14 | 13F/A | Rockefeller Capital Management L.P. | 10,000 | 222 | ||||||
| 2025-08-14 | 13F | CoreCap Advisors, LLC | 4,838 | 2,089.14 | 107 | 2,575.00 | ||||
| 2025-07-14 | 13F | Farmers & Merchants Investments Inc | 200 | 4 | ||||||
| 2025-08-12 | 13F | Park Square Financial Group, LLC | 464 | 10 | ||||||
| 2025-08-15 | 13F | Morgan Stanley | 70,810 | 210.73 | 1,570 | 238.88 | ||||
| 2025-07-25 | 13F | Almanack Investment Partners, LLC. | 16,183 | 359 | ||||||
| 2025-07-29 | 13F | Tradewinds Capital Management, LLC | 18 | 0 | ||||||
| 2025-07-10 | 13F | Secure Asset Management, LLC | 71,072 | 1,576 | ||||||
| 2025-08-13 | 13F | Walleye Capital LLC | 20,100 | 446 | ||||||
| 2025-08-07 | 13F | Allworth Financial LP | 1,238 | 27 | ||||||
| 2025-08-14 | 13F | Mercer Global Advisors Inc /adv | 90,315 | 0.21 | 2,002 | 9.28 | ||||
| 2025-07-25 | 13F | Hemington Wealth Management | 4,189 | 0.00 | 0 | |||||
| 2025-08-11 | 13F | Private Advisor Group, LLC | 502,370 | 35.66 | 11,138 | 47.94 | ||||
| 2025-08-15 | 13F | Kestra Advisory Services, LLC | 19,371 | 429 | ||||||
| 2025-07-24 | 13F | Ulland Investment Advisors, LLC | 354 | 0 | ||||||
| 2025-07-17 | 13F | Beacon Capital Management, LLC | 336 | -13.62 | 7 | 0.00 | ||||
| 2025-08-08 | 13F | Pnc Financial Services Group, Inc. | 301,300 | 6,680 | ||||||
| 2025-07-22 | 13F | Merit Financial Group, LLC | 65,361 | 18.53 | 1,449 | 29.26 | ||||
| 2025-06-27 | NP | Tidal Trust II - YieldMax(TM) Dorsey Wright Hybrid 5 Income ETF | 0 | -100.00 | 0 | -100.00 | ||||
| 2025-06-27 | NP | Tidal Trust II - YieldMax(TM) Dorsey Wright Featured 5 Income ETF | 0 | -100.00 | 0 | -100.00 | ||||
| 2025-08-07 | 13F | Kestra Private Wealth Services, Llc | 11,567 | 256 | ||||||
| 2025-08-14 | 13F | Keebeck Wealth Management, LLC | 60,335 | 76.67 | 1,338 | 92.65 | ||||
| 2025-07-07 | 13F | Versant Capital Management, Inc | 1,155 | 26 | ||||||
| 2025-07-30 | 13F | Capital Wealth Alliance, LLC | 15,126 | 335 | ||||||
| 2025-08-13 | 13F | Jump Financial, LLC | 425,060 | 9,424 | ||||||
| 2025-08-11 | 13F | Pin Oak Investment Advisors Inc | 50 | 0 | ||||||
| 2025-05-15 | 13F | Optiver Holding B.V. | 0 | -100.00 | 0 | |||||
| 2025-08-13 | 13F | Barclays Plc | 0 | -100.00 | 0 | |||||
| 2025-08-06 | 13F | Legacy Wealth Managment, LLC/ID | 12,048 | 267 | ||||||
| 2025-07-28 | 13F | Harbour Investments, Inc. | 306 | 146.77 | 7 | 200.00 | ||||
| 2025-08-12 | 13F | Steward Partners Investment Advisory, Llc | 2,886 | 64 | ||||||
| 2025-08-14 | 13F | Old Mission Capital Llc | 270,556 | 5,998 | ||||||
| 2025-07-22 | 13F | Blue Square Asset Management, Llc | 16,000 | 355 | ||||||
| 2025-07-25 | 13F | PrairieView Partners, LLC | 412 | 0 | ||||||
| 2025-09-04 | 13F/A | Advisor Group Holdings, Inc. | 14,059 | -15.44 | 312 | -7.99 | ||||
| 2025-08-05 | 13F | Bank Of Montreal /can/ | 670 | 15 | ||||||
| 2025-08-13 | 13F | M Holdings Securities, Inc. | 12,343 | 0 | ||||||
| 2025-07-31 | 13F | Ssa Swiss Advisors Ag | 4,801 | 101 | ||||||
| 2025-08-18 | 13F | N.E.W. Advisory Services LLC | 88 | 2 | ||||||
| 2025-07-11 | 13F | Farther Finance Advisors, LLC | 27 | 125.00 | 1 | |||||
| 2025-07-18 | 13F | Precision Wealth Strategies, LLC | 9,406 | 209 | ||||||
| 2025-08-12 | 13F | Legacy Financial Group, Inc. | 12,850 | 285 | ||||||
| 2025-08-13 | 13F | EverSource Wealth Advisors, LLC | 0 | -100.00 | 0 | |||||
| 2025-07-07 | 13F | Thurston, Springer, Miller, Herd & Titak, Inc. | 100 | 0.00 | 2 | 0.00 | ||||
| 2025-08-14 | 13F | Schonfeld Strategic Advisors LLC | 9,700 | -51.50 | 215 | -47.04 | ||||
| 2025-07-31 | 13F/A | Avion Wealth | 100 | 0 | ||||||
| 2025-08-08 | 13F | CFO4Life Group, LLC | 17,594 | 390 | ||||||
| 2025-07-22 | 13F | Wealthcare Advisory Partners LLC | 11,007 | 244 | ||||||
| 2025-07-23 | 13F | Evexia Wealth Llc | 53,800 | 1,166 | ||||||
| 2025-08-12 | 13F | Clear Street Markets Llc | 3,800 | 90.00 | 84 | 110.00 | ||||
| 2025-07-09 | 13F | Dynamic Advisor Solutions LLC | 29,991 | 22.89 | 665 | 33.87 | ||||
| 2025-08-01 | 13F | Envestnet Asset Management Inc | 92,335 | 25.41 | 2,047 | 36.83 | ||||
| 2025-07-17 | 13F | Nelson, Van Denburg & Campbell Wealth Management Group, LLC | 9,115 | 202 | ||||||
| 2025-08-14 | 13F | Ausdal Financial Partners, Inc. | 16,262 | 361 | ||||||
| 2025-08-06 | 13F | Commonwealth Equity Services, Llc | 92,418 | 668.36 | 2 | |||||
| 2025-07-22 | 13F | Team Financial Group, LLC | 487 | 11 | ||||||
| 2025-08-12 | 13F | CIBC Private Wealth Group, LLC | 1,760 | 39 | ||||||
| 2025-07-15 | 13F | Regatta Capital Group, Llc | 34,000 | 36.00 | 754 | 48.23 | ||||
| 2025-08-14 | 13F | Arete Wealth Advisors, LLC | 10,935 | 0.29 | 0 | |||||
| 2025-08-14 | 13F | Riggs Asset Managment Co. Inc. | 11 | 0 | ||||||
| 2025-08-04 | 13F | Creative Financial Designs Inc /adv | 316 | 7 | ||||||
| 2025-08-14 | 13F | Bank Of America Corp /de/ | 82,659 | 818.43 | 1,833 | 906.59 | ||||
| 2025-08-14 | 13F | Premier Financial Group | 338 | 7 | ||||||
| 2025-08-19 | 13F | Newbridge Financial Services Group, Inc. | 7,095 | 31.39 | 157 | 44.04 | ||||
| 2025-07-22 | 13F | Berger Financial Group, Inc | 12,934 | 287 | ||||||
| 2025-08-13 | 13F | Renaissance Technologies Llc | 182,800 | 4,053 | ||||||
| 2025-08-04 | 13F | Roble, Belko & Company, Inc | 15 | 0 | ||||||
| 2025-05-15 | 13F | Scientech Research LLC | 0 | -100.00 | 0 | |||||
| 2025-08-01 | 13F | Vision Financial Markets Llc | 1,021 | 139.11 | 23 | 175.00 |