Mga Batayang Estadistika
| Pemilik Institusional | 244 total, 244 long only, 0 short only, 0 long/short - change of -3.15% MRQ |
| Alokasi Portofolio Rata-rata | 0.2452 % - change of -9.95% MRQ |
| Saham Institusional (Jangka Panjang) | 54,447,775 (ex 13D/G) - change of -4.24MM shares -7.22% MRQ |
| Nilai Institusional (Jangka Panjang) | $ 454,004 USD ($1000) |
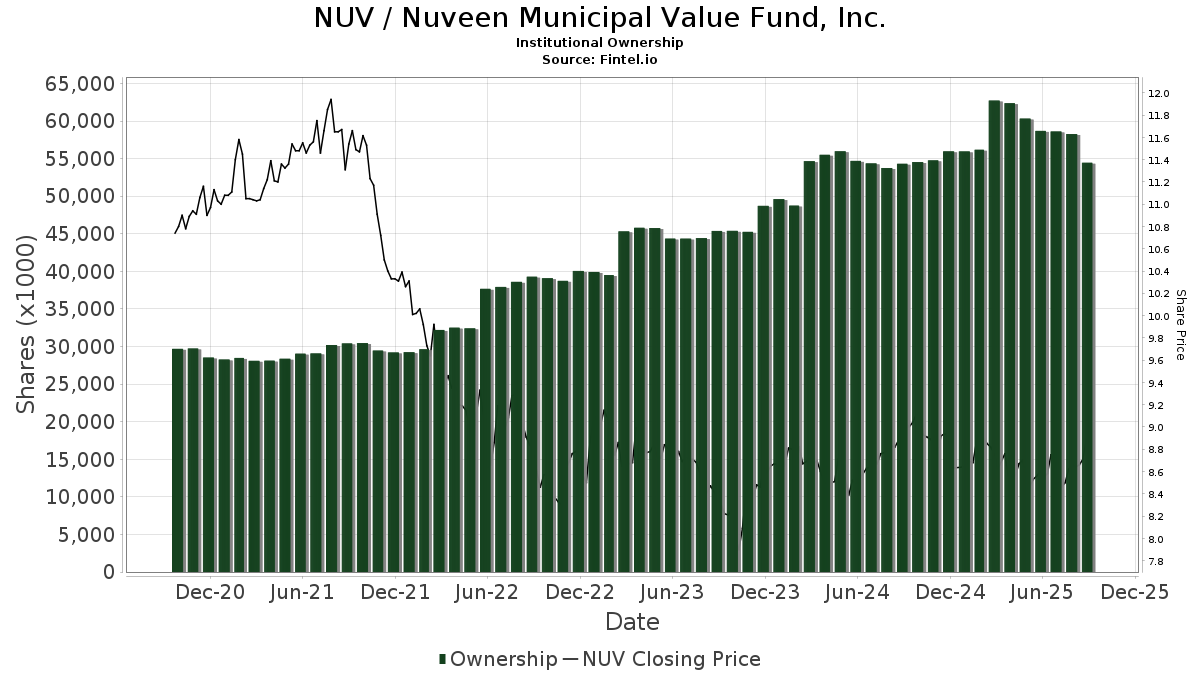
Kepemilikan Institusional dan Pemegang Saham
Nuveen Municipal Value Fund, Inc. (US:NUV) memiliki 244 pemilik institusional dan pemegang saham yang telah mengajukan formulir 13D/G atau 13F kepada Komisi Bursa Efek (Securities Exchange Commission/SEC). Lembaga-lembaga ini memegang total 54,447,775 saham. Pemegang saham terbesar meliputi UBS Group AG, Rivernorth Capital Management, Llc, Morgan Stanley, Kovitz Investment Group Partners, LLC, 1607 Capital Partners, LLC, Hennion & Walsh Asset Management, Inc., Wells Fargo & Company/mn, Raymond James Financial Inc, Guggenheim Capital Llc, and LPL Financial LLC .
Struktur kepemilikan institusional Nuveen Municipal Value Fund, Inc. (NYSE:NUV) menunjukkan posisi terkini di perusahaan oleh institusi dan dana, serta perubahan terbaru dalam ukuran posisi. Pemegang saham utama dapat mencakup investor individu, reksa dana, dana lindung nilai, atau institusi. Jadwal 13D menunjukkan bahwa investor memegang (atau pernah memegang) lebih dari 5% saham perusahaan dan bermaksud (atau pernah bermaksud) untuk secara aktif mengejar perubahan strategi bisnis. Jadwal 13G menunjukkan investasi pasif lebih dari 5%.
The share price as of September 5, 2025 is 8.77 / share. Previously, on September 9, 2024, the share price was 8.99 / share. This represents a decline of 2.45% over that period.
Skor Sentimen Dana
Skor Sentimen Dana (sebelumnya dikenal sebagai Skor Akumulasi Kepemilikan) menemukan saham-saham yang paling banyak dibeli oleh dana. Ini adalah hasil dari model kuantitatif multi-faktor yang canggih yang mengidentifikasi perusahaan dengan tingkat akumulasi institusional tertinggi. Model penilaian menggunakan kombinasi dari total peningkatan pemilik yang diungkapkan, perubahan dalam alokasi portofolio pada pemilik tersebut, dan metrik lainnya. Angka berkisar dari 0 hingga 100, dengan angka yang lebih tinggi menunjukkan tingkat akumulasi yang lebih tinggi dibandingkan dengan perusahaan sejenisnya, dan 50 adalah rata-ratanya.
Frekuensi Pembaruan: Setiap Hari
Lihat Ownership Explorer, yang menyediakan daftar perusahaan dengan peringkat tertinggi.
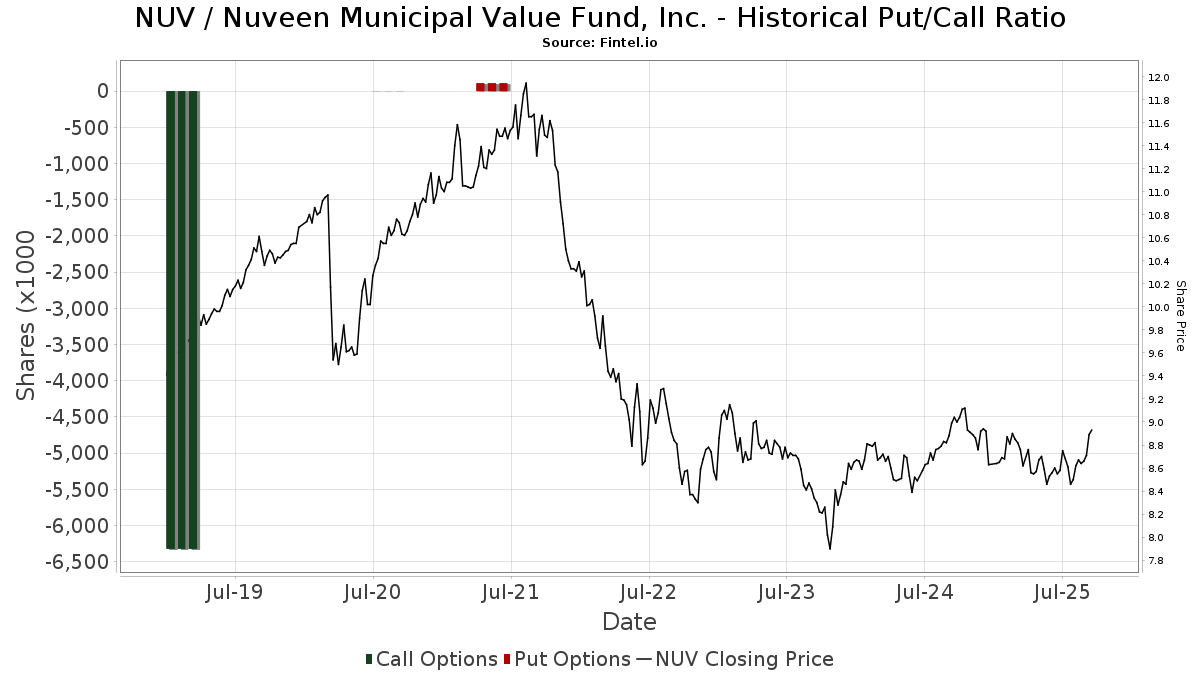
Rasio Put/Call Institusional
Selain melaporkan isu ekuitas dan utang standar, institusi dengan aset di bawah manajemen lebih dari 100 juta dolar AS juga harus mengungkapkan kepemilikan opsi put dan call mereka. Karena opsi put umumnya menunjukkan sentimen negatif, dan opsi call menunjukkan sentimen positif, kita dapat mengetahui sentimen institusional secara keseluruhan dengan memplot rasio put terhadap call. Grafik di sebelah kanan memplot rasio put/call historis untuk instrumen ini.
Menggunakan Rasio Put/Call sebagai indikator sentimen investor mengatasi salah satu kekurangan utama dari penggunaan total kepemilikan institusional, yaitu sejumlah besar aset yang dikelola diinvestasikan secara pasif untuk melacak indeks. Dana yang dikelola secara pasif biasanya tidak membeli opsi, sehingga indikator rasio put/call lebih akurat dalam melacak sentimen dana yang dikelola secara aktif.
Pengajuan 13F dan NPORT
Detail pada pengajuan 13F tersedia gratis. Detail pada pengajuan NP memerlukan keanggotaan premium. Baris berwarna hijau menunjukkan posisi baru. Baris berwarna merah menunjukkan posisi yang sudah ditutup. Klik tautan ini ikon untuk melihat riwayat transaksi selengkapnya.
Tingkatkan
untuk membuka data premium dan mengekspor ke Excel ![]() .
.
| Tanggal File | Sumber | Investor | Ketik | Presyo ng Avg (Silangan) |
Saham | Δ Saham (%) |
Dilaporkan Nilai ($1000) |
Nilai Δ (%) |
Alokasi Port (%) |
|
|---|---|---|---|---|---|---|---|---|---|---|
| 2025-08-01 | 13F | James Investment Research Inc | 54,116 | 0.00 | 470 | -0.84 | ||||
| 2025-07-25 | 13F | Dynamic Financial Group | 153,522 | 47.53 | 1,334 | 46.27 | ||||
| 2025-08-13 | 13F | Millstone Evans Group, LLC | 500 | 0.00 | 4 | 0.00 | ||||
| 2025-08-01 | 13F | Oarsman Capital, Inc. | 10,692 | -17.39 | 93 | -18.58 | ||||
| 2025-08-14 | 13F | Hilltop Holdings Inc. | 72,066 | 3.42 | 626 | 2.45 | ||||
| 2025-07-24 | 13F | IFP Advisors, Inc | 20,941 | 0.21 | 182 | -1.09 | ||||
| 2025-08-08 | 13F | Tortoise Investment Management, LLC | 765,156 | -43.73 | 6,649 | -44.24 | ||||
| 2025-08-06 | 13F | SOUTH STATE Corp | 6,718 | 58 | ||||||
| 2025-07-09 | 13F | Wolff Financial Management Llc | 11,956 | 1.12 | 0 | |||||
| 2025-07-11 | 13F | Lantz Financial LLC | 22,947 | 0.00 | 199 | -1.00 | ||||
| 2025-07-18 | 13F | Access Financial Services, Inc. | 0 | -100.00 | 0 | |||||
| 2025-07-31 | 13F/A | Avion Wealth | 462 | 0.00 | 0 | |||||
| 2025-08-14 | 13F | GWM Advisors LLC | 25,163 | 2.83 | 219 | 1.87 | ||||
| 2025-08-05 | 13F | Corps Capital Advisors, LLC | 23,500 | 0.00 | 204 | -0.97 | ||||
| 2025-08-14 | 13F | Staley Capital Advisers Inc | 24,500 | 0.00 | 213 | -0.93 | ||||
| 2025-07-29 | 13F | Uhlmann Price Securities, Llc | 13,497 | 0.39 | 117 | 0.00 | ||||
| 2025-07-07 | 13F | Wesbanco Bank Inc | 18,157 | 0.00 | 158 | -1.26 | ||||
| 2025-07-17 | 13F | Sound Income Strategies, LLC | 4,035 | 0.00 | 35 | 0.00 | ||||
| 2025-07-31 | 13F | Moloney Securities Asset Management, LLC | 12,039 | -45.37 | 105 | -46.11 | ||||
| 2025-08-12 | 13F | Global Retirement Partners, LLC | 1,942 | 1.89 | 17 | 0.00 | ||||
| 2025-04-14 | 13F | Old National Bancorp /in/ | 0 | -100.00 | 0 | |||||
| 2025-07-11 | 13F | Coastwise Capital Group, LLC | 12,917 | 0.00 | 112 | -0.88 | ||||
| 2025-07-24 | 13F | Accredited Investor Services, Llc | 105,301 | 0.00 | 915 | -0.87 | ||||
| 2025-08-07 | 13F | Hennion & Walsh Asset Management, Inc. | 1,917,495 | 11.29 | 16,663 | 10.28 | ||||
| 2025-08-14 | 13F | Dagco, Inc. | 4,806 | 1.12 | 42 | 0.00 | ||||
| 2025-08-11 | 13F | Principal Securities, Inc. | 0 | -100.00 | 0 | |||||
| 2025-07-14 | 13F | Sowell Financial Services LLC | 11,761 | 9.29 | 102 | 8.51 | ||||
| 2025-08-14 | 13F | Rock Point Advisors, LLC | 13,250 | 0.00 | 115 | -0.86 | ||||
| 2025-08-15 | 13F | Equitable Holdings, Inc. | 14,110 | 0.12 | 123 | -0.81 | ||||
| 2025-07-10 | 13F | PMV Capital Advisers, LLC | 2,178 | 1.11 | 19 | 0.00 | ||||
| 2025-07-11 | 13F | Seacrest Wealth Management, Llc | 25,878 | -0.29 | 225 | -1.32 | ||||
| 2025-08-13 | 13F | Cary Street Partners Financial Llc | 23,465 | 0.00 | 204 | -0.98 | ||||
| 2025-07-09 | 13F | Breakwater Capital Group | 89,998 | -31.38 | 782 | -32.00 | ||||
| 2025-08-12 | 13F | Steward Partners Investment Advisory, Llc | 90,837 | -18.13 | 789 | -18.91 | ||||
| 2025-08-15 | 13F | Tower Research Capital LLC (TRC) | 19 | 216.67 | 0 | |||||
| 2025-08-12 | 13F | Proequities, Inc. | 0 | 0 | ||||||
| 2025-08-15 | 13F | Kestra Advisory Services, LLC | 125,689 | 0.25 | 1,092 | -0.64 | ||||
| 2025-07-31 | 13F | Cambridge Investment Research Advisors, Inc. | 395,558 | -10.74 | 3 | 0.00 | ||||
| 2025-08-07 | 13F | Ibex Wealth Advisors | 178,728 | -0.64 | 1,553 | -1.52 | ||||
| 2025-08-14 | 13F | Gould Capital, LLC | 1,550 | 0.00 | 13 | 0.00 | ||||
| 2025-07-23 | 13F | Venturi Wealth Management, LLC | 92,765 | 0.20 | 806 | -0.62 | ||||
| 2025-08-13 | 13F | Brown Advisory Inc | 32,674 | -25.70 | 284 | -26.49 | ||||
| 2025-08-15 | 13F | Captrust Financial Advisors | 33,947 | 65.02 | 295 | 63.89 | ||||
| 2025-08-15 | 13F | CI Private Wealth, LLC | 33,491 | 99.87 | 291 | 99.32 | ||||
| 2025-08-27 | NP | HCIMX - The Intermediate Term Municipal Bond Portfolio HC Strategic Shares | 101,974 | 0.00 | 886 | -0.89 | ||||
| 2025-04-30 | 13F | Sofos Investments, Inc. | 2,000 | 18 | ||||||
| 2025-05-12 | 13F | Sandy Spring Bank | 750 | 0.00 | 7 | 0.00 | ||||
| 2025-08-13 | 13F | StoneX Group Inc. | 14,143 | -4.95 | 123 | -5.38 | ||||
| 2025-08-14 | 13F/A | Rockefeller Capital Management L.P. | 491,082 | 25.66 | 4,268 | 24.51 | ||||
| 2025-07-18 | 13F | Bartlett & Co. Wealth Management Llc | 1,830 | 0.00 | 16 | -6.25 | ||||
| 2025-07-17 | 13F | Venture Visionary Partners LLC | 13,032 | -39.48 | 113 | -39.89 | ||||
| 2025-08-06 | 13F | Aspect Partners, LLC | 1,000 | 0.00 | 9 | 0.00 | ||||
| 2025-07-17 | 13F | Janney Montgomery Scott LLC | 142,681 | -7.60 | 1 | 0.00 | ||||
| 2025-08-07 | 13F | CENTRAL TRUST Co | 25,183 | -3.32 | 219 | -4.39 | ||||
| 2025-08-28 | NP | RiverNorth Managed Duration Municipal Income Fund II, Inc. | 754,880 | -12.30 | 6,560 | -13.10 | ||||
| 2025-08-04 | 13F | Wealth Management Associates, Inc. | 14,403 | -2.26 | 125 | -3.10 | ||||
| 2025-05-14 | 13F | Clarity Asset Management, Inc. | 0 | -100.00 | 0 | |||||
| 2025-08-14 | 13F | Goldman Sachs Group Inc | 12,992 | 2.36 | 113 | 0.90 | ||||
| 2025-07-25 | 13F | We Are One Seven, LLC | 26,648 | -28.52 | 232 | -29.14 | ||||
| 2025-08-12 | 13F | TCTC Holdings, LLC | 4,265 | 0.00 | 37 | 0.00 | ||||
| 2025-08-14 | 13F | Jane Street Group, Llc | 11,630 | 101 | ||||||
| 2025-04-15 | 13F | Fifth Third Bancorp | 0 | -100.00 | 0 | |||||
| 2025-07-29 | 13F | Disciplined Investments, LLC | 60,402 | 0.83 | 525 | -0.19 | ||||
| 2025-07-17 | 13F | Melfa Wealth Management, Llc | 40,619 | 0.00 | 353 | -1.12 | ||||
| 2025-04-29 | 13F | Bank of New York Mellon Corp | 0 | -100.00 | 0 | |||||
| 2025-08-13 | 13F | Johnson Financial Group, Inc. | 41,500 | -42.76 | 362 | -43.42 | ||||
| 2025-08-01 | 13F | Envestnet Asset Management Inc | 32,544 | 6.60 | 283 | 5.62 | ||||
| 2025-08-12 | 13F | LPL Financial LLC | 1,190,266 | 3.08 | 10,343 | 2.14 | ||||
| 2025-08-12 | 13F | Wayfinding Financial, LLC | 0 | -100.00 | 0 | |||||
| 2025-07-21 | 13F | Barrett & Company, Inc. | 8,445 | 0.00 | 73 | -1.35 | ||||
| 2025-08-19 | 13F | Cape Investment Advisory, Inc. | 500 | 0.00 | 4 | 0.00 | ||||
| 2025-08-08 | 13F | Hartland & Co., LLC | 43,000 | 0.00 | 374 | -1.06 | ||||
| 2025-08-14 | 13F | Robinson Capital Management, Llc | 165,384 | 1,437 | ||||||
| 2025-07-21 | 13F | Hudson Valley Investment Advisors Inc /adv | 41,215 | -14.07 | 358 | -14.76 | ||||
| 2025-08-14 | 13F | Ancora Advisors, LLC | 8,093 | -0.87 | 70 | -1.41 | ||||
| 2025-08-04 | 13F | Pinnacle Associates Ltd | 12,639 | 0.00 | 110 | -0.91 | ||||
| 2025-07-25 | 13F | Second Half Financial Partners, LLC | 29,464 | 0.00 | 256 | -0.78 | ||||
| 2025-08-07 | 13F | Kestra Private Wealth Services, Llc | 108,596 | 17.51 | 944 | 16.42 | ||||
| 2025-08-14 | 13F | Wells Fargo & Company/mn | 1,785,135 | 13.99 | 15,513 | 12.95 | ||||
| 2025-07-29 | 13F | Tradewinds Capital Management, LLC | 6,023 | 0.00 | 52 | 0.00 | ||||
| 2025-04-21 | 13F | Old Second National Bank Of Aurora | 0 | -100.00 | 0 | |||||
| 2025-08-14 | 13F | Tandem Financial, LLC | 132,065 | 0.88 | 1,152 | -0.09 | ||||
| 2025-08-04 | 13F | Mayflower Financial Advisors, LLC | 27,370 | 0.00 | 238 | -1.25 | ||||
| 2025-05-15 | 13F | Cohen & Steers, Inc. | 0 | -100.00 | 0 | |||||
| 2025-07-14 | 13F | Caitlin John, LLC | 11,000 | -29.49 | 96 | -30.15 | ||||
| 2025-07-14 | 13F | UMA Financial Services, Inc. | 14,382 | 0.43 | 125 | -0.80 | ||||
| 2025-08-14 | 13F | Principia Wealth Advisory, LLC | 9,614 | 0.00 | 84 | 1.22 | ||||
| 2025-04-17 | 13F | Nbt Bank N A /ny | 0 | -100.00 | 0 | |||||
| 2025-08-08 | 13F | Financial Gravity Companies, Inc. | 2,000 | 0.00 | 17 | 0.00 | ||||
| 2025-08-11 | 13F | Citigroup Inc | 4,370 | 0.88 | 38 | 0.00 | ||||
| 2025-08-15 | 13F | Morgan Stanley | 4,490,565 | -1.13 | 39,023 | -2.03 | ||||
| 2025-07-17 | 13F | Investment Research & Advisory Group, Inc. | 54 | 0.00 | 7 | 0.00 | ||||
| 2025-05-15 | 13F | Citadel Advisors Llc | 0 | -100.00 | 0 | |||||
| 2025-07-21 | 13F | Ameritas Advisory Services, LLC | 3,753 | 33 | ||||||
| 2025-07-31 | 13F | AlTi Global, Inc. | 132,210 | -23.59 | 1,149 | -24.62 | ||||
| 2025-07-16 | 13F | True North Advisors, LLC | 412,922 | -19.16 | 3,588 | -19.89 | ||||
| 2025-07-28 | 13F/A | Penbrook Management LLC | 20,000 | 0.00 | 174 | -1.14 | ||||
| 2025-08-06 | 13F | Commonwealth Equity Services, Llc | 417,171 | -1.80 | 4 | 0.00 | ||||
| 2025-08-11 | 13F | Capital Square, LLC | 44,486 | -0.00 | 386 | -1.03 | ||||
| 2025-08-28 | NP | Rivernorth Opportunities Fund, Inc. | 871,367 | -43.59 | 7,572 | -44.11 | ||||
| 2025-07-25 | NP | PMSAX - Global Multi-Strategy Fund Class A | 14,992 | 0.00 | 128 | -3.76 | ||||
| 2025-07-29 | 13F | Chicago Partners Investment Group LLC | 784,377 | -0.58 | 6,636 | -3.32 | ||||
| 2025-05-08 | 13F | Private Advisory Group LLC | 0 | -100.00 | 0 | |||||
| 2025-08-27 | NP | ROBAX - Robinson Tax Advantaged Income Fund Class A Shares | 165,384 | 1,437 | ||||||
| 2025-08-14 | 13F | Benjamin Edwards Inc | 19,400 | 0.00 | 169 | -1.18 | ||||
| 2025-08-04 | 13F | Saxony Capital Management, LLC | 14,250 | 0.00 | 124 | -0.81 | ||||
| 2025-08-08 | 13F | Good Life Advisors, LLC | 42,700 | 1.06 | 371 | 0.27 | ||||
| 2025-07-29 | 13F | Regions Financial Corp | 0 | -100.00 | 0 | |||||
| 2025-08-14 | 13F | Federation des caisses Desjardins du Quebec | 1,000 | 0.00 | 9 | 0.00 | ||||
| 2025-08-12 | 13F | Coldstream Capital Management Inc | 0 | -100.00 | 0 | |||||
| 2025-08-12 | 13F | Franklin Resources Inc | 13,060 | 113 | ||||||
| 2025-08-19 | 13F | Anchor Investment Management, LLC | 436 | 0.46 | 4 | 0.00 | ||||
| 2025-08-14 | 13F | UBS Group AG | 6,915,017 | 0.47 | 60,091 | -0.45 | ||||
| 2025-08-11 | 13F | Shufro Rose & Co Llc | 10,000 | 0.00 | 88 | 0.00 | ||||
| 2025-08-14 | 13F | Bank Of America Corp /de/ | 925,266 | -2.34 | 8,041 | -3.23 | ||||
| 2025-07-08 | 13F | Ransom Advisory, Ltd | 0 | -100.00 | 0 | |||||
| 2025-07-29 | 13F | Oxbow Advisors, LLC | 14,839 | 0.00 | 129 | -1.54 | ||||
| 2025-08-13 | 13F | Rsm Us Wealth Management Llc | 11,938 | 104 | ||||||
| 2025-07-11 | 13F | Busey Wealth Management | 21,755 | 0.00 | 189 | -0.53 | ||||
| 2025-07-31 | 13F | Optimum Investment Advisors | 43,700 | -22.24 | 380 | -22.97 | ||||
| 2025-09-04 | 13F/A | Advisor Group Holdings, Inc. | 186,936 | 37.90 | 1,625 | 36.70 | ||||
| 2025-07-15 | 13F | Sightline Wealth Advisors, LLC | 13,099 | -21.00 | 114 | -22.07 | ||||
| 2025-08-28 | NP | RiverNorth Opportunistic Municipal Income Fund, Inc. | 255,572 | -12.34 | 2,221 | -13.15 | ||||
| 2025-07-28 | 13F | Eq Wealth Advisors, Llc | 5,138 | 0.37 | 45 | 0.00 | ||||
| 2025-08-14 | 13F | Van Eck Associates Corp | 1,000,623 | 0.53 | 9 | 0.00 | ||||
| 2025-08-28 | NP | RiverNorth Flexible Municipal Income Fund II, Inc. | 975,797 | -21.96 | 8,480 | -22.67 | ||||
| 2025-07-10 | 13F | High Net Worth Advisory Group LLC | 70,000 | 7.69 | 608 | 6.67 | ||||
| 2025-07-29 | 13F | Private Trust Co Na | 5,723 | 0.00 | 50 | -2.00 | ||||
| 2025-08-14 | 13F | Mariner, LLC | 46,929 | -9.26 | 408 | -10.15 | ||||
| 2025-08-12 | 13F | Virtu Financial LLC | 0 | -100.00 | 0 | |||||
| 2025-08-13 | 13F | Russell Investments Group, Ltd. | 575 | 0.00 | 5 | -20.00 | ||||
| 2025-08-14 | 13F | Westchester Capital Management, LLC | 59,644 | 0.00 | 518 | -0.96 | ||||
| 2025-07-22 | 13F | DAVENPORT & Co LLC | 47,239 | 0.00 | 411 | -0.97 | ||||
| 2025-07-30 | 13F | D.a. Davidson & Co. | 16,972 | 147 | ||||||
| 2025-08-14 | 13F | Hurley Capital, LLC | 5,000 | 0.00 | 43 | 0.00 | ||||
| 2025-08-08 | 13F | City Of London Investment Management Co Ltd | 101,974 | -20.45 | 886 | -21.17 | ||||
| 2025-08-14 | 13F | Royal Bank Of Canada | 556,349 | 9.21 | 4,834 | 8.19 | ||||
| 2025-07-22 | 13F | Valley National Advisers Inc | 1,000 | 0 | ||||||
| 2025-07-17 | 13F | Beacon Capital Management, LLC | 257 | 1.18 | 2 | 0.00 | ||||
| 2025-07-15 | 13F | Mather Group, Llc. | 0 | -100.00 | 0 | |||||
| 2025-07-28 | 13F | Pettinga Financial Advisors, LLC | 25,688 | -3.75 | 223 | -4.70 | ||||
| 2025-07-31 | 13F | Glass Jacobson Investment Advisors llc | 0 | -100.00 | 0 | |||||
| 2025-07-31 | 13F | Oppenheimer & Co Inc | 14,988 | 0.00 | 130 | -0.76 | ||||
| 2025-08-19 | 13F | National Asset Management, Inc. | 0 | -100.00 | 0 | |||||
| 2025-08-12 | 13F | Wealthbridge Capital Management, Llc | 31,710 | -22.47 | 276 | -23.18 | ||||
| 2025-08-08 | 13F | Creative Planning | 19,029 | -11.50 | 165 | -12.23 | ||||
| 2025-05-12 | 13F | Fmr Llc | 0 | -100.00 | 0 | |||||
| 2025-04-29 | 13F | Resources Investment Advisors, LLC. | 0 | -100.00 | 0 | -100.00 | ||||
| 2025-08-13 | 13F | Baird Financial Group, Inc. | 240,372 | 3.97 | 2,089 | 3.01 | ||||
| 2025-08-13 | 13F | Lido Advisors, LLC | 0 | -100.00 | 0 | |||||
| 2025-07-28 | 13F | Harbour Investments, Inc. | 8,507 | -10.52 | 74 | -12.05 | ||||
| 2025-07-14 | 13F | Golden State Equity Partners | 16,066 | 140 | ||||||
| 2025-08-11 | 13F | Advisor Resource Council | 0 | -100.00 | 0 | |||||
| 2025-08-11 | 13F | HighTower Advisors, LLC | 105,005 | -2.25 | 912 | -3.18 | ||||
| 2025-07-18 | 13F | Trust Co Of Vermont | 0 | -100.00 | 0 | |||||
| 2025-04-21 | 13F | ORG Partners LLC | 0 | -100.00 | 0 | |||||
| 2025-07-23 | 13F | Prime Capital Investment Advisors, LLC | 19,516 | -20.37 | 170 | -21.03 | ||||
| 2025-05-08 | 13F | Essential Planning, LLC. | 0 | -100.00 | 0 | |||||
| 2025-08-12 | 13F | CIBC Private Wealth Group, LLC | 30,264 | 0.00 | 263 | 1.55 | ||||
| 2025-07-22 | 13F | Fortitude Advisory Group L.L.C. | 43,488 | 0.00 | 378 | 1.62 | ||||
| 2025-08-14 | 13F | Icon Wealth Advisors, LLC | 21,518 | 0.00 | 187 | -1.06 | ||||
| 2025-05-08 | 13F | XTX Topco Ltd | 0 | -100.00 | 0 | |||||
| 2025-08-04 | 13F | Mesirow Financial Investment Management, Inc. | 49,537 | 0.21 | 430 | -0.69 | ||||
| 2025-07-23 | 13F | Element Wealth, LLC | 27,664 | 240 | ||||||
| 2025-07-28 | 13F | BRYN MAWR TRUST Co | 0 | -100.00 | 0 | |||||
| 2025-08-12 | 13F | MAI Capital Management | 34,026 | 4.14 | 296 | 3.15 | ||||
| 2025-07-24 | 13F | Us Bancorp \de\ | 1,000 | 0.00 | 9 | 0.00 | ||||
| 2025-07-29 | 13F | Stratos Wealth Partners, LTD. | 44,225 | 10.88 | 384 | 10.03 | ||||
| 2025-05-14 | 13F | Summit Financial Wealth Advisors, LLC | 105,797 | -0.19 | 928 | -0.75 | ||||
| 2025-08-28 | NP | RiverNorth Managed Duration Municipal Income Fund, Inc. | 1,013,114 | -9.53 | 8,804 | -10.37 | ||||
| 2025-07-24 | 13F | Coordinated Financial Services, Inc. | 10,000 | 87 | ||||||
| 2025-08-13 | 13F | Jones Financial Companies Lllp | 431,719 | 72.83 | 3,747 | 71.49 | ||||
| 2025-08-07 | 13F | Summit X, LLC | 24,391 | -45.53 | 212 | -46.17 | ||||
| 2025-07-18 | 13F | Truist Financial Corp | 30,646 | -3.26 | 266 | -3.97 | ||||
| 2025-07-01 | 13F | Harbor Investment Advisory, Llc | 37,600 | -2.59 | 327 | -3.55 | ||||
| 2025-07-22 | 13F | IVC Wealth Advisors LLC | 12,845 | 0.00 | 112 | -0.89 | ||||
| 2025-08-14 | 13F | Broyhill Asset Management | 303,568 | -39.79 | 2,638 | -40.33 | ||||
| 2025-08-26 | NP | WCERX - WCM Alternatives: Event-Driven Fund - Investor Class Shares | 42,616 | 0.00 | 370 | -0.80 | ||||
| 2025-07-31 | 13F | Buckingham Strategic Partners | 22,913 | 199 | ||||||
| 2025-08-06 | 13F | Atlantic Union Bankshares Corp | 750 | 7 | ||||||
| 2025-08-14 | 13F | Comerica Bank | 22,511 | 9.75 | 196 | 8.94 | ||||
| 2025-08-12 | 13F | Jacobi Capital Management LLC | 27,274 | 237 | ||||||
| 2025-04-23 | 13F | Western Wealth Management, LLC | 0 | -100.00 | 0 | -100.00 | ||||
| 2025-08-14 | 13F | CoreCap Advisors, LLC | 1,040 | -13.84 | 9 | -10.00 | ||||
| 2025-07-16 | 13F | Dakota Wealth Management | 15,533 | -26.47 | 135 | -27.03 | ||||
| 2025-07-17 | 13F | Sonora Investment Management Group, LLC | 15,120 | 0.00 | 131 | -0.76 | ||||
| 2025-07-30 | 13F | Cullen/frost Bankers, Inc. | 0 | -100.00 | 0 | |||||
| 2025-08-13 | 13F | Plan Group Financial, LLC | 12,978 | 113 | ||||||
| 2025-07-10 | 13F | Wealth Enhancement Advisory Services, Llc | 27,021 | 85.67 | 236 | 85.83 | ||||
| 2025-08-21 | 13F | Pathway Financial Advisers, LLC | 62,028 | -0.89 | 539 | -1.64 | ||||
| 2025-07-16 | 13F | ORG Wealth Partners, LLC | 14,773 | -25.85 | 129 | -25.86 | ||||
| 2025-07-28 | 13F | Callahan Advisors, LLC | 46,001 | -51.31 | 400 | -51.81 | ||||
| 2025-07-18 | 13F | PFG Investments, LLC | 35,829 | 1.17 | 311 | 0.32 | ||||
| 2025-07-11 | 13F | Annex Advisory Services, LLC | 11,590 | 101 | ||||||
| 2025-08-06 | 13F | Moors & Cabot, Inc. | 24,543 | 1.63 | 213 | 0.95 | ||||
| 2025-08-12 | 13F | Jpmorgan Chase & Co | 0 | -100.00 | 0 | |||||
| 2025-04-15 | 13F | Sanibel Captiva Trust Company, Inc. | 0 | -100.00 | 0 | |||||
| 2025-08-12 | 13F | Advisors Asset Management, Inc. | 355,312 | -25.02 | 3,088 | -25.70 | ||||
| 2025-08-13 | 13F | Beacon Pointe Advisors, LLC | 18,983 | 0.90 | 165 | 0.00 | ||||
| 2025-07-29 | 13F | Koshinski Asset Management, Inc. | 166,513 | -0.84 | 1,447 | -1.77 | ||||
| 2025-08-07 | 13F | King Luther Capital Management Corp | 348 | 257.73 | ||||||
| 2025-08-12 | 13F | Wood Tarver Financial Group, LLC | 0 | -100.00 | 0 | |||||
| 2025-08-13 | 13F | WCG Wealth Advisors LLC | 61,180 | 0.54 | 532 | -0.38 | ||||
| 2025-08-13 | 13F | Baker Avenue Asset Management, LP | 0 | -100.00 | 0 | |||||
| 2025-07-18 | 13F | Clarity Financial LLC | 12,255 | 0.00 | 106 | -0.93 | ||||
| 2025-08-06 | 13F | Prospera Financial Services Inc | 474,774 | -1.01 | 4,126 | -1.93 | ||||
| 2025-08-08 | 13F | Cetera Investment Advisers | 110,887 | 25.95 | 964 | 24.74 | ||||
| 2025-08-28 | NP | RNDLX - RiverNorth/DoubleLine Strategic Income Fund Class R | 900,000 | -6.15 | 7,821 | -7.00 | ||||
| 2025-05-13 | 13F | NINE MASTS CAPITAL Ltd | 0 | -100.00 | 0 | |||||
| 2025-05-13 | 13F | Elequin Capital Lp | 0 | -100.00 | 0 | |||||
| 2025-08-14 | 13F | Raymond James Financial Inc | 1,771,323 | -23.24 | 15,393 | -23.95 | ||||
| 2025-08-14 | 13F | 1607 Capital Partners, LLC | 2,551,754 | -6.12 | 22,175 | -6.98 | ||||
| 2025-08-11 | 13F | Private Advisor Group, LLC | 19,580 | -2.35 | 170 | -2.86 | ||||
| 2025-05-15 | 13F | Wiley Bros.-aintree Capital, Llc | 0 | -100.00 | 0 | |||||
| 2025-05-09 | 13F | Atria Wealth Solutions, Inc. | 0 | -100.00 | 0 | |||||
| 2025-05-30 | NP | Rivernorth Marketplace Lending Corp | 0 | -100.00 | 0 | -100.00 | ||||
| 2025-07-23 | 13F | Seamount Financial Group Inc | 62,799 | 4.73 | 546 | 3.81 | ||||
| 2025-08-13 | 13F | Northwestern Mutual Wealth Management Co | 6,873 | 30.76 | 60 | 28.26 | ||||
| 2025-08-14 | 13F | Hrt Financial Lp | 0 | -100.00 | 0 | |||||
| 2025-07-11 | 13F | Marshall & Sullivan Inc /wa/ | 1,840 | 16 | ||||||
| 2025-07-22 | 13F | Investors Asset Management Of Georgia Inc /ga/ /adv | 16,250 | 0.00 | 141 | -0.70 | ||||
| 2025-08-11 | 13F | Wealthspire Advisors, LLC | 11,090 | -48.37 | 96 | -48.94 | ||||
| 2025-08-11 | 13F | Lummis Asset Management, LP | 22,000 | 0.00 | 191 | -0.52 | ||||
| 2025-08-07 | 13F | Allworth Financial LP | 86,534 | 752 | ||||||
| 2025-08-14 | 13F | Ameriprise Financial Inc | 202,819 | -15.93 | 1,762 | -16.69 | ||||
| 2025-08-15 | 13F | Provenance Wealth Advisors, LLC | 0 | -100.00 | 0 | -100.00 | ||||
| 2025-08-14 | 13F | Kovitz Investment Group Partners, LLC | 2,758,585 | 37.10 | 23,972 | 35.86 | ||||
| 2025-07-30 | 13F | BlueChip Wealth Advisors LLC | 25,445 | 0.00 | 221 | -0.90 | ||||
| 2025-08-28 | NP | RiverNorth Flexible Municipal Income Fund, Inc. | 372,588 | -8.45 | 3,238 | -9.30 | ||||
| 2025-08-04 | 13F | Spire Wealth Management | 430 | 0.00 | 4 | 0.00 | ||||
| 2025-07-17 | 13F | Independence Bank of Kentucky | 1,800 | 0.00 | 16 | 0.00 | ||||
| 2025-08-14 | 13F | Granby Capital Management, LLC | 1,100,000 | 0.00 | 9,559 | -0.91 | ||||
| 2025-07-11 | 13F | Congress Park Capital LLC | 551,632 | 9.69 | 4,794 | 8.68 | ||||
| 2025-04-11 | 13F | Radnor Capital Management, LLC | 0 | -100.00 | 0 | |||||
| 2025-07-24 | 13F | Eastern Bank | 828 | 0.00 | 7 | 0.00 | ||||
| 2025-08-11 | 13F | Teachers Insurance & Annuity Association Of America | 91,358 | 0.00 | 794 | -1.00 | ||||
| 2025-07-16 | 13F | Cresta Advisors, Ltd. | 180,840 | 0.00 | 1,572 | -0.88 | ||||
| 2025-07-16 | 13F | Signaturefd, Llc | 0 | -100.00 | 0 | |||||
| 2025-08-05 | 13F | Wellington Shields Capital Management, LLC | 50,000 | 0.00 | 434 | -0.91 | ||||
| 2025-07-22 | 13F | Mascoma Wealth Management LLC | 5,706 | 0.00 | 50 | -2.00 | ||||
| 2025-08-27 | NP | JNL SERIES TRUST - JNL/Westchester Capital Event Driven Fund (A) | 1,795 | 0.00 | 16 | 0.00 | ||||
| 2025-07-07 | 13F | Whitaker-Myers Wealth Managers, LTD. | 47,337 | 411 | ||||||
| 2025-08-14 | 13F | Sunbelt Securities, Inc. | 2,280 | 20 | ||||||
| 2025-08-06 | 13F | Modera Wealth Management, LLC | 17,359 | 0.28 | 151 | -0.66 | ||||
| 2025-05-07 | 13F | Sheaff Brock Investment Advisors, LLC | 14,600 | 0.00 | 128 | 2.40 | ||||
| 2025-07-22 | 13F | Orca Wealth Management, LLC | 20,266 | 0.95 | 176 | 0.00 | ||||
| 2025-07-25 | 13F | Cwm, Llc | 8,147 | 8.61 | 0 | |||||
| 2025-07-17 | 13F/A | Capital Investment Advisors, LLC | 34,815 | -3.56 | 303 | -4.43 | ||||
| 2025-05-15 | 13F | Nomura Holdings Inc | 0 | -100.00 | 0 | -100.00 | ||||
| 2025-08-01 | 13F | Chilton Capital Management Llc | 2,500 | 0.00 | 22 | 0.00 | ||||
| 2025-08-13 | 13F | Capital Advisors Wealth Management, LLC | 22,332 | 50.87 | 194 | 50.39 | ||||
| 2025-08-14 | 13F | Shepherd Kaplan Krochuk, Llc | 61,432 | 0.00 | 534 | -0.93 | ||||
| 2025-08-08 | 13F | Islay Capital Management, Llc | 11,500 | 0.00 | 100 | -1.00 | ||||
| 2025-08-08 | 13F | Larson Financial Group LLC | 897 | 8 | ||||||
| 2025-08-14 | 13F | Susquehanna International Group, Llp | 0 | -100.00 | 0 | |||||
| 2025-07-11 | 13F | Pinnacle Bancorp, Inc. | 26,000 | 0.00 | 226 | -1.32 | ||||
| 2025-08-11 | 13F | Rothschild Investment Llc | 13,104 | 0.00 | 114 | -0.88 | ||||
| 2025-07-31 | 13F | Nilsine Partners, LLC | 10,220 | -8.50 | 89 | -9.28 | ||||
| 2025-08-14 | 13F | Harmony Asset Management Llc | 102,500 | 7.33 | 891 | 6.33 | ||||
| 2025-07-23 | 13F | Narwhal Capital Management | 26,100 | 105.11 | 227 | 103.60 | ||||
| 2025-07-30 | 13F | FNY Investment Advisers, LLC | 400 | 0.00 | 0 | |||||
| 2025-08-01 | 13F | Petra Financial Advisors Inc | 14,038 | -9.43 | 122 | -10.37 | ||||
| 2025-08-19 | 13F | Advisory Services Network, LLC | 11,082 | 5.53 | 95 | 2.17 | ||||
| 2025-07-18 | 13F | Vicus Capital | 33,234 | 1.13 | 289 | 0.00 | ||||
| 2025-07-23 | 13F | Charter Trust Co | 295,458 | -16.37 | 2,568 | -17.14 | ||||
| 2025-08-14 | 13F | Colony Group, LLC | 61,593 | -0.09 | 535 | -0.93 | ||||
| 2025-07-23 | 13F | 1 North Wealth Services Llc | 0 | 0 | ||||||
| 2025-07-30 | 13F | Roman Butler Fullerton & Co | 224,776 | 1.14 | 1,920 | 1.16 | ||||
| 2025-08-01 | 13F | Schmidt P J Investment Management Inc | 10,854 | 0.00 | 94 | -1.05 | ||||
| 2025-08-28 | NP | RNCOX - RiverNorth Core Opportunity Fund Class R | 170,958 | -33.48 | 1,486 | -34.09 | ||||
| 2025-07-18 | 13F | Naples Global Advisors, Llc | 42,000 | 0.00 | 366 | -0.81 | ||||
| 2025-07-25 | 13F | Concurrent Investment Advisors, LLC | 89,363 | 24.69 | 777 | 23.57 | ||||
| 2025-07-23 | 13F | Citizens National Bank Trust Department | 149,175 | -6.40 | 1,296 | -7.23 | ||||
| 2025-07-28 | 13F | Fairman Group, LLC | 0 | -100.00 | 0 | |||||
| 2025-08-06 | 13F | Ethos Financial Group, LLC | 19,939 | 0.00 | 174 | 1.17 | ||||
| 2025-08-13 | 13F | Guggenheim Capital Llc | 1,550,540 | 2.84 | 13,474 | 1.90 | ||||
| 2025-08-05 | 13F | Mathes Company, Inc. | 140,000 | -3.45 | 1 | 0.00 | ||||
| 2025-07-29 | 13F | Stephens Inc /ar/ | 15,333 | -38.26 | 133 | -38.71 | ||||
| 2025-08-14 | 13F | Stifel Financial Corp | 659,535 | -2.63 | 5,731 | -3.52 | ||||
| 2025-08-13 | 13F | Smith, Moore & Co. | 142,485 | 0.76 | 1,238 | -0.16 | ||||
| 2025-05-06 | 13F | Avantax Advisory Services, Inc. | 0 | -100.00 | 0 | |||||
| 2025-07-29 | 13F | Dumont & Blake Investment Advisors Llc | 16,217 | 27.90 | 141 | 26.13 | ||||
| 2025-07-25 | 13F | Ackerman Capital Advisors, LLC | 0 | -100.00 | 0 | |||||
| 2025-07-11 | 13F | Farther Finance Advisors, LLC | 3,877 | 0.21 | 34 | 0.00 | ||||
| 2025-07-31 | 13F | Blake Schutter Theil Wealth Advisors, LLC | 128,959 | 38.90 | 1,121 | 37.59 | ||||
| 2025-08-12 | 13F | South Plains Financial, Inc. | 4,250 | 0.00 | 37 | -2.70 | ||||
| 2025-08-13 | 13F | Orleans Capital Management Corp/la | 79,325 | 0.00 | 689 | -0.86 | ||||
| 2025-08-12 | 13F | PKS Advisory Services, LLC | 91,720 | 101.80 | 797 | 100.25 | ||||
| 2025-08-14 | 13F | Rivernorth Capital Management, Llc | 5,314,276 | -31.29 | 46,181 | -31.92 | ||||
| 2025-05-14 | 13F | Landscape Capital Management, L.l.c. | 0 | -100.00 | 0 | |||||
| 2025-08-07 | 13F | Cahill Financial Advisors Inc | 0 | -100.00 | 0 | |||||
| 2025-08-12 | 13F | Horizon Kinetics Asset Management Llc | 12,350 | 0.00 | 107 | -0.93 | ||||
| 2025-08-18 | 13F | Geneos Wealth Management Inc. | 200 | 0.00 | 2 | 0.00 | ||||
| 2025-08-08 | 13F | Pnc Financial Services Group, Inc. | 29,547 | 0.00 | 257 | -1.16 | ||||
| 2025-08-07 | 13F | Flagship Wealth Advisors, Llc | 5,625 | 0.00 | 49 | -2.04 | ||||
| 2025-06-25 | NP | XMPT - VanEck Vectors CEF Municipal Income ETF | 1,001,438 | -0.90 | 8,682 | -2.36 | ||||
| 2025-05-06 | 13F | Guardian Wealth Management, Inc. | 0 | -100.00 | 0 | |||||
| 2025-08-06 | 13F | Wedbush Securities Inc | 48,349 | -5.38 | 0 |