Mga Batayang Estadistika
| Pemilik Institusional | 158 total, 157 long only, 0 short only, 1 long/short - change of 0.63% MRQ |
| Alokasi Portofolio Rata-rata | 0.2215 % - change of 17.42% MRQ |
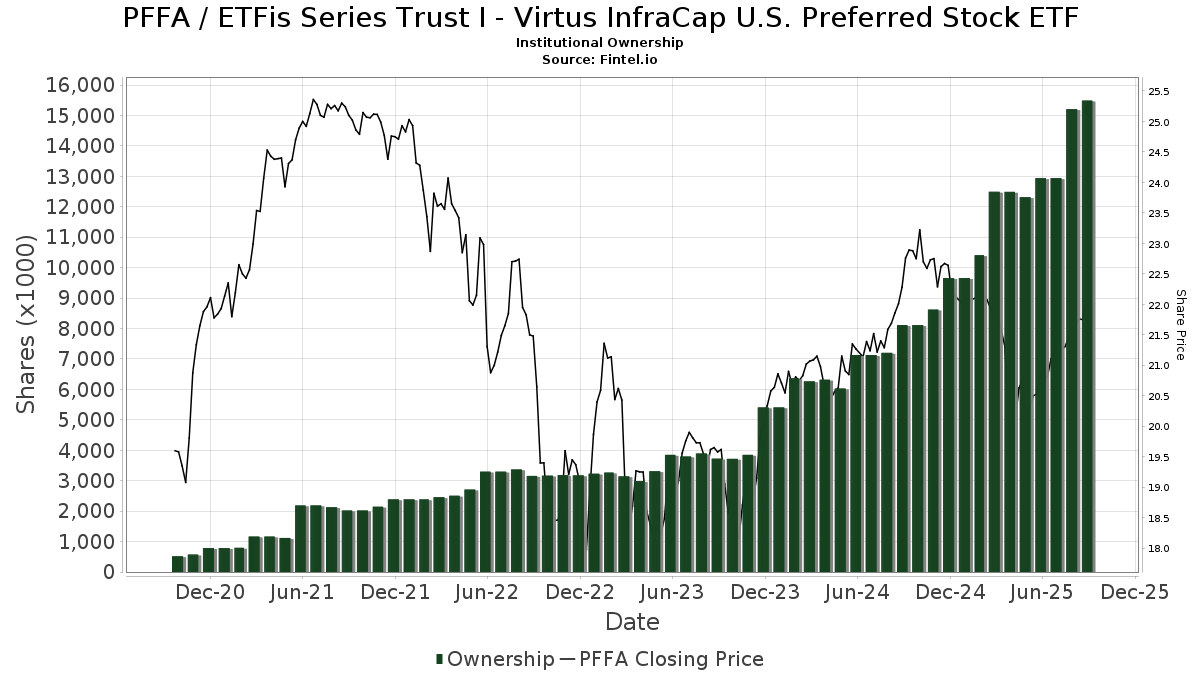
| Saham Institusional (Jangka Panjang) | 15,486,025 (ex 13D/G) - change of 2.54MM shares 19.66% MRQ |
| Nilai Institusional (Jangka Panjang) | $ 243,021 USD ($1000) |
Kepemilikan Institusional dan Pemegang Saham
ETFis Series Trust I - Virtus InfraCap U.S. Preferred Stock ETF (US:PFFA) memiliki 158 pemilik institusional dan pemegang saham yang telah mengajukan formulir 13D/G atau 13F kepada Komisi Bursa Efek (Securities Exchange Commission/SEC). Lembaga-lembaga ini memegang total 15,486,025 saham. Pemegang saham terbesar meliputi LPL Financial LLC, Kingstone Capital Partners Texas, LLC, Royal Bank Of Canada, Cambridge Investment Research Advisors, Inc., Advisor Group Holdings, Inc., Mml Investors Services, Llc, Melia Wealth LLC, Steward Partners Investment Advisory, Llc, Anderson Financial Strategies, LLC, and Equitable Holdings, Inc. .
Struktur kepemilikan institusional ETFis Series Trust I - Virtus InfraCap U.S. Preferred Stock ETF (ARCA:PFFA) menunjukkan posisi terkini di perusahaan oleh institusi dan dana, serta perubahan terbaru dalam ukuran posisi. Pemegang saham utama dapat mencakup investor individu, reksa dana, dana lindung nilai, atau institusi. Jadwal 13D menunjukkan bahwa investor memegang (atau pernah memegang) lebih dari 5% saham perusahaan dan bermaksud (atau pernah bermaksud) untuk secara aktif mengejar perubahan strategi bisnis. Jadwal 13G menunjukkan investasi pasif lebih dari 5%.
The share price as of September 5, 2025 is 21.95 / share. Previously, on September 9, 2024, the share price was 22.19 / share. This represents a decline of 1.08% over that period.
Skor Sentimen Dana
Skor Sentimen Dana (sebelumnya dikenal sebagai Skor Akumulasi Kepemilikan) menemukan saham-saham yang paling banyak dibeli oleh dana. Ini adalah hasil dari model kuantitatif multi-faktor yang canggih yang mengidentifikasi perusahaan dengan tingkat akumulasi institusional tertinggi. Model penilaian menggunakan kombinasi dari total peningkatan pemilik yang diungkapkan, perubahan dalam alokasi portofolio pada pemilik tersebut, dan metrik lainnya. Angka berkisar dari 0 hingga 100, dengan angka yang lebih tinggi menunjukkan tingkat akumulasi yang lebih tinggi dibandingkan dengan perusahaan sejenisnya, dan 50 adalah rata-ratanya.
Frekuensi Pembaruan: Setiap Hari
Lihat Ownership Explorer, yang menyediakan daftar perusahaan dengan peringkat tertinggi.
Rasio Put/Call Institusional
Selain melaporkan isu ekuitas dan utang standar, institusi dengan aset di bawah manajemen lebih dari 100 juta dolar AS juga harus mengungkapkan kepemilikan opsi put dan call mereka. Karena opsi put umumnya menunjukkan sentimen negatif, dan opsi call menunjukkan sentimen positif, kita dapat mengetahui sentimen institusional secara keseluruhan dengan memplot rasio put terhadap call. Grafik di sebelah kanan memplot rasio put/call historis untuk instrumen ini.
Menggunakan Rasio Put/Call sebagai indikator sentimen investor mengatasi salah satu kekurangan utama dari penggunaan total kepemilikan institusional, yaitu sejumlah besar aset yang dikelola diinvestasikan secara pasif untuk melacak indeks. Dana yang dikelola secara pasif biasanya tidak membeli opsi, sehingga indikator rasio put/call lebih akurat dalam melacak sentimen dana yang dikelola secara aktif.

Pengajuan 13F dan NPORT
Detail pada pengajuan 13F tersedia gratis. Detail pada pengajuan NP memerlukan keanggotaan premium. Baris berwarna hijau menunjukkan posisi baru. Baris berwarna merah menunjukkan posisi yang sudah ditutup. Klik tautan ini ikon untuk melihat riwayat transaksi selengkapnya.
Tingkatkan
untuk membuka data premium dan mengekspor ke Excel ![]() .
.
| Tanggal File | Sumber | Investor | Ketik | Presyo ng Avg (Silangan) |
Saham | Δ Saham (%) |
Dilaporkan Nilai ($1000) |
Nilai Δ (%) |
Alokasi Port (%) |
|
|---|---|---|---|---|---|---|---|---|---|---|
| 2025-08-06 | 13F | Wsfs Capital Management, Llc | 17,074 | 12.81 | 356 | 10.59 | ||||
| 2025-08-07 | 13F | Samalin Investment Counsel, LLC | 94,062 | 5.61 | 1,959 | 3.71 | ||||
| 2025-08-19 | 13F | Cape Investment Advisory, Inc. | 800 | 0.00 | 17 | 0.00 | ||||
| 2025-08-14 | 13F | Hilltop Holdings Inc. | 15,730 | 14.36 | 328 | 12.37 | ||||
| 2025-08-14 | 13F | SWAN Capital LLC | 352 | 0.00 | 7 | 0.00 | ||||
| 2025-08-11 | 13F | TD Waterhouse Canada Inc. | 5,000 | 0.00 | 104 | -0.95 | ||||
| 2025-07-24 | 13F | Us Bancorp \de\ | 0 | -100.00 | 0 | |||||
| 2025-08-13 | 13F | Fiduciary Group LLC | 17,659 | 84.18 | 368 | 80.79 | ||||
| 2025-08-08 | 13F | Foundations Investment Advisors, LLC | 244,678 | -9.05 | 5,097 | -10.69 | ||||
| 2025-08-12 | 13F | Mcdonald Partners Llc | 20,000 | 0.00 | 417 | -1.89 | ||||
| 2025-05-15 | 13F | Bank Of America Corp /de/ | 0 | -100.00 | 0 | |||||
| 2025-07-31 | 13F | Cambridge Investment Research Advisors, Inc. | 768,888 | 53.11 | 16 | 60.00 | ||||
| 2025-07-21 | 13F | Hudson Valley Investment Advisors Inc /adv | 12,000 | 0.00 | 250 | -1.97 | ||||
| 2025-08-08 | 13F | Larson Financial Group LLC | 0 | -100.00 | 0 | |||||
| 2025-05-30 | NP | ERNZ - TrueShares Active Yield ETF | 62,152 | 1,318 | ||||||
| 2025-04-09 | 13F | American National Bank | 0 | -100.00 | 0 | |||||
| 2025-08-07 | 13F | Allworth Financial LP | 8,664 | 61,785.71 | 180 | |||||
| 2025-08-08 | 13F | Wiser Advisor Group LLC | 0 | -100.00 | 0 | |||||
| 2025-08-14 | 13F | Citadel Advisors Llc | 0 | -100.00 | 0 | |||||
| 2025-08-07 | 13F | Resources Investment Advisors, LLC. | 0 | -100.00 | 0 | |||||
| 2025-07-09 | 13F | Triumph Capital Management | 21,418 | 0.07 | 446 | -1.55 | ||||
| 2025-08-01 | 13F | Pasadena Private Wealth, LLC | 41,610 | -13.83 | 867 | -15.43 | ||||
| 2025-07-14 | 13F | AdvisorNet Financial, Inc | 160,155 | 38.70 | 3,336 | 36.22 | ||||
| 2025-04-24 | 13F | Wingate Wealth Advisors, Inc. | 0 | -100.00 | 0 | |||||
| 2025-07-22 | 13F | Wealthcare Advisory Partners LLC | 43,745 | 2.02 | 911 | 0.22 | ||||
| 2025-08-13 | 13F | WCG Wealth Advisors LLC | 10,608 | 1.25 | 221 | -0.90 | ||||
| 2025-07-24 | 13F | IFP Advisors, Inc | 1,777 | -23.70 | 37 | -24.49 | ||||
| 2025-07-18 | 13F | Founders Capital Management | 1,600 | 0.00 | 33 | 0.00 | ||||
| 2025-04-21 | 13F | Nelson, Van Denburg & Campbell Wealth Management Group, LLC | 0 | -100.00 | 0 | |||||
| 2025-05-07 | 13F | Inspire Advisors, LLC | 0 | -100.00 | 0 | |||||
| 2025-07-22 | 13F | Red Door Wealth Management, LLC | 11,508 | 2.48 | 240 | 0.42 | ||||
| 2025-08-14 | 13F | Stifel Financial Corp | 262,105 | 20.46 | 5,460 | 18.31 | ||||
| 2025-07-28 | 13F | Melia Wealth LLC | 447,265 | 9,317 | ||||||
| 2025-07-31 | 13F | Oppenheimer & Co Inc | 15,788 | 10.71 | 329 | 8.61 | ||||
| 2025-07-25 | 13F | Allspring Global Investments Holdings, LLC | 36,600 | 29.79 | 762 | 27.42 | ||||
| 2025-05-14 | 13F | Jane Street Group, Llc | 0 | -100.00 | 0 | |||||
| 2025-07-30 | 13F | Whittier Trust Co | 42,491 | 0.00 | 885 | -1.78 | ||||
| 2025-08-14 | 13F/A | Rockefeller Capital Management L.P. | 11,000 | -31.25 | 229 | -32.45 | ||||
| 2025-07-31 | 13F | Darden Wealth Group Inc | 22,907 | 4.11 | 477 | 2.36 | ||||
| 2025-08-12 | 13F | Jefferies Financial Group Inc. | 131,240 | -43.33 | 2,734 | -44.35 | ||||
| 2025-04-22 | 13F | Synergy Financial Management, LLC | 0 | -100.00 | 0 | |||||
| 2025-08-14 | 13F | Wells Fargo & Company/mn | 225 | 49.01 | 5 | 33.33 | ||||
| 2025-08-08 | 13F | Cetera Investment Advisers | 111,723 | 21.31 | 2,327 | 19.15 | ||||
| 2025-08-05 | 13F | Atlas Wealth Partners, LLC | 23,550 | 3.92 | 0 | |||||
| 2025-08-11 | 13F | AXS Investments LLC | 111,610 | -22.25 | 2,325 | -23.65 | ||||
| 2025-05-02 | 13F | James Investment Research Inc | 0 | -100.00 | 0 | |||||
| 2025-08-13 | 13F | EverSource Wealth Advisors, LLC | 3,000 | 50.00 | 62 | 47.62 | ||||
| 2025-07-31 | 13F | City State Bank | 225 | 0.00 | 5 | 0.00 | ||||
| 2025-05-15 | 13F | Hrt Financial Lp | 0 | -100.00 | 0 | |||||
| 2025-05-14 | 13F | Fisher Asset Management, LLC | 0 | -100.00 | 0 | -100.00 | ||||
| 2025-08-14 | 13F | Raymond James Financial Inc | 217,302 | 18.37 | 4,526 | 16.26 | ||||
| 2025-08-14 | 13F | Infrastructure Capital Advisors, Llc | 288,471 | -16.37 | 6,009 | -17.88 | ||||
| 2025-08-13 | 13F | Smith, Moore & Co. | 109,003 | 4.49 | 2,271 | 2.62 | ||||
| 2025-05-15 | 13F | Centaurus Financial, Inc. | 0 | -100.00 | 0 | |||||
| 2025-05-06 | 13F | Bank Julius Baer & Co. Ltd, Zurich | 0 | -100.00 | 0 | |||||
| 2025-08-06 | 13F | First Horizon Advisors, Inc. | 1,250 | 0.00 | 26 | 0.00 | ||||
| 2025-07-25 | 13F | Apollon Wealth Management, LLC | 33,611 | -7.76 | 700 | -9.33 | ||||
| 2025-08-14 | 13F | Royal Bank Of Canada | 919,558 | 0.63 | 19,155 | -1.17 | ||||
| 2025-07-30 | 13F | D.a. Davidson & Co. | 21,613 | 77.07 | 450 | 74.42 | ||||
| 2025-08-25 | NP | OIOIX - AXS Income Opportunities Fund Class I | 111,610 | -22.25 | 2,325 | -23.65 | ||||
| 2025-07-22 | 13F | Belpointe Asset Management LLC | 55,759 | -11.41 | 1,161 | -13.03 | ||||
| 2025-08-13 | 13F | Capital Analysts, Inc. | 93,658 | 9.35 | 2 | 0.00 | ||||
| 2025-08-13 | 13F | Empire Financial Management Company, LLC | 51,933 | 2.38 | 1,082 | 0.56 | ||||
| 2025-07-28 | 13F | Harbour Investments, Inc. | 5,321 | -11.80 | 111 | -13.39 | ||||
| 2025-08-12 | 13F | NWF Advisory Services Inc. | 26,773 | -18.54 | 568 | -21.14 | ||||
| 2025-08-04 | 13F | Bay Colony Advisory Group, Inc d/b/a Bay Colony Advisors | 13,313 | 0.20 | 277 | -2.12 | ||||
| 2025-04-30 | 13F | Sofos Investments, Inc. | 72,555 | 1,539 | ||||||
| 2025-07-18 | 13F | Truist Financial Corp | 15,493 | 4.59 | 323 | 2.55 | ||||
| 2025-07-22 | 13F | Fortitude Advisory Group L.L.C. | 10,302 | 0.00 | 215 | 4.39 | ||||
| 2025-07-22 | 13F | Chung Wu Investment Group, LLC | 44,240 | -34.69 | 922 | -35.86 | ||||
| 2025-04-28 | 13F | Clear Creek Financial Management, LLC | 0 | -100.00 | 0 | |||||
| 2025-07-10 | 13F | Secure Asset Management, LLC | 85,729 | -53.20 | 1,786 | -54.05 | ||||
| 2025-07-08 | 13F | Parallel Advisors, LLC | 128 | 0.00 | 3 | 0.00 | ||||
| 2025-05-16 | 13F | Empowered Funds, LLC | 0 | -100.00 | 0 | |||||
| 2025-05-15 | 13F/A | Orion Portfolio Solutions, LLC | 22,377 | -3.37 | 475 | -6.51 | ||||
| 2025-07-29 | 13F | Stratos Wealth Partners, LTD. | 9,819 | 2.21 | 205 | 0.49 | ||||
| 2025-07-21 | 13F | West Financial Advisors, LLC | 26 | 4.00 | 1 | |||||
| 2025-07-25 | 13F | Almanack Investment Partners, LLC. | 10,641 | 12.71 | 222 | 10.50 | ||||
| 2025-07-14 | 13F | U.S. Capital Wealth Advisors, LLC | 0 | -100.00 | 0 | |||||
| 2025-08-05 | 13F | Simplex Trading, Llc | 0 | -100.00 | 0 | |||||
| 2025-08-12 | 13F | Proequities, Inc. | 0 | 0 | ||||||
| 2025-05-08 | 13F | Main Street Financial Solutions, LLC | 0 | -100.00 | 0 | |||||
| 2025-08-15 | 13F | Morgan Stanley | 8,717 | -26.65 | 182 | -28.17 | ||||
| 2025-08-11 | 13F | Anderson Financial Strategies, LLC | 319,880 | 3.33 | 6,663 | 1.49 | ||||
| 2025-08-08 | 13F | Kingsview Wealth Management, LLC | 31,200 | -16.42 | 650 | -17.95 | ||||
| 2025-07-24 | 13F | Wealthstar Advisors, Llc | 58,023 | 4.65 | 1,209 | 2.81 | ||||
| 2025-08-15 | 13F | Prevail Innovative Wealth Advisors, Llc | 225,178 | 1.83 | 4,690 | 0.00 | ||||
| 2025-07-21 | 13F | Ameriflex Group, Inc. | 300 | -2.28 | 6 | 0.00 | ||||
| 2025-08-14 | 13F | Integrated Wealth Concepts LLC | 26,029 | 542 | ||||||
| 2025-07-21 | 13F | Seros Financial, LLC | 30,067 | 0.00 | 626 | -1.73 | ||||
| 2025-07-24 | 13F | Robertson Stephens Wealth Management, LLC | 0 | -100.00 | 0 | |||||
| 2025-08-06 | 13F | Black Swift Group, LLC | 174,240 | -3.94 | 3,629 | -5.67 | ||||
| 2025-07-29 | 13F | Private Trust Co Na | 15,157 | 0.00 | 316 | -1.87 | ||||
| 2025-08-07 | 13F | Montag A & Associates Inc | 4,054 | 0.00 | 84 | -1.18 | ||||
| 2025-07-22 | 13F | DAVENPORT & Co LLC | 72,610 | 18.98 | 1,512 | 16.85 | ||||
| 2025-08-05 | 13F | Huntington National Bank | 0 | |||||||
| 2025-08-14 | 13F | GWM Advisors LLC | 8,297 | 0.10 | 173 | -1.71 | ||||
| 2025-08-19 | 13F | Newbridge Financial Services Group, Inc. | 89,624 | -2.67 | 1,867 | -4.41 | ||||
| 2025-05-15 | 13F | Talon Private Wealth, LLC | 0 | -100.00 | 0 | -100.00 | ||||
| 2025-07-15 | 13F | Sheets Smith Wealth Management | 95,081 | 0.13 | 1,981 | -1.64 | ||||
| 2025-07-23 | 13F | Abel Hall, LLC | 37,553 | 275.53 | 782 | 268.87 | ||||
| 2025-07-07 | 13F | Roxbury Financial LLC | 1,046 | 0.00 | 22 | -8.70 | ||||
| 2025-07-11 | 13F | Farther Finance Advisors, LLC | 2 | -99.81 | 0 | -100.00 | ||||
| 2025-08-11 | 13F | Principal Securities, Inc. | 706 | -79.80 | 15 | -81.58 | ||||
| 2025-08-11 | 13F | HighTower Advisors, LLC | 65,732 | 10.54 | 1,369 | 8.56 | ||||
| 2025-07-18 | 13F | Consolidated Portfolio Review Corp | 0 | -100.00 | 0 | |||||
| 2025-08-14 | 13F | Aqr Capital Management Llc | 25,947 | -45.89 | 540 | -46.85 | ||||
| 2025-08-18 | 13F | Geneos Wealth Management Inc. | 1,803 | 38.37 | 38 | 37.04 | ||||
| 2025-08-13 | 13F | Level Four Advisory Services, Llc | 33,625 | -16.94 | 700 | -18.41 | ||||
| 2025-08-15 | 13F | Equitable Holdings, Inc. | 305,004 | 6.85 | 6,353 | 4.94 | ||||
| 2025-08-12 | 13F | MAI Capital Management | 213 | -90.35 | 4 | -91.30 | ||||
| 2025-08-06 | 13F | Prospera Financial Services Inc | 32,153 | 155.45 | 670 | 151.50 | ||||
| 2025-08-12 | 13F | Archer Investment Corp | 56 | 1.82 | 1 | 0.00 | ||||
| 2025-08-04 | 13F | IFG Advisory, LLC | 17,054 | -20.65 | 355 | -21.98 | ||||
| 2025-05-16 | 13F | Jones Financial Companies Lllp | 0 | -100.00 | 0 | |||||
| 2025-08-04 | 13F | Assetmark, Inc | 524 | 25.06 | 11 | 25.00 | ||||
| 2025-08-04 | 13F | Creekmur Asset Management LLC | 109 | 1.87 | 2 | 0.00 | ||||
| 2025-08-11 | 13F | Strategic Wealth Partners, Ltd. | 277 | 6 | ||||||
| 2025-08-12 | 13F | Global Retirement Partners, LLC | 118,912 | -33.53 | 2,477 | -36.79 | ||||
| 2025-07-11 | 13F | Caldwell Securities, Inc | 1,100 | 0.00 | 23 | -4.35 | ||||
| 2025-07-25 | 13F | Atria Wealth Solutions, Inc. | 35,086 | 732 | ||||||
| 2025-08-13 | 13F | Virtus ETF Advisers LLC | 170 | 4 | ||||||
| 2025-08-11 | 13F | Aptus Capital Advisors, LLC | 200 | 0.00 | 4 | 0.00 | ||||
| 2025-08-27 | 13F/A | Brinker Capital Investments, LLC | 32,865 | 46.87 | 685 | 44.30 | ||||
| 2025-07-10 | 13F | Wealth Enhancement Advisory Services, Llc | 25,764 | 1.22 | 542 | 0.56 | ||||
| 2025-05-14 | 13F | Flow Traders U.s. Llc | 0 | -100.00 | 0 | |||||
| 2025-07-11 | 13F | Kingstone Capital Partners Texas, LLC | 2,068,539 | 45 | ||||||
| 2025-08-28 | NP | Northern Lights Fund Trust - Sierra Tactical Risk Spectrum 30 Fund Instl Class | 155,200 | 802.33 | 3,233 | 724.49 | ||||
| 2025-08-01 | 13F | Brookwood Investment Group LLC | 22,961 | 33.94 | 478 | 31.68 | ||||
| 2025-08-06 | 13F | Rps Advisory Solutions Llc | 10,178 | 5.17 | 212 | 3.41 | ||||
| 2025-08-19 | 13F | National Asset Management, Inc. | 42,306 | 2.33 | 881 | -2.65 | ||||
| 2025-08-12 | 13F | Cumberland Partners Ltd | 12,700 | 265 | ||||||
| 2025-08-12 | 13F | CIBC Private Wealth Group, LLC | 0 | -100.00 | 0 | |||||
| 2025-08-12 | 13F | LPL Financial LLC | 2,452,132 | -3.80 | 51,078 | -5.53 | ||||
| 2025-08-05 | 13F | Bank of New York Mellon Corp | 14,467 | 301 | ||||||
| 2025-08-06 | 13F | Commonwealth Equity Services, Llc | 198,108 | 71.61 | 4 | 100.00 | ||||
| 2025-07-24 | 13F | Cascade Investment Group, Inc. | 17,100 | 356 | ||||||
| 2025-07-29 | 13F | TrueMark Investments, LLC | 0 | -100.00 | 0 | |||||
| 2025-05-15 | 13F | Activest Wealth Management | 0 | -100.00 | 0 | -100.00 | ||||
| 2025-08-14 | 13F | Mml Investors Services, Llc | 658,797 | 3.36 | 14 | 0.00 | ||||
| 2025-08-04 | 13F | HBK Sorce Advisory LLC | 0 | -100.00 | 0 | |||||
| 2025-07-16 | 13F | Signaturefd, Llc | 6,100 | 0.03 | 127 | -1.55 | ||||
| 2025-08-14 | 13F | Matrix Private Capital Group Llc | 11,800 | 0.00 | 246 | -2.00 | ||||
| 2025-07-07 | 13F | Thurston, Springer, Miller, Herd & Titak, Inc. | 1,100 | 0.00 | 23 | -4.35 | ||||
| 2025-08-12 | 13F | J.w. Cole Advisors, Inc. | 72,593 | 5.92 | 1,512 | 4.06 | ||||
| 2025-08-08 | 13F | Financial Gravity Companies, Inc. | 83,333 | 9.01 | 1,736 | 3.64 | ||||
| 2025-08-28 | NP | Northern Lights Fund Trust - Sierra Tactical Risk Spectrum 70 Fund Investor Class | 31,500 | 9.04 | 656 | -0.46 | ||||
| 2025-08-11 | 13F | Private Advisor Group, LLC | 55,178 | 71.11 | 1,149 | 68.23 | ||||
| 2025-07-21 | 13F | DHJJ Financial Advisors, Ltd. | 32 | 0.00 | 1 | |||||
| 2025-08-11 | 13F | Anfield Capital Management, LLC | 5,352 | 2.76 | 111 | 0.91 | ||||
| 2025-07-30 | 13F | Jackson Thornton Asset Management, Llc | 25,947 | -45.89 | 550 | -43.11 | ||||
| 2025-08-15 | 13F | Tower Research Capital LLC (TRC) | 481 | 10 | ||||||
| 2025-08-14 | 13F | UBS Group AG | 1 | -99.70 | 0 | -100.00 | ||||
| 2025-04-29 | 13F | Raleigh Capital Management Inc. | 0 | -100.00 | 0 | |||||
| 2025-08-14 | 13F | Bnp Paribas Arbitrage, Sa | 177 | 2,850.00 | 4 | |||||
| 2025-08-13 | 13F | Lido Advisors, LLC | 133,975 | 1.54 | 2,791 | -0.29 | ||||
| 2025-07-23 | 13F | Venturi Wealth Management, LLC | 11,217 | 234 | ||||||
| 2025-07-21 | 13F | Future Financial Wealth Managment LLC | 152,691 | 22.72 | 3,181 | 20.50 | ||||
| 2025-08-15 | 13F | Kestra Advisory Services, LLC | 130,781 | 6.52 | 2,724 | 4.61 | ||||
| 2025-08-14 | 13F | Arete Wealth Advisors, LLC | 11,094 | -81.62 | 0 | -100.00 | ||||
| 2025-07-15 | 13F | World Equity Group, Inc. | 51,808 | 7.70 | 1,079 | 5.78 | ||||
| 2025-08-14 | 13F | Ausdal Financial Partners, Inc. | 17,208 | 5.25 | 358 | 3.47 | ||||
| 2025-08-01 | 13F | Gwn Securities Inc. | 17,410 | -87.01 | 363 | -86.94 | ||||
| 2025-05-14 | 13F | Truvestments Capital Llc | 0 | -100.00 | 0 | |||||
| 2025-04-25 | 13F | New Wave Wealth Advisors Llc | 0 | -100.00 | 0 | |||||
| 2025-08-12 | 13F | Steward Partners Investment Advisory, Llc | 386,094 | 5.83 | 8,042 | 3.93 | ||||
| 2025-08-14 | 13F | TT Capital Management LLC | 32,700 | 672 | ||||||
| 2025-08-08 | 13F | Pnc Financial Services Group, Inc. | 900 | 0.00 | 19 | -5.26 | ||||
| 2025-08-14 | 13F | Fmr Llc | 71 | 1 | ||||||
| 2025-08-18 | 13F/A | National Bank Of Canada /fi/ | 2,801 | 0.00 | 58 | -1.69 | ||||
| 2025-09-04 | 13F/A | Advisor Group Holdings, Inc. | 734,144 | 7.16 | 15,294 | 5.24 | ||||
| 2025-07-22 | 13F | Beacon Financial Advisory LLC | 25,295 | 7.46 | 527 | 5.41 | ||||
| 2025-08-12 | 13F | AlphaCore Capital LLC | 0 | -100.00 | 0 | |||||
| 2025-07-17 | 13F | Sound Income Strategies, LLC | 244,932 | 0.20 | 5,102 | -1.60 | ||||
| 2025-04-30 | 13F | TradeWell Securities, LLC. | 41,661 | 14.97 | 884 | 11.35 | ||||
| 2025-04-28 | 13F | Strategic Financial Concepts, LLC | 0 | -100.00 | 0 | -100.00 | ||||
| 2025-05-06 | 13F | Avantax Advisory Services, Inc. | 0 | -100.00 | 0 | -100.00 | ||||
| 2025-08-04 | 13F | Spire Wealth Management | 2,993 | 0.00 | 62 | -1.59 | ||||
| 2025-04-17 | 13F | Janney Montgomery Scott LLC | 0 | -100.00 | 0 | |||||
| 2025-07-31 | 13F/A | Avion Wealth | 100 | 0.00 | 0 | |||||
| 2025-08-19 | 13F | Advisory Services Network, LLC | 52,804 | -61.66 | 1,133 | -61.23 | ||||
| 2025-08-12 | 13F | BlackRock, Inc. | 893 | 0.00 | 19 | 0.00 | ||||
| 2025-07-18 | 13F | PFG Investments, LLC | 30,891 | 10.62 | 643 | 8.61 | ||||
| 2025-08-04 | 13F | Roble, Belko & Company, Inc | 142 | 2.90 | 0 | |||||
| 2025-07-11 | 13F | Great Waters Wealth Management | 10,000 | 0.00 | 208 | -1.89 | ||||
| 2025-08-04 | 13F | Integrity Alliance, Llc. | 0 | -100.00 | 0 | |||||
| 2025-08-06 | 13F | Aspect Partners, LLC | 1,050 | 2.44 | 22 | 0.00 | ||||
| 2025-08-14 | 13F | Comerica Bank | 15,029 | 15.09 | 313 | 13.41 | ||||
| 2025-08-13 | 13F | Northwestern Mutual Wealth Management Co | 0 | -100.00 | 0 | |||||
| 2025-04-25 | 13F | Albion Financial Group /ut | 0 | -100.00 | 0 | |||||
| 2025-07-16 | 13F | Magnus Financial Group LLC | 20,813 | 6.19 | 434 | 4.34 | ||||
| 2025-08-14 | 13F | Susquehanna International Group, Llp | 38,572 | 803 | ||||||
| 2025-07-08 | 13F | Webster Bank, N. A. | 3,472 | 0.00 | 72 | -1.37 | ||||
| 2025-08-14 | 13F | Mariner, LLC | 47,727 | 25.05 | 994 | 22.87 | ||||
| 2025-07-28 | 13F | RFG Advisory, LLC | 44,323 | -63.21 | 923 | -63.87 | ||||
| 2025-07-25 | 13F | Cwm, Llc | 2,723 | -3.10 | 0 | |||||
| 2025-08-01 | 13F | Envestnet Asset Management Inc | 226,794 | 39.03 | 4,724 | 36.57 | ||||
| 2025-08-12 | 13F | Jpmorgan Chase & Co | 152 | -19.58 | 3 | -25.00 | ||||
| 2025-08-14 | 13F | Citadel Advisors Llc | Put | 16,300 | -34.01 | 340 | -35.18 | |||
| 2025-08-28 | NP | Northern Lights Fund Trust - Sierra Tactical Risk Spectrum 50 Fund Investor Class | 139,200 | -18.45 | 2,900 | -25.61 | ||||
| 2025-08-14 | 13F | Citadel Advisors Llc | Call | 53,300 | -13.75 | 1,110 | -15.27 | |||
| 2025-08-18 | 13F | Tactive Advisors, LLC | 13,431 | 280 |