Mga Batayang Estadistika
| Pemilik Institusional | 95 total, 95 long only, 0 short only, 0 long/short - change of -4.00% MRQ |
| Alokasi Portofolio Rata-rata | 0.0682 % - change of -5.18% MRQ |
| Saham Institusional (Jangka Panjang) | 1,402,680 (ex 13D/G) - change of -0.15MM shares -9.50% MRQ |
| Nilai Institusional (Jangka Panjang) | $ 206,443 USD ($1000) |
Kepemilikan Institusional dan Pemegang Saham
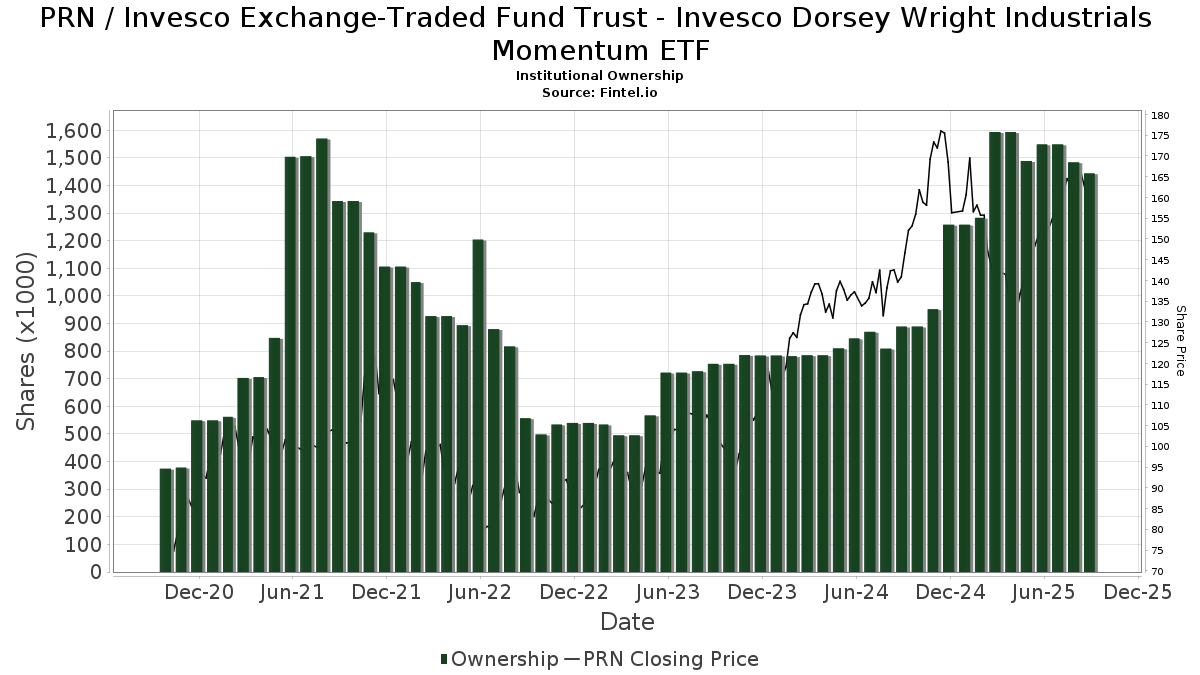
Invesco Exchange-Traded Fund Trust - Invesco Dorsey Wright Industrials Momentum ETF (US:PRN) memiliki 95 pemilik institusional dan pemegang saham yang telah mengajukan formulir 13D/G atau 13F kepada Komisi Bursa Efek (Securities Exchange Commission/SEC). Lembaga-lembaga ini memegang total 1,402,680 saham. Pemegang saham terbesar meliputi Morgan Stanley, HighTower Advisors, LLC, Wells Fargo & Company/mn, Transamerica Financial Advisors, Inc., LPL Financial LLC, Raymond James Financial Inc, Ameriprise Financial Inc, Janney Montgomery Scott LLC, Envestnet Asset Management Inc, and Bank Of America Corp /de/ .
Struktur kepemilikan institusional Invesco Exchange-Traded Fund Trust - Invesco Dorsey Wright Industrials Momentum ETF (NasdaqGM:PRN) menunjukkan posisi terkini di perusahaan oleh institusi dan dana, serta perubahan terbaru dalam ukuran posisi. Pemegang saham utama dapat mencakup investor individu, reksa dana, dana lindung nilai, atau institusi. Jadwal 13D menunjukkan bahwa investor memegang (atau pernah memegang) lebih dari 5% saham perusahaan dan bermaksud (atau pernah bermaksud) untuk secara aktif mengejar perubahan strategi bisnis. Jadwal 13G menunjukkan investasi pasif lebih dari 5%.
The share price as of September 2, 2025 is 163.46 / share. Previously, on September 3, 2024, the share price was 139.01 / share. This represents an increase of 17.59% over that period.
Skor Sentimen Dana
Skor Sentimen Dana (sebelumnya dikenal sebagai Skor Akumulasi Kepemilikan) menemukan saham-saham yang paling banyak dibeli oleh dana. Ini adalah hasil dari model kuantitatif multi-faktor yang canggih yang mengidentifikasi perusahaan dengan tingkat akumulasi institusional tertinggi. Model penilaian menggunakan kombinasi dari total peningkatan pemilik yang diungkapkan, perubahan dalam alokasi portofolio pada pemilik tersebut, dan metrik lainnya. Angka berkisar dari 0 hingga 100, dengan angka yang lebih tinggi menunjukkan tingkat akumulasi yang lebih tinggi dibandingkan dengan perusahaan sejenisnya, dan 50 adalah rata-ratanya.
Frekuensi Pembaruan: Setiap Hari
Lihat Ownership Explorer, yang menyediakan daftar perusahaan dengan peringkat tertinggi.
Rasio Put/Call Institusional
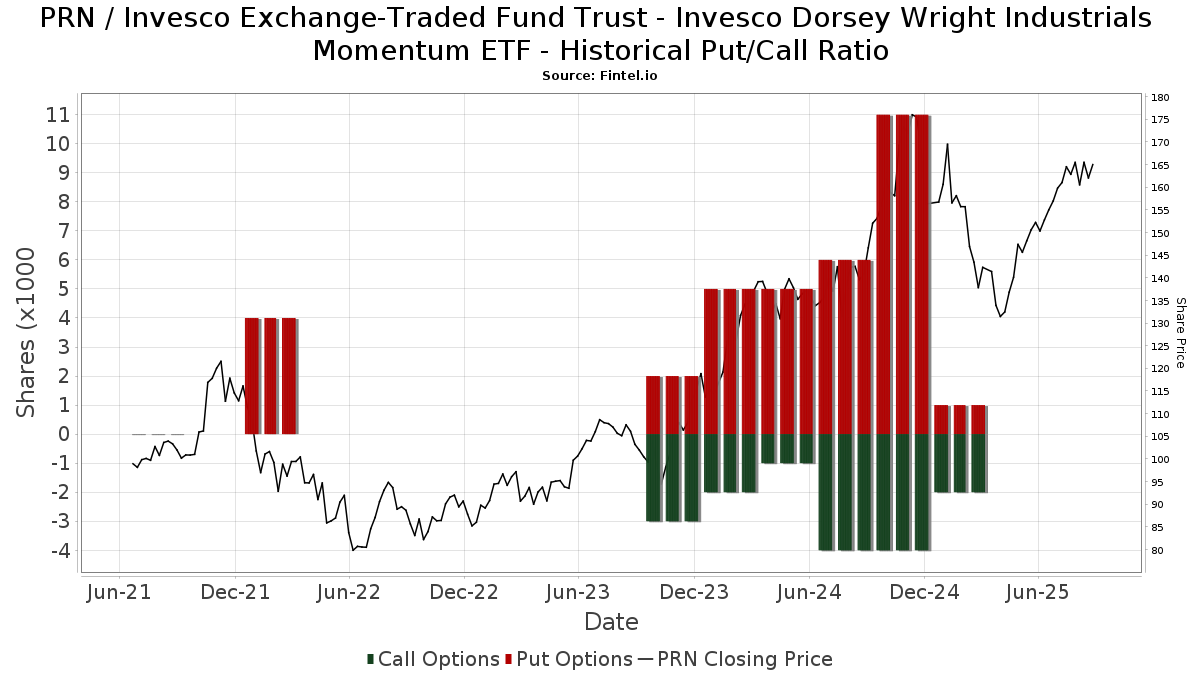
Selain melaporkan isu ekuitas dan utang standar, institusi dengan aset di bawah manajemen lebih dari 100 juta dolar AS juga harus mengungkapkan kepemilikan opsi put dan call mereka. Karena opsi put umumnya menunjukkan sentimen negatif, dan opsi call menunjukkan sentimen positif, kita dapat mengetahui sentimen institusional secara keseluruhan dengan memplot rasio put terhadap call. Grafik di sebelah kanan memplot rasio put/call historis untuk instrumen ini.
Menggunakan Rasio Put/Call sebagai indikator sentimen investor mengatasi salah satu kekurangan utama dari penggunaan total kepemilikan institusional, yaitu sejumlah besar aset yang dikelola diinvestasikan secara pasif untuk melacak indeks. Dana yang dikelola secara pasif biasanya tidak membeli opsi, sehingga indikator rasio put/call lebih akurat dalam melacak sentimen dana yang dikelola secara aktif.
Pengajuan 13F dan NPORT
Detail pada pengajuan 13F tersedia gratis. Detail pada pengajuan NP memerlukan keanggotaan premium. Baris berwarna hijau menunjukkan posisi baru. Baris berwarna merah menunjukkan posisi yang sudah ditutup. Klik tautan ini ikon untuk melihat riwayat transaksi selengkapnya.
Tingkatkan
untuk membuka data premium dan mengekspor ke Excel ![]() .
.
| Tanggal File | Sumber | Investor | Ketik | Presyo ng Avg (Silangan) |
Saham | Δ Saham (%) |
Dilaporkan Nilai ($1000) |
Nilai Δ (%) |
Alokasi Port (%) |
|
|---|---|---|---|---|---|---|---|---|---|---|
| 2025-04-29 | 13F | Concurrent Investment Advisors, LLC | 0 | -100.00 | 0 | |||||
| 2025-07-24 | 13F | WMG Financial Advisors, LLC | 1,744 | 5.06 | 274 | 19.74 | ||||
| 2025-08-14 | 13F | Two Sigma Securities, Llc | 0 | -100.00 | 0 | |||||
| 2025-08-15 | 13F | Kestra Advisory Services, LLC | 4,897 | -12.79 | 769 | -0.52 | ||||
| 2025-08-14 | 13F | Bank Of America Corp /de/ | 28,964 | 0.02 | 4,549 | 14.07 | ||||
| 2025-08-15 | 13F | Tower Research Capital LLC (TRC) | 8,023 | 267.52 | 1,260 | 320.00 | ||||
| 2025-08-08 | 13F | Cetera Investment Advisers | 9,361 | 6.38 | 1,470 | 21.39 | ||||
| 2025-07-17 | 13F | Janney Montgomery Scott LLC | 43,533 | -13.95 | 7 | 0.00 | ||||
| 2025-08-13 | 13F | Advisor Group Holdings, Inc. | 10,862 | 13.37 | 1,670 | 26.61 | ||||
| 2025-08-14 | 13F | Susquehanna International Group, Llp | 2,242 | -76.06 | 352 | -72.69 | ||||
| 2025-08-11 | 13F | Western Wealth Management, LLC | 1,717 | -0.58 | 270 | 13.50 | ||||
| 2025-07-18 | 13F | Truist Financial Corp | 19,167 | -0.16 | 3,010 | 13.89 | ||||
| 2025-08-12 | 13F | Steward Partners Investment Advisory, Llc | 6 | 1 | ||||||
| 2025-07-28 | 13F | Holistic Planning, LLC | 1,729 | 0.00 | 272 | 13.87 | ||||
| 2025-08-04 | 13F | Spire Wealth Management | 1,200 | 3.63 | 188 | 18.24 | ||||
| 2025-08-11 | 13F | HighTower Advisors, LLC | 146,405 | 1.05 | 22,993 | 15.24 | ||||
| 2025-07-25 | 13F | Cwm, Llc | 75 | 1.35 | 0 | |||||
| 2025-08-05 | 13F | Tredje AP-fonden | 12,868 | 0.00 | 1,321 | 17.42 | ||||
| 2025-08-14 | 13F | Goldman Sachs Group Inc | 3,513 | -80.92 | 552 | -78.26 | ||||
| 2025-05-12 | 13F | Founders Financial Securities Llc | 0 | -100.00 | 0 | |||||
| 2025-07-08 | 13F | Parallel Advisors, LLC | 570 | 0.00 | 90 | 14.10 | ||||
| 2025-07-11 | 13F | Farther Finance Advisors, LLC | 7,535 | 0.27 | 1,183 | 13.10 | ||||
| 2025-05-09 | 13F | GeoWealth Management, LLC | 0 | -100.00 | 0 | |||||
| 2025-08-07 | 13F | Private Advisory Group LLC | 0 | -100.00 | 0 | |||||
| 2025-08-08 | 13F | MTM Investment Management, LLC | 1,659 | 0.00 | 261 | 13.04 | ||||
| 2025-08-12 | 13F | Global Retirement Partners, LLC | 364 | 0.00 | 57 | 3.64 | ||||
| 2025-07-22 | 13F | Chung Wu Investment Group, LLC | 30 | 5 | ||||||
| 2025-04-24 | 13F | Mirae Asset Global Investments Co., Ltd. | 0 | -100.00 | 0 | |||||
| 2025-08-12 | 13F | MAI Capital Management | 0 | -100.00 | 0 | |||||
| 2025-07-22 | 13F | Belpointe Asset Management LLC | 6,950 | 4.17 | 1,092 | 18.85 | ||||
| 2025-07-23 | 13F | Bellevue Asset Management, Llc | 746 | 0.00 | 117 | 14.71 | ||||
| 2025-08-14 | 13F | Wiley Bros.-aintree Capital, Llc | 3,447 | 23.11 | 539 | 40.00 | ||||
| 2025-08-11 | 13F | Private Advisor Group, LLC | 12,919 | 0.53 | 2,029 | 14.70 | ||||
| 2025-07-25 | 13F | SPC Financial, Inc. | 7,500 | 2.95 | 1,178 | 17.35 | ||||
| 2025-07-24 | 13F | IFP Advisors, Inc | 100 | 16 | ||||||
| 2025-08-11 | 13F | Principal Securities, Inc. | 11,749 | 1,845 | ||||||
| 2025-04-28 | 13F | DAVENPORT & Co LLC | 0 | -100.00 | 0 | |||||
| 2025-08-13 | 13F | Northwestern Mutual Wealth Management Co | 25 | 66.67 | 4 | 50.00 | ||||
| 2025-08-12 | 13F | J.w. Cole Advisors, Inc. | 5,028 | 5.63 | 790 | 20.46 | ||||
| 2025-08-05 | 13F | Advisors Preferred, LLC | 379 | 59 | ||||||
| 2025-07-24 | 13F | Blair William & Co/il | 22 | 0.00 | 3 | 0.00 | ||||
| 2025-08-08 | 13F | Pnc Financial Services Group, Inc. | 100 | -33.33 | 16 | -25.00 | ||||
| 2025-05-15 | 13F | Qube Research & Technologies Ltd | 0 | -100.00 | 0 | |||||
| 2025-08-08 | 13F | Larson Financial Group LLC | 2,205 | 7.04 | 346 | 22.26 | ||||
| 2025-08-13 | 13F | Quadrature Capital Ltd | 13,224 | -56.45 | 2,074 | -50.37 | ||||
| 2025-07-22 | 13F | Noble Family Wealth, LLC | 5,594 | 21.77 | 879 | 38.92 | ||||
| 2025-08-01 | 13F | Envestnet Asset Management Inc | 32,250 | 65.16 | 5,065 | 88.39 | ||||
| 2025-08-14 | 13F | Fmr Llc | 650 | 21.50 | 102 | 39.73 | ||||
| 2025-07-31 | 13F | Cambridge Investment Research Advisors, Inc. | 21,214 | -24.85 | 3 | 0.00 | ||||
| 2025-08-13 | 13F | Transce3nd, LLC | 0 | -100.00 | 0 | |||||
| 2025-07-14 | 13F | Sowell Financial Services LLC | 1,910 | -9.26 | 300 | 3.46 | ||||
| 2025-08-06 | 13F | Commonwealth Equity Services, Llc | 5,795 | -3.75 | 1 | |||||
| 2025-08-14 | 13F | Wells Fargo & Company/mn | 136,774 | -10.65 | 21,480 | 1.90 | ||||
| 2025-08-07 | 13F | Fagan Associates, Inc. | 3,775 | -6.56 | 593 | 6.47 | ||||
| 2025-04-28 | 13F | Private Trust Co Na | 0 | -100.00 | 0 | |||||
| 2025-07-11 | 13F | SILVER OAK SECURITIES, Inc | 17,390 | 4.43 | 2,731 | 19.05 | ||||
| 2025-08-14 | 13F | Old Mission Capital Llc | 4,069 | -25.35 | 639 | -14.80 | ||||
| 2025-08-07 | 13F | Runnymede Capital Advisors, Inc. | 0 | -100.00 | 0 | |||||
| 2025-08-14 | 13F | Transamerica Financial Advisors, Inc. | 116,606 | -3.50 | 18,313 | 114,350.00 | ||||
| 2025-08-13 | 13F | Truvestments Capital Llc | 200 | 0.00 | 31 | 14.81 | ||||
| 2025-07-16 | 13F | Minichmacgregor Wealth Management, Llc | 2,482 | -2.40 | 390 | 11.14 | ||||
| 2025-08-14 | 13F | Royal Bank Of Canada | 8,744 | 76.83 | 1,373 | 101.62 | ||||
| 2025-08-11 | 13F | Aptus Capital Advisors, LLC | 135 | 0.00 | 21 | 16.67 | ||||
| 2025-08-14 | 13F | Mpwm Advisory Solutions, Llc | 133 | 0.00 | 21 | 11.11 | ||||
| 2025-08-06 | 13F | Prospera Financial Services Inc | 3,355 | -5.52 | 528 | 7.77 | ||||
| 2025-08-14 | 13F | Jane Street Group, Llc | 0 | -100.00 | 0 | |||||
| 2025-08-14 | 13F | Ameriprise Financial Inc | 79,451 | -32.47 | 12,480 | -22.99 | ||||
| 2025-08-14 | 13F | Stifel Financial Corp | 20,694 | -1.80 | 3,252 | 11.99 | ||||
| 2025-08-18 | 13F | Geneos Wealth Management Inc. | 1,005 | 187.14 | 158 | 227.08 | ||||
| 2025-05-08 | 13F | Us Bancorp \de\ | 0 | -100.00 | 0 | |||||
| 2025-07-25 | 13F | Genesee Capital Advisors, LLC | 3,227 | -59.58 | 507 | -53.96 | ||||
| 2025-07-31 | 13F | Briaud Financial Planning, Inc | 99 | 0 | ||||||
| 2025-08-12 | 13F | Park Square Financial Group, LLC | 5 | 0.00 | 1 | |||||
| 2025-08-14 | 13F | UBS Group AG | 23,701 | 3.51 | 3,722 | 18.05 | ||||
| 2025-08-01 | 13F | Schmidt P J Investment Management Inc | 3,084 | 15.64 | 484 | 31.88 | ||||
| 2025-08-05 | 13F | Wellington Shields & Co., LLC | 1,455 | 229 | ||||||
| 2025-08-14 | 13F | Blue Capital, Inc. | 0 | -100.00 | 0 | |||||
| 2025-08-12 | 13F | Jpmorgan Chase & Co | 1,055 | -1.86 | 166 | 11.49 | ||||
| 2025-08-01 | 13F | Belvedere Trading LLC | Call | 0 | -100.00 | 0 | ||||
| 2025-08-12 | 13F | Proequities, Inc. | 0 | 0 | ||||||
| 2025-08-04 | 13F | Creekmur Asset Management LLC | 58 | 0.00 | 9 | 28.57 | ||||
| 2025-08-01 | 13F | Belvedere Trading LLC | Put | 0 | -100.00 | 0 | ||||
| 2025-04-29 | 13F | Olistico Wealth, LLC | 0 | -100.00 | 0 | |||||
| 2025-08-14 | 13F | Citadel Advisors Llc | 6,711 | 0.06 | 1,054 | 14.08 | ||||
| 2025-05-12 | 13F | AMJ Financial Wealth Management | 0 | -100.00 | 0 | |||||
| 2025-08-14 | 13F | D. E. Shaw & Co., Inc. | 2,643 | 415 | ||||||
| 2025-08-12 | 13F | Wealthbridge Capital Management, Llc | 2,009 | -2.48 | 316 | 11.31 | ||||
| 2025-08-07 | 13F | Hennion & Walsh Asset Management, Inc. | 2,652 | -3.56 | 416 | 10.05 | ||||
| 2025-05-15 | 13F | Baird Financial Group, Inc. | 0 | -100.00 | 0 | |||||
| 2025-07-31 | 13F | Nilsine Partners, LLC | 9,361 | 1.18 | 1,470 | 15.38 | ||||
| 2025-08-19 | 13F | Advisory Services Network, LLC | 2,751 | 15.25 | 452 | 37.50 | ||||
| 2025-07-25 | 13F | Hemington Wealth Management | 318 | 0.00 | 0 | |||||
| 2025-08-14 | 13F | MGB Wealth Management, LLC | 0 | -100.00 | 0 | |||||
| 2025-08-14 | 13F | GWM Advisors LLC | 7,522 | -66.54 | 1,181 | -61.84 | ||||
| 2025-05-14 | 13F | Colonial Trust Co / SC | 0 | -100.00 | 0 | |||||
| 2025-07-29 | 13F | International Assets Investment Management, Llc | 0 | -100.00 | 0 | |||||
| 2025-05-09 | 13F | Belvedere Trading LLC | 0 | -100.00 | 0 | -100.00 | ||||
| 2025-08-12 | 13F | LPL Financial LLC | 112,640 | -10.26 | 17,690 | 2.35 | ||||
| 2025-05-15 | 13F | Glenmede Trust Co Na | 2,385 | 0.00 | 328 | -10.38 | ||||
| 2025-08-01 | 13F | Rossby Financial, LCC | 242 | 0.00 | 38 | 18.75 | ||||
| 2025-07-28 | 13F | Harbour Investments, Inc. | 450 | -11.76 | 71 | 0.00 | ||||
| 2025-07-07 | 13F | Nova Wealth Management, Inc. | 3,313 | 9.74 | 520 | 25.30 | ||||
| 2025-08-01 | 13F | Gwn Securities Inc. | 7,828 | -79.89 | 1,231 | -78.56 | ||||
| 2025-08-14 | 13F | Two Sigma Investments, Lp | 21,600 | 3,392 | ||||||
| 2025-08-14 | 13F | CIBC World Markets Inc. | 3,777 | 593 | ||||||
| 2025-08-12 | 13F | New Republic Capital, LLC | 175 | 0.00 | 27 | 12.50 | ||||
| 2025-07-23 | 13F | Trueblood Wealth Management, LLC | 3,053 | 8.19 | 479 | 23.45 | ||||
| 2025-05-14 | 13F | Susquehanna International Group, Llp | Put | 0 | -100.00 | 0 | -100.00 | |||
| 2025-07-15 | 13F | Financial Management Professionals, Inc. | 0 | -100.00 | 0 | |||||
| 2025-07-17 | 13F | Western Financial Corp/CA | 1,997 | -19.22 | 314 | -7.94 | ||||
| 2025-07-24 | 13F | JNBA Financial Advisors | 1,422 | 0.00 | 223 | 14.36 | ||||
| 2025-08-13 | 13F | StoneX Group Inc. | 16,421 | 4.88 | 2,579 | 19.57 | ||||
| 2025-08-05 | 13F | Huntington National Bank | 0 | |||||||
| 2025-08-14 | 13F | Mml Investors Services, Llc | 12,043 | -10.05 | 2 | 0.00 | ||||
| 2025-05-14 | 13F | Susquehanna International Group, Llp | Call | 0 | -100.00 | 0 | -100.00 | |||
| 2025-08-08 | 13F | Avantax Advisory Services, Inc. | 8,102 | 3.94 | 1,272 | 18.55 | ||||
| 2025-08-14 | 13F | Glenmede Investment Management, LP | 2,385 | 375 | ||||||
| 2025-05-09 | 13F | Comprehensive Financial Planning, Inc./PA | 0 | -100.00 | 0 | |||||
| 2025-08-14 | 13F | Comerica Bank | 0 | -100.00 | 0 | |||||
| 2025-08-14 | 13F | Sunbelt Securities, Inc. | 1,400 | 63.36 | 215 | 82.20 | ||||
| 2025-08-13 | 13F | Continuum Advisory, LLC | 0 | -100.00 | 0 | |||||
| 2025-07-18 | 13F | SOA Wealth Advisors, LLC. | 42 | 0.00 | 7 | 20.00 | ||||
| 2025-08-13 | 13F | Jones Financial Companies Lllp | 3,754 | 30.35 | 586 | 47.98 | ||||
| 2025-07-23 | 13F | Kingswood Wealth Advisors, Llc | 0 | -100.00 | 0 | -100.00 | ||||
| 2025-08-06 | 13F | Stonebridge Financial Planning Group, LLC | 7,069 | -5.37 | 1,110 | 7.98 | ||||
| 2025-08-08 | NP | QALTX - Quantified Alternative Investment Fund Investor Class Shares | 379 | 25.08 | 60 | 28.26 | ||||
| 2025-08-15 | 13F | Morgan Stanley | 189,043 | 3.57 | 29,689 | 18.12 | ||||
| 2025-08-14 | 13F | Raymond James Financial Inc | 103,425 | -6.14 | 16,243 | 7.04 |