Mga Batayang Estadistika
| Pemilik Institusional | 140 total, 140 long only, 0 short only, 0 long/short - change of 9.38% MRQ |
| Alokasi Portofolio Rata-rata | 0.8984 % - change of 6.35% MRQ |
| Saham Institusional (Jangka Panjang) | 84,634,179 (ex 13D/G) - change of 28.53MM shares 50.84% MRQ |
| Nilai Institusional (Jangka Panjang) | $ 2,973,135 USD ($1000) |
Kepemilikan Institusional dan Pemegang Saham
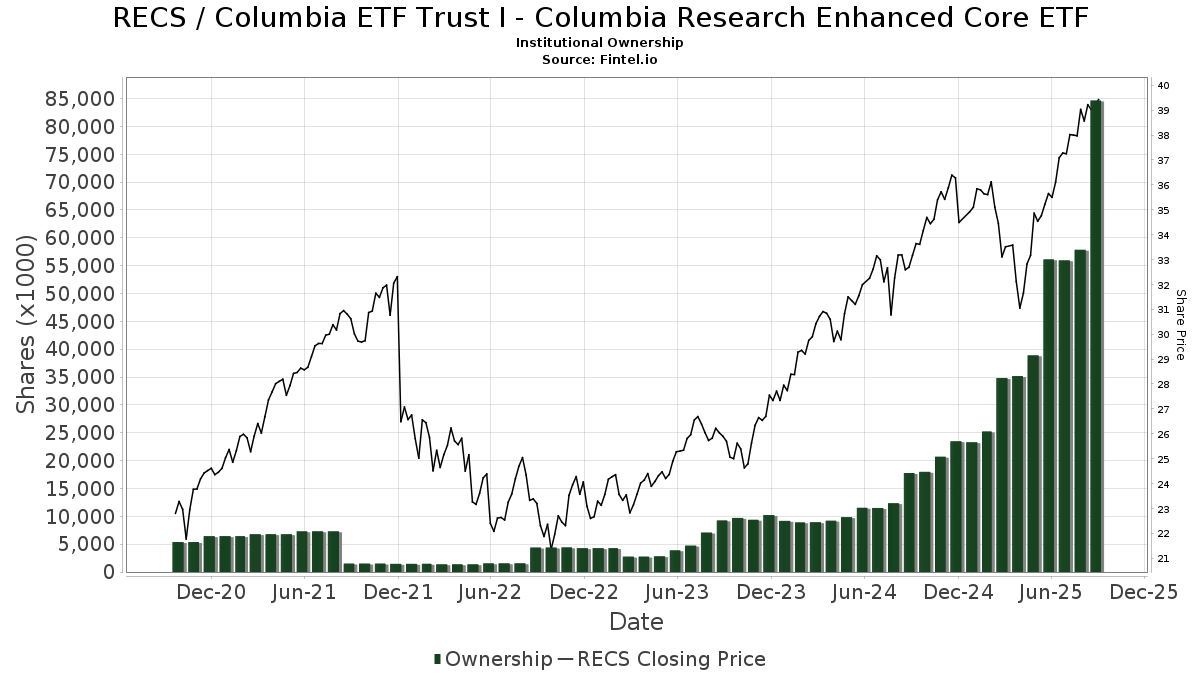
Columbia ETF Trust I - Columbia Research Enhanced Core ETF (US:RECS) memiliki 140 pemilik institusional dan pemegang saham yang telah mengajukan formulir 13D/G atau 13F kepada Komisi Bursa Efek (Securities Exchange Commission/SEC). Lembaga-lembaga ini memegang total 84,634,179 saham. Pemegang saham terbesar meliputi Jane Street Group, Llc, Ameriprise Financial Inc, LPL Financial LLC, Bank Of America Corp /de/, Morgan Stanley, Raymond James Financial Inc, CTFAX - Columbia Thermostat Fund Class A, Commonwealth Equity Services, Llc, Gradient Investments LLC, and Fundamentun, Llc .
Struktur kepemilikan institusional Columbia ETF Trust I - Columbia Research Enhanced Core ETF (ARCA:RECS) menunjukkan posisi terkini di perusahaan oleh institusi dan dana, serta perubahan terbaru dalam ukuran posisi. Pemegang saham utama dapat mencakup investor individu, reksa dana, dana lindung nilai, atau institusi. Jadwal 13D menunjukkan bahwa investor memegang (atau pernah memegang) lebih dari 5% saham perusahaan dan bermaksud (atau pernah bermaksud) untuk secara aktif mengejar perubahan strategi bisnis. Jadwal 13G menunjukkan investasi pasif lebih dari 5%.
The share price as of September 5, 2025 is 39.05 / share. Previously, on September 6, 2024, the share price was 32.00 / share. This represents an increase of 22.03% over that period.
Skor Sentimen Dana
Skor Sentimen Dana (sebelumnya dikenal sebagai Skor Akumulasi Kepemilikan) menemukan saham-saham yang paling banyak dibeli oleh dana. Ini adalah hasil dari model kuantitatif multi-faktor yang canggih yang mengidentifikasi perusahaan dengan tingkat akumulasi institusional tertinggi. Model penilaian menggunakan kombinasi dari total peningkatan pemilik yang diungkapkan, perubahan dalam alokasi portofolio pada pemilik tersebut, dan metrik lainnya. Angka berkisar dari 0 hingga 100, dengan angka yang lebih tinggi menunjukkan tingkat akumulasi yang lebih tinggi dibandingkan dengan perusahaan sejenisnya, dan 50 adalah rata-ratanya.
Frekuensi Pembaruan: Setiap Hari
Lihat Ownership Explorer, yang menyediakan daftar perusahaan dengan peringkat tertinggi.
Rasio Put/Call Institusional
Selain melaporkan isu ekuitas dan utang standar, institusi dengan aset di bawah manajemen lebih dari 100 juta dolar AS juga harus mengungkapkan kepemilikan opsi put dan call mereka. Karena opsi put umumnya menunjukkan sentimen negatif, dan opsi call menunjukkan sentimen positif, kita dapat mengetahui sentimen institusional secara keseluruhan dengan memplot rasio put terhadap call. Grafik di sebelah kanan memplot rasio put/call historis untuk instrumen ini.
Menggunakan Rasio Put/Call sebagai indikator sentimen investor mengatasi salah satu kekurangan utama dari penggunaan total kepemilikan institusional, yaitu sejumlah besar aset yang dikelola diinvestasikan secara pasif untuk melacak indeks. Dana yang dikelola secara pasif biasanya tidak membeli opsi, sehingga indikator rasio put/call lebih akurat dalam melacak sentimen dana yang dikelola secara aktif.
Pengajuan 13F dan NPORT
Detail pada pengajuan 13F tersedia gratis. Detail pada pengajuan NP memerlukan keanggotaan premium. Baris berwarna hijau menunjukkan posisi baru. Baris berwarna merah menunjukkan posisi yang sudah ditutup. Klik tautan ini ikon untuk melihat riwayat transaksi selengkapnya.
Tingkatkan
untuk membuka data premium dan mengekspor ke Excel ![]() .
.
| Tanggal File | Sumber | Investor | Ketik | Presyo ng Avg (Silangan) |
Saham | Δ Saham (%) |
Dilaporkan Nilai ($1000) |
Nilai Δ (%) |
Alokasi Port (%) |
|
|---|---|---|---|---|---|---|---|---|---|---|
| 2025-07-29 | 13F | Stratos Wealth Partners, LTD. | 1,511,634 | -1.17 | 55,613 | 9.48 | ||||
| 2025-08-12 | 13F | Jpmorgan Chase & Co | 685,926 | 8.83 | 25,235 | 20.56 | ||||
| 2025-08-14 | 13F | Great Valley Advisor Group, Inc. | 14,303 | -91.10 | 526 | -90.14 | ||||
| 2025-07-23 | 13F | Heck Capital Advisors, LLC | 461,922 | 16,994 | ||||||
| 2025-07-29 | 13F | Fundamentun, Llc | 1,978,098 | 4.39 | 72,774 | 15.64 | ||||
| 2025-08-13 | 13F | Northwestern Mutual Wealth Management Co | 110,244 | -46.99 | 4,056 | -41.28 | ||||
| 2025-08-14 | 13F | Royal Bank Of Canada | 477,034 | -16.81 | 17,551 | -7.83 | ||||
| 2025-08-14 | 13F | LM Advisors LLC | 40,568 | 2.56 | 1 | 0.00 | ||||
| 2025-08-14 | 13F | Bank Of America Corp /de/ | 4,425,196 | -10.10 | 162,803 | -0.40 | ||||
| 2025-07-17 | 13F | Janney Montgomery Scott LLC | 18,761 | 51.27 | 1 | |||||
| 2025-07-25 | 13F | Retirement Planning Group, Llc / Ny | 90,043 | 41.28 | 3,313 | 56.52 | ||||
| 2025-08-14 | 13F | Jane Street Group, Llc | 16,658,312 | 49,303.34 | 612,859 | 54,668.45 | ||||
| 2025-07-23 | 13F | Morey & Quinn Wealth Partners, LLC | 19,785 | 26.95 | 728 | 40.62 | ||||
| 2025-07-02 | 13F | Capital Market Strategies LLC | 10,558 | 388 | ||||||
| 2025-07-09 | 13F | WealthCare Investment Partners, LLC | 23,778 | 15.46 | 889 | 41.85 | ||||
| 2025-08-12 | 13F | Richmond Investment Services, LLC | 68,148 | 102.91 | 2,507 | 124.84 | ||||
| 2025-08-14 | 13F | Mml Investors Services, Llc | 374,045 | 6.36 | 14 | 18.18 | ||||
| 2025-08-04 | 13F | Amplius Wealth Advisors, LLC | 1,533,039 | 1.36 | 56,396 | 12.27 | ||||
| 2025-08-08 | 13F | Cetera Investment Advisers | 258,054 | -24.01 | 9,494 | -15.82 | ||||
| 2025-08-14 | 13F | Comerica Bank | 4,737 | -26.38 | 174 | -18.31 | ||||
| 2025-08-08 | 13F | Avantax Advisory Services, Inc. | 220,971 | 173.50 | 8,130 | 202.98 | ||||
| 2025-07-29 | 13F | Stratos Wealth Advisors, LLC | 8,856 | 326 | ||||||
| 2025-08-13 | 13F | MONECO Advisors, LLC | 5,921 | -6.24 | 218 | 3.83 | ||||
| 2025-08-08 | 13F | Comprehensive Financial Planning, Inc./PA | 1,007 | -6.33 | 37 | 5.71 | ||||
| 2025-08-07 | 13F | Fidelis Capital Partners, LLC | 49,943 | 1,896 | ||||||
| 2025-08-22 | NP | CTFAX - Columbia Thermostat Fund Class A | 2,732,920 | 125.79 | 100,544 | 150.13 | ||||
| 2025-07-21 | 13F | Ameritas Advisory Services, LLC | 70,820 | 102.04 | 2,605 | 115.82 | ||||
| 2025-07-21 | 13F | DHJJ Financial Advisors, Ltd. | 5 | 0.00 | 0 | |||||
| 2025-07-29 | 13F | Empirical Asset Management, LLC | 69,125 | 1.37 | 2,543 | 12.32 | ||||
| 2025-08-14 | 13F | Wiley Bros.-aintree Capital, Llc | 20,580 | 13.53 | 757 | 26.59 | ||||
| 2025-08-14 | 13F | Graney & King, LLC | 5,447 | 444.70 | 200 | 506.06 | ||||
| 2025-08-14 | 13F | Byrne Financial Freedom, Llc | 73,933 | 328.75 | 2,720 | 375.35 | ||||
| 2025-08-06 | 13F | Commonwealth Equity Services, Llc | 2,517,266 | 77.26 | 93 | 95.74 | ||||
| 2025-08-13 | 13F | Dana Investment Advisors, Inc. | 18,951 | 63.55 | 697 | 81.51 | ||||
| 2025-08-18 | 13F | Tyler-Stone Wealth Management | 10,264 | 0.98 | 378 | 11.87 | ||||
| 2025-07-17 | 13F | Archford Capital Strategies, LLC | 269,439 | 2.56 | 9,913 | 13.60 | ||||
| 2025-08-04 | 13F | Assetmark, Inc | 117 | 4 | ||||||
| 2025-07-18 | 13F | Truist Financial Corp | 8,231 | 30.82 | 303 | 45.19 | ||||
| 2025-07-23 | 13F | RiverTree Advisors, LLC | 8,180 | -5.92 | 301 | 4.17 | ||||
| 2025-08-06 | 13F | Mark Sheptoff Financial Planning, Llc | 385 | 0.00 | 14 | 16.67 | ||||
| 2025-08-05 | 13F | Scarborough Advisors, LLC | 567,951 | 30.34 | 20,895 | 44.39 | ||||
| 2025-08-04 | 13F | Daymark Wealth Partners, Llc | 720,517 | 14.10 | 26,508 | 26.40 | ||||
| 2025-08-11 | 13F | Trajan Wealth LLC | 555,620 | 0.12 | 20,441 | 10.92 | ||||
| 2025-08-05 | 13F | Snider Financial Group | 123,818 | 4,555 | ||||||
| 2025-08-13 | 13F | Balance Wealth, LLC | 54,725 | -81.88 | 2,013 | -79.93 | ||||
| 2025-07-15 | 13F | Palumbo Wealth Management LLC | 11,916 | 438 | ||||||
| 2025-07-30 | 13F | Bogart Wealth, LLC | 196,458 | 7.83 | 7,228 | 19.45 | ||||
| 2025-08-14 | 13F | Atomi Financial Group, Inc. | 7,061 | 260 | ||||||
| 2025-08-11 | 13F | Citigroup Inc | 65,065 | 1,517.73 | 2,394 | 1,699.25 | ||||
| 2025-07-23 | 13F | Drake & Associates, LLC | 840,273 | 4.37 | 30,914 | 15.61 | ||||
| 2025-08-19 | 13F | Advisory Services Network, LLC | 63,469 | 8.08 | 2,394 | 22.77 | ||||
| 2025-07-28 | 13F | Tower Wealth Partners, Inc. | 492,981 | 3.98 | 18,137 | 15.19 | ||||
| 2025-07-17 | 13F | KWB Wealth | 236,281 | 57.88 | 7,847 | 51.44 | ||||
| 2025-08-11 | 13F | Private Advisor Group, LLC | 112,533 | 3.26 | 4,140 | 14.40 | ||||
| 2025-08-06 | 13F | Golden State Wealth Management, LLC | 0 | -100.00 | 0 | -100.00 | ||||
| 2025-08-13 | 13F | Marshall Wace, Llp | 94,953 | 3,493 | ||||||
| 2025-08-15 | 13F | Morgan Stanley | 3,401,063 | 41.84 | 125,125 | 57.13 | ||||
| 2025-05-15 | 13F | Ameriflex Group, Inc. | 0 | -100.00 | 0 | |||||
| 2025-08-08 | 13F | Thoroughbred Financial Services, Llc | 29,108 | 10.73 | 1 | |||||
| 2025-08-13 | 13F | Copley Financial Group, Inc. | 6,643 | -5.61 | 244 | 4.72 | ||||
| 2025-04-07 | 13F | AdvisorNet Financial, Inc | 0 | -100.00 | 0 | |||||
| 2025-08-12 | 13F | BlueStem Wealth Partners, LLC | 1,062,939 | -32.72 | 39,106 | -25.47 | ||||
| 2025-05-09 | 13F | Goldman Sachs Group Inc | 0 | -100.00 | 0 | |||||
| 2025-08-05 | 13F | Mma Asset Management Llc | 24,955 | -8.73 | 918 | 1.10 | ||||
| 2025-09-04 | 13F/A | Advisor Group Holdings, Inc. | 637,841 | 108.52 | 23,465 | 131.00 | ||||
| 2025-08-11 | 13F | Western Wealth Management, LLC | 110,174 | 3.02 | 4,053 | 14.14 | ||||
| 2025-08-11 | 13F | Advisor Resource Council | 0 | -100.00 | 0 | |||||
| 2025-08-12 | 13F | Spectrum Wealth Advisory Group, LLC | 837,922 | -16.48 | 30,827 | -7.47 | ||||
| 2025-07-29 | 13F | Private Trust Co Na | 3,475 | 128 | ||||||
| 2025-07-29 | 13F | Riverbend Wealth Management, LLC | 14,803 | 38.60 | 545 | 53.67 | ||||
| 2025-07-11 | 13F | SILVER OAK SECURITIES, Inc | 80,568 | 2.77 | 2,964 | 14.57 | ||||
| 2025-08-13 | 13F | Denver Wealth Management, Inc. | 30,795 | 23.55 | 1,133 | 36.88 | ||||
| 2025-08-14 | 13F | Fmr Llc | 2,182 | 114.13 | 80 | 142.42 | ||||
| 2025-07-15 | 13F | Oxinas Partners Wealth Management LLC | 22,200 | 0.00 | 817 | 10.72 | ||||
| 2025-08-29 | 13F | Centaurus Financial, Inc. | 385,922 | 2.64 | 14 | 16.67 | ||||
| 2025-07-07 | 13F | RDA Financial Network | 105,535 | 6.41 | 3,883 | 17.89 | ||||
| 2025-08-14 | 13F | Paragon Private Wealth Management, LLC | 57,620 | 12.59 | 2,120 | 24.72 | ||||
| 2025-07-29 | 13F | Activest Wealth Management | 0 | 0 | ||||||
| 2025-08-12 | 13F | Proequities, Inc. | 0 | 0 | ||||||
| 2025-07-31 | 13F | Cambridge Investment Research Advisors, Inc. | 240,780 | 12.60 | 9 | 14.29 | ||||
| 2025-08-14 | 13F | Ameriprise Financial Inc | 12,963,845 | 22.35 | 476,940 | 35.54 | ||||
| 2025-07-09 | 13F | Fiduciary Alliance LLC | 6,883 | -11.30 | 253 | -1.56 | ||||
| 2025-07-16 | 13F | Perigon Wealth Management, LLC | 6,927 | 10.64 | 255 | 22.71 | ||||
| 2025-07-22 | 13F | DAVENPORT & Co LLC | 131,024 | 90.96 | 4,820 | 111.59 | ||||
| 2025-05-08 | 13F | Us Bancorp \de\ | 0 | -100.00 | 0 | |||||
| 2025-07-25 | 13F | Atria Wealth Solutions, Inc. | 55,103 | 62.11 | 2,027 | 79.70 | ||||
| 2025-08-06 | 13F/A | Three Cord True Wealth Management, LLC | 523,209 | 7.65 | 19,249 | 19.25 | ||||
| 2025-08-13 | 13F | Renaissance Technologies Llc | 27,900 | 1,026 | ||||||
| 2025-08-14 | 13F | Raymond James Financial Inc | 3,167,950 | 15.28 | 116,549 | 27.70 | ||||
| 2025-08-14 | 13F | Dagco, Inc. | 80,985 | 25.84 | 2,979 | 39.40 | ||||
| 2025-05-15 | 13F | Old Mission Capital Llc | 0 | -100.00 | 0 | |||||
| 2025-08-01 | 13F | Envestnet Asset Management Inc | 65,696 | 14.49 | 2,417 | 26.82 | ||||
| 2025-08-06 | 13F | Bensler, LLC | 227,616 | 3.67 | 8,374 | 14.84 | ||||
| 2025-07-08 | 13F | Paladin Wealth, LLC | 60,269 | 2.85 | 2,217 | 13.93 | ||||
| 2025-07-31 | 13F | Mason & Associates Inc | 1,029,239 | 37,866 | ||||||
| 2025-08-04 | 13F | Creative Financial Designs Inc /adv | 36 | 1 | ||||||
| 2025-07-31 | 13F | Richards, Merrill & Peterson, Inc. | 0 | -100.00 | 0 | |||||
| 2025-07-22 | 13F | USAdvisors Wealth Management, LLC | 160,450 | 5.13 | 6 | 0.00 | ||||
| 2025-08-14 | 13F | Keystone Financial Services, LLC | 6,698 | 246 | ||||||
| 2025-05-12 | 13F | Independent Advisor Alliance | 0 | -100.00 | 0 | |||||
| 2025-08-04 | 13F | Atria Investments Llc | 190,216 | 6.16 | 6,998 | 17.61 | ||||
| 2025-08-14 | 13F | Two Sigma Investments, Lp | 603,600 | 544.87 | 22,206 | 614.48 | ||||
| 2025-07-15 | 13F | Axis Wealth Partners, LLC | 33,241 | 13.75 | 1,223 | 25.98 | ||||
| 2025-08-18 | 13F | Arq Wealth Advisors, Llc | 214,206 | 0.00 | 7,114 | 0.00 | ||||
| 2025-08-15 | 13F | Kestra Advisory Services, LLC | 145,845 | 36.98 | 5,366 | 51.77 | ||||
| 2025-05-01 | 13F | Fulcrum Equity Management | 0 | -100.00 | 0 | |||||
| 2025-08-12 | 13F | LPL Financial LLC | 10,820,984 | 20.41 | 398,104 | 33.38 | ||||
| 2025-08-13 | 13F | Jones Financial Companies Lllp | 230,633 | 41.60 | 8,455 | 57.27 | ||||
| 2025-08-14 | 13F | Susquehanna International Group, Llp | 55,754 | -51.17 | 2,051 | -45.91 | ||||
| 2025-07-10 | 13F | Sovran Advisors, LLC | 92,334 | 33.27 | 3,417 | 58.86 | ||||
| 2025-08-08 | 13F | Larson Financial Group LLC | 2,277 | -39.92 | 84 | -33.60 | ||||
| 2025-08-14 | 13F | UBS Group AG | 366,954 | 159.97 | 13,500 | 188.03 | ||||
| 2025-08-14 | 13F | Citadel Advisors Llc | 17,151 | 16.67 | 631 | 29.10 | ||||
| 2025-08-14 | 13F | Integrated Wealth Concepts LLC | 5,912 | 218 | ||||||
| 2025-08-11 | 13F | Principal Securities, Inc. | 24,351 | 125.26 | 896 | 139.30 | ||||
| 2025-08-05 | 13F | Flynn Zito Capital Management, Llc | 155,216 | -0.15 | 5,710 | 10.62 | ||||
| 2025-08-15 | 13F | Equitable Holdings, Inc. | 12,430 | 85.52 | 457 | 105.86 | ||||
| 2025-08-13 | 13F | Congress Wealth Management LLC / DE / | 99,278 | 10.30 | 3,652 | 22.18 | ||||
| 2025-08-07 | 13F | Kestra Private Wealth Services, Llc | 241,380 | 34.51 | 8,880 | 49.02 | ||||
| 2025-08-07 | 13F | Allworth Financial LP | 1,961 | 38.39 | 72 | 60.00 | ||||
| 2025-08-12 | 13F | Global Retirement Partners, LLC | 2,732 | 2.32 | 101 | 8.70 | ||||
| 2025-08-12 | 13F | Gladstone Institutional Advisory LLC | 491,805 | 22.81 | 18,094 | 36.05 | ||||
| 2025-08-19 | 13F | National Asset Management, Inc. | 31,536 | 16.06 | 1,160 | 23.40 | ||||
| 2025-08-05 | 13F | Smith Shellnut Wilson Llc /adv | 23,069 | 22.94 | 849 | 36.12 | ||||
| 2025-04-24 | NP | NSGAX - Columbia Select Large Cap Equity Fund Class A | 43,258 | -60.52 | 1,520 | -61.51 | ||||
| 2025-07-08 | 13F | Gradient Investments LLC | 2,031,726 | 1.17 | 74,747 | 12.08 | ||||
| 2025-07-09 | 13F | Fermata Advisors, LLC | 101,501 | -0.73 | 3,734 | 9.99 | ||||
| 2025-08-14 | 13F | CoreCap Advisors, LLC | 106 | 0.00 | 4 | 0.00 | ||||
| 2025-07-10 | 13F | Wealth Enhancement Advisory Services, Llc | 320,671 | 394.61 | 11,983 | 456.57 | ||||
| 2025-07-31 | 13F | Leavell Investment Management, Inc. | 125,694 | 39.50 | 4,624 | 54.55 | ||||
| 2025-07-30 | 13F/A | KPP Advisory Services LLC | 45,678 | 196.11 | 1,680 | 228.13 | ||||
| 2025-08-12 | 13F | Cornerstone Wealth Management, LLC | 14,683 | 12.12 | 540 | 24.42 | ||||
| 2025-08-12 | 13F | SRS Capital Advisors, Inc. | 2,376 | -23.67 | 87 | -15.53 | ||||
| 2025-07-09 | 13F | Pines Wealth Management, LLC | 35,328 | 9.89 | 1,320 | 39.68 | ||||
| 2025-07-29 | 13F | Mattson Financial Services, LLC | 64,709 | -5.47 | 2,381 | 4.71 | ||||
| 2025-08-14 | 13F | Wells Fargo & Company/mn | 1,522,931 | 67.65 | 56,029 | 85.72 | ||||
| 2025-08-14 | 13F | GWM Advisors LLC | 357,751 | -0.73 | 13,162 | 9.97 | ||||
| 2025-07-28 | 13F | Harbour Investments, Inc. | 8,201 | 13.12 | 302 | 25.42 | ||||
| 2025-07-16 | 13F | Essex Financial Services, Inc. | 213,424 | 22.60 | 7,852 | 35.81 | ||||
| 2025-07-25 | 13F | Cwm, Llc | 196 | 0.00 | 0 | |||||
| 2025-08-15 | 13F | Brown Financial Advisors | 115,356 | -2.38 | 4,244 | 8.13 | ||||
| 2025-08-04 | 13F | Pensionmark Financial Group, Llc | 152,094 | -0.83 | 5,596 | 9.86 | ||||
| 2025-08-01 | 13F | PCA Investment Advisory Services Inc. | 17,464 | 24.71 | 643 | 38.06 | ||||
| 2025-04-17 | 13F | Tcfg Wealth Management, Llc | 0 | -100.00 | 0 | |||||
| 2025-08-13 | 13F | IAG Wealth Partners, LLC | 296,568 | 143.19 | 10,911 | 169.45 | ||||
| 2025-08-14 | 13F | Stifel Financial Corp | 179,979 | 898.88 | 6,621 | 1,007.19 | ||||
| 2025-07-30 | 13F | Prosperity Financial Group, Inc. | 39,656 | 32.34 | 1,459 | 46.53 | ||||
| 2025-08-12 | 13F | Inscription Capital, LLC | 39,399 | 1,449 | ||||||
| 2025-08-14 | 13F | Mariner, LLC | 126,650 | 31.44 | 4,659 | 45.59 | ||||
| 2025-08-01 | 13F | Y-Intercept (Hong Kong) Ltd | 22,849 | 841 | ||||||
| 2025-07-16 | 13F | Spirepoint Private Client, Llc | 64,672 | -8.88 | 2,379 | 0.93 | ||||
| 2025-06-25 | NP | LEGAX - Columbia Large Cap Growth Fund Class A | 169,788 | -50.53 | 5,572 | -54.33 | ||||
| 2025-08-12 | 13F | Steward Partners Investment Advisory, Llc | 90,084 | 13.78 | 3,314 | 26.06 |