Mga Batayang Estadistika
| Pemilik Institusional | 135 total, 135 long only, 0 short only, 0 long/short - change of 4.65% MRQ |
| Alokasi Portofolio Rata-rata | 0.1022 % - change of -8.21% MRQ |
| Saham Institusional (Jangka Panjang) | 9,193,342 (ex 13D/G) - change of 0.40MM shares 4.50% MRQ |
| Nilai Institusional (Jangka Panjang) | $ 203,048 USD ($1000) |
Kepemilikan Institusional dan Pemegang Saham
Cohen & Steers REIT and Preferred Income Fund, Inc. (US:RNP) memiliki 135 pemilik institusional dan pemegang saham yang telah mengajukan formulir 13D/G atau 13F kepada Komisi Bursa Efek (Securities Exchange Commission/SEC). Lembaga-lembaga ini memegang total 9,193,342 saham. Pemegang saham terbesar meliputi Morgan Stanley, Ellis Investment Partners, LLC, LPL Financial LLC, Raymond James Financial Inc, Ameriprise Financial Inc, Bank Of America Corp /de/, Wells Fargo & Company/mn, XML Financial, LLC, Royal Bank Of Canada, and UBS Group AG .
Struktur kepemilikan institusional Cohen & Steers REIT and Preferred Income Fund, Inc. (NYSE:RNP) menunjukkan posisi terkini di perusahaan oleh institusi dan dana, serta perubahan terbaru dalam ukuran posisi. Pemegang saham utama dapat mencakup investor individu, reksa dana, dana lindung nilai, atau institusi. Jadwal 13D menunjukkan bahwa investor memegang (atau pernah memegang) lebih dari 5% saham perusahaan dan bermaksud (atau pernah bermaksud) untuk secara aktif mengejar perubahan strategi bisnis. Jadwal 13G menunjukkan investasi pasif lebih dari 5%.
The share price as of September 5, 2025 is 22.23 / share. Previously, on September 6, 2024, the share price was 23.49 / share. This represents a decline of 5.36% over that period.

Skor Sentimen Dana
Skor Sentimen Dana (sebelumnya dikenal sebagai Skor Akumulasi Kepemilikan) menemukan saham-saham yang paling banyak dibeli oleh dana. Ini adalah hasil dari model kuantitatif multi-faktor yang canggih yang mengidentifikasi perusahaan dengan tingkat akumulasi institusional tertinggi. Model penilaian menggunakan kombinasi dari total peningkatan pemilik yang diungkapkan, perubahan dalam alokasi portofolio pada pemilik tersebut, dan metrik lainnya. Angka berkisar dari 0 hingga 100, dengan angka yang lebih tinggi menunjukkan tingkat akumulasi yang lebih tinggi dibandingkan dengan perusahaan sejenisnya, dan 50 adalah rata-ratanya.
Frekuensi Pembaruan: Setiap Hari
Lihat Ownership Explorer, yang menyediakan daftar perusahaan dengan peringkat tertinggi.
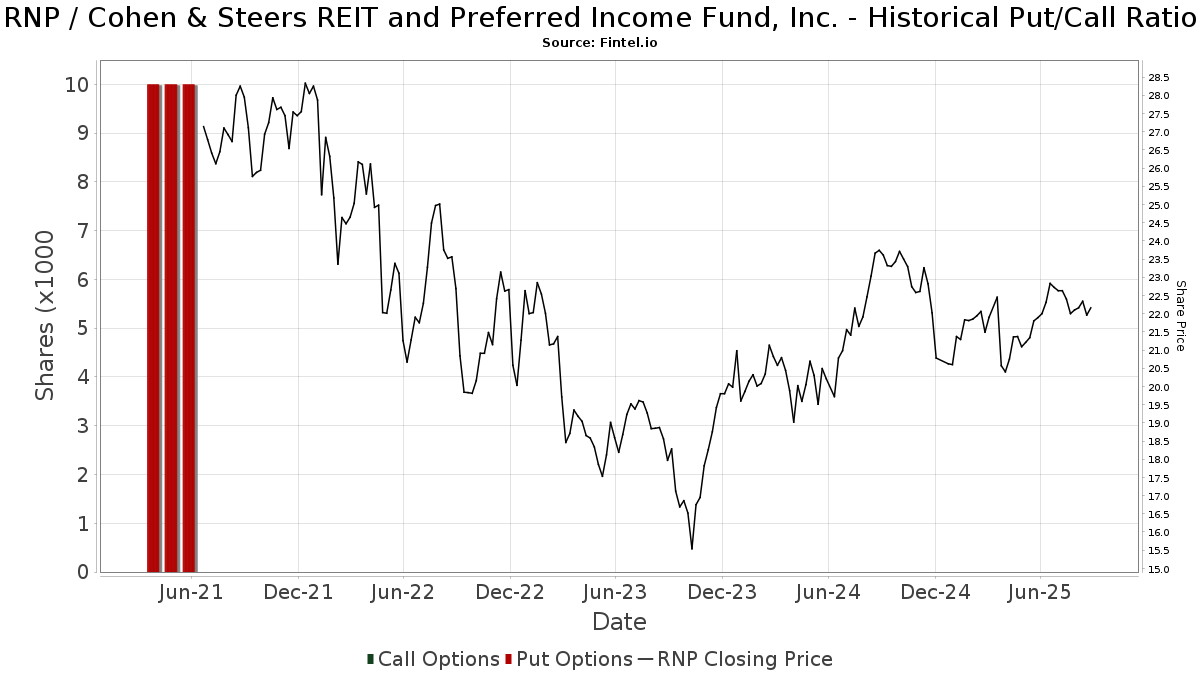
Rasio Put/Call Institusional
Selain melaporkan isu ekuitas dan utang standar, institusi dengan aset di bawah manajemen lebih dari 100 juta dolar AS juga harus mengungkapkan kepemilikan opsi put dan call mereka. Karena opsi put umumnya menunjukkan sentimen negatif, dan opsi call menunjukkan sentimen positif, kita dapat mengetahui sentimen institusional secara keseluruhan dengan memplot rasio put terhadap call. Grafik di sebelah kanan memplot rasio put/call historis untuk instrumen ini.
Menggunakan Rasio Put/Call sebagai indikator sentimen investor mengatasi salah satu kekurangan utama dari penggunaan total kepemilikan institusional, yaitu sejumlah besar aset yang dikelola diinvestasikan secara pasif untuk melacak indeks. Dana yang dikelola secara pasif biasanya tidak membeli opsi, sehingga indikator rasio put/call lebih akurat dalam melacak sentimen dana yang dikelola secara aktif.
Pengajuan 13F dan NPORT
Detail pada pengajuan 13F tersedia gratis. Detail pada pengajuan NP memerlukan keanggotaan premium. Baris berwarna hijau menunjukkan posisi baru. Baris berwarna merah menunjukkan posisi yang sudah ditutup. Klik tautan ini ikon untuk melihat riwayat transaksi selengkapnya.
Tingkatkan
untuk membuka data premium dan mengekspor ke Excel ![]() .
.
| Tanggal File | Sumber | Investor | Ketik | Presyo ng Avg (Silangan) |
Saham | Δ Saham (%) |
Dilaporkan Nilai ($1000) |
Nilai Δ (%) |
Alokasi Port (%) |
|
|---|---|---|---|---|---|---|---|---|---|---|
| 2025-08-11 | 13F | TD Waterhouse Canada Inc. | 5,000 | 0.00 | 114 | 3.67 | ||||
| 2025-07-30 | 13F | D.a. Davidson & Co. | 10,754 | 4.88 | 245 | 7.96 | ||||
| 2025-07-29 | 13F | Koshinski Asset Management, Inc. | 79,709 | 8.80 | 1,815 | 12.25 | ||||
| 2025-08-14 | 13F | Mml Investors Services, Llc | 9,053 | -71.52 | 0 | -100.00 | ||||
| 2025-04-21 | 13F | Nelson, Van Denburg & Campbell Wealth Management Group, LLC | 0 | -100.00 | 0 | |||||
| 2025-07-17 | 13F | Janney Montgomery Scott LLC | 15,103 | 0.07 | 0 | |||||
| 2025-07-18 | 13F | Bartlett & Co. Wealth Management Llc | 48,535 | 1.36 | 1,105 | 4.64 | ||||
| 2025-08-11 | 13F | Shufro Rose & Co Llc | 49,300 | -1.00 | 1,088 | -1.00 | ||||
| 2025-08-08 | 13F | Islay Capital Management, Llc | 3,000 | 0.00 | 68 | 3.03 | ||||
| 2025-08-04 | 13F | JDM Financial Group LLC | 482 | 0.00 | 11 | 0.00 | ||||
| 2025-08-14 | 13F | Comerica Bank | 16,444 | 0.04 | 374 | 3.31 | ||||
| 2025-07-21 | 13F | Ameritas Advisory Services, LLC | 10,725 | 244 | ||||||
| 2025-08-18 | 13F | Geneos Wealth Management Inc. | 4,946 | 1.87 | 113 | 4.67 | ||||
| 2025-07-08 | 13F | Parallel Advisors, LLC | 3 | 0.00 | 0 | |||||
| 2025-07-31 | 13F | Hartford Financial Management Inc. | 444 | 0.00 | 10 | 11.11 | ||||
| 2025-07-31 | 13F | Moloney Securities Asset Management, LLC | 18,740 | 2.11 | 427 | 5.19 | ||||
| 2025-08-08 | 13F | Cetera Investment Advisers | 152,306 | 0.06 | 3,468 | 3.25 | ||||
| 2025-08-14 | 13F | Wiley Bros.-aintree Capital, Llc | 35,577 | 7.26 | 810 | 11.42 | ||||
| 2025-08-12 | 13F | Jpmorgan Chase & Co | 664 | 15 | ||||||
| 2025-07-25 | 13F | Atria Wealth Solutions, Inc. | 0 | -100.00 | 0 | |||||
| 2025-04-29 | 13F | Lee Danner & Bass Inc | 0 | -100.00 | 0 | -100.00 | ||||
| 2025-08-14 | 13F | IHT Wealth Management, LLC | 9,348 | -4.50 | 213 | -1.85 | ||||
| 2025-08-07 | 13F | Samalin Investment Counsel, LLC | 45,167 | 4.09 | 1,028 | 7.42 | ||||
| 2025-07-25 | 13F | Ellis Investment Partners, LLC | 1,199,662 | 0.23 | 27,316 | 3.41 | ||||
| 2025-08-06 | 13F | Commonwealth Equity Services, Llc | 187,384 | 13.28 | 4 | 33.33 | ||||
| 2025-07-25 | NP | FCEF - First Trust CEF Income Opportunity ETF This fund is a listed as child fund of First Trust Advisors Lp and if that institution has disclosed ownership in this security, then these positions will not be double counted when calculating total shares and total value | 52,230 | 4.77 | 1,135 | 1.89 | ||||
| 2025-08-13 | 13F | Johnson Financial Group, Inc. | 155,793 | -2.25 | 3,547 | 0.85 | ||||
| 2025-08-12 | 13F | Wealthbridge Capital Management, Llc | 21,950 | 3.54 | 500 | 6.85 | ||||
| 2025-07-18 | 13F | Consolidated Portfolio Review Corp | 113,031 | 15.17 | 2,574 | 18.79 | ||||
| 2025-08-12 | 13F | Advisors Asset Management, Inc. | 43,538 | -0.31 | 991 | 2.91 | ||||
| 2025-08-07 | 13F | Hennion & Walsh Asset Management, Inc. | 99,402 | 52.07 | 2,263 | 56.93 | ||||
| 2025-08-12 | 13F | Manchester Capital Management LLC | 4,000 | 0.00 | 91 | 3.41 | ||||
| 2025-08-12 | 13F | Insigneo Advisory Services, Llc | 23,800 | 0.00 | 542 | 3.05 | ||||
| 2025-07-17 | 13F | Venture Visionary Partners LLC | 86,467 | 8.98 | 1,969 | 12.39 | ||||
| 2025-08-08 | 13F | Fortis Group Advisors, LLC | 600 | 0.00 | 14 | 0.00 | ||||
| 2025-07-15 | 13F | Fifth Third Bancorp | 9,000 | 0.00 | 205 | 3.03 | ||||
| 2025-07-15 | 13F | Main Street Group, LTD | 1,040 | 0.00 | 24 | 4.55 | ||||
| 2025-08-19 | 13F | Advisory Services Network, LLC | 11,833 | 0.31 | 264 | 1.15 | ||||
| 2025-05-22 | NP | Cornerstone Total Return Fund Inc | 13,494 | -76.63 | 298 | -75.37 | ||||
| 2025-08-15 | 13F | Morgan Stanley | 1,300,655 | -0.18 | 29,616 | 2.98 | ||||
| 2025-08-11 | 13F | Principal Securities, Inc. | 228 | 5 | ||||||
| 2025-07-16 | 13F | American National Bank | 218 | 0.00 | 5 | 0.00 | ||||
| 2025-05-06 | 13F | Readystate Asset Management Lp | 0 | -100.00 | 0 | -100.00 | ||||
| 2025-05-22 | NP | Cornerstone Strategic Value Fund Inc | 62,948 | 415.08 | 1,389 | 444.71 | ||||
| 2025-05-13 | 13F | Elequin Capital Lp | 0 | -100.00 | 0 | |||||
| 2025-08-13 | 13F | Invesco Ltd. | 22,867 | -18.58 | 521 | -15.99 | ||||
| 2025-08-12 | 13F | CIBC Private Wealth Group, LLC | 3 | 200.00 | 0 | |||||
| 2025-07-30 | 13F | Bogart Wealth, LLC | 560 | 0.00 | 13 | 0.00 | ||||
| 2025-05-16 | 13F | McIlrath & Eck, LLC | 0 | -100.00 | 0 | |||||
| 2025-08-18 | 13F | Hollencrest Capital Management | 10 | 0.00 | 0 | |||||
| 2025-08-15 | 13F | Provenance Wealth Advisors, LLC | 0 | -100.00 | 0 | -100.00 | ||||
| 2025-08-11 | 13F | Private Advisor Group, LLC | 35,024 | -3.22 | 798 | -0.13 | ||||
| 2025-07-18 | 13F | SOA Wealth Advisors, LLC. | 0 | -100.00 | 0 | |||||
| 2025-08-15 | 13F | Tower Research Capital LLC (TRC) | 2 | 0.00 | 0 | |||||
| 2025-04-28 | 13F | Strategic Financial Concepts, LLC | 0 | -100.00 | 0 | -100.00 | ||||
| 2025-08-19 | 13F | Cape Investment Advisory, Inc. | 600 | 0.00 | 14 | 0.00 | ||||
| 2025-05-19 | 13F | Smith Asset Management Co., LLC | 24,683 | 23.55 | 545 | 30.46 | ||||
| 2025-07-11 | 13F | SILVER OAK SECURITIES, Inc | 12,700 | 289 | ||||||
| 2025-07-31 | 13F | Cambridge Investment Research Advisors, Inc. | 49,782 | -0.85 | 1 | 0.00 | ||||
| 2025-08-14 | 13F | Bank Of America Corp /de/ | 580,077 | -0.66 | 13,208 | 2.49 | ||||
| 2025-05-14 | 13F | Landscape Capital Management, L.l.c. | 0 | -100.00 | 0 | |||||
| 2025-07-29 | 13F | Private Trust Co Na | 7,219 | 0.00 | 164 | 3.14 | ||||
| 2025-08-14 | 13F | Ameriprise Financial Inc | 592,522 | 34.90 | 13,491 | 39.12 | ||||
| 2025-07-21 | 13F | Investment Planning Advisors, Inc. | 15,339 | -34.69 | 349 | -32.63 | ||||
| 2025-08-29 | 13F | Total Investment Management Inc | 64 | 1 | ||||||
| 2025-07-24 | 13F | Capital Advisors, Ltd. LLC | 1,987 | 0.00 | 0 | |||||
| 2025-09-04 | 13F/A | Advisor Group Holdings, Inc. | 117,179 | 16.99 | 2,669 | 20.72 | ||||
| 2025-07-17 | 13F/A | Capital Investment Advisors, LLC | 50,274 | -4.88 | 1,145 | -1.89 | ||||
| 2025-08-13 | 13F | Northwestern Mutual Wealth Management Co | 15,007 | -1.22 | 342 | 1.79 | ||||
| 2025-07-25 | 13F | Hazlett, Burt & Watson, Inc. | 213 | 1.91 | 0 | |||||
| 2025-07-10 | 13F | Kozak & Associates, Inc. | 466 | 11 | ||||||
| 2025-08-13 | 13F | Northern Trust Corp | 16,613 | 0.33 | 378 | 3.56 | ||||
| 2025-08-12 | 13F | MAI Capital Management | 4,045 | 0.00 | 92 | 3.37 | ||||
| 2025-08-08 | 13F | Larson Financial Group LLC | 0 | -100.00 | 0 | |||||
| 2025-08-14 | 13F | UBS Group AG | 272,574 | 2.98 | 6,207 | 6.25 | ||||
| 2025-08-12 | 13F | Steward Partners Investment Advisory, Llc | 30,125 | 4.42 | 686 | 7.70 | ||||
| 2025-07-17 | 13F | Camelot Portfolios, LLC | 23,096 | -4.79 | 526 | -1.87 | ||||
| 2025-07-24 | 13F | Us Bancorp \de\ | 1,261 | -90.04 | 29 | -89.96 | ||||
| 2025-08-14 | 13F | Modern Wealth Management, LLC | 9,520 | -26.88 | 217 | -24.74 | ||||
| 2025-07-15 | 13F | Oregon Pacific Wealth Management, LLC | 14,400 | -3.88 | 328 | -0.91 | ||||
| 2025-07-07 | 13F | RB Capital Management, LLC | 22,783 | -4.14 | 519 | -1.15 | ||||
| 2025-08-14 | 13F | Sunbelt Securities, Inc. | 150 | 0.00 | 3 | 0.00 | ||||
| 2025-07-21 | 13F | Ameriflex Group, Inc. | 1,469 | 0.00 | 33 | 0.00 | ||||
| 2025-07-11 | 13F | Caldwell Securities, Inc | 3,000 | 0.00 | 68 | 3.03 | ||||
| 2025-05-08 | 13F | We Are One Seven, LLC | 0 | -100.00 | 0 | |||||
| 2025-08-14 | 13F | Beaird Harris Wealth Management, LLC | 300 | 0.00 | 7 | 0.00 | ||||
| 2025-08-01 | 13F | Envestnet Asset Management Inc | 14,519 | -16.57 | 331 | -14.06 | ||||
| 2025-08-15 | 13F | Kestra Advisory Services, LLC | 49,554 | 3.90 | 1,128 | 7.22 | ||||
| 2025-07-21 | 13F | Future Financial Wealth Managment LLC | 0 | -100.00 | 0 | |||||
| 2025-07-28 | 13F | Harbour Investments, Inc. | 119,704 | 40.57 | 2,726 | 45.02 | ||||
| 2025-04-18 | 13F | JP Wealth Management, Inc. | 0 | -100.00 | 0 | |||||
| 2025-07-22 | 13F | DAVENPORT & Co LLC | 15,686 | 0.00 | 357 | 3.18 | ||||
| 2025-07-24 | 13F | Ronald Blue Trust, Inc. | 257 | 6 | ||||||
| 2025-08-04 | 13F | Spire Wealth Management | 6,115 | 1.88 | 139 | 5.30 | ||||
| 2025-08-19 | 13F | Campbell Capital Management Inc | 59,139 | -3.27 | 1,347 | -0.22 | ||||
| 2025-07-25 | 13F | Cwm, Llc | 2,983 | -29.93 | 0 | |||||
| 2025-08-13 | 13F | Jones Financial Companies Lllp | 35 | -98.25 | 1 | -100.00 | ||||
| 2025-05-15 | 13F | WPG Advisers, LLC | 0 | -100.00 | 0 | -100.00 | ||||
| 2025-08-06 | 13F | Atlantic Union Bankshares Corp | 48,934 | -7.73 | 1,114 | -4.79 | ||||
| 2025-08-14 | 13F | Royal Bank Of Canada | 310,099 | 3.57 | 7,060 | 6.84 | ||||
| 2025-08-08 | 13F | Pnc Financial Services Group, Inc. | 13,789 | -14.30 | 314 | -11.83 | ||||
| 2025-07-29 | 13F | International Assets Investment Management, Llc | 13,843 | 1.47 | 315 | 4.65 | ||||
| 2025-08-07 | 13F | Parkside Financial Bank & Trust | 2,500 | 0.00 | 57 | 1.82 | ||||
| 2025-07-10 | 13F | Wealth Enhancement Advisory Services, Llc | 19,540 | 31.83 | 447 | 36.39 | ||||
| 2025-08-07 | 13F | Lakeridge Wealth Management LLC | 9,770 | 0.00 | 222 | 3.26 | ||||
| 2025-08-14 | 13F | Colony Group, LLC | 19,784 | -1.97 | 450 | 1.12 | ||||
| 2025-07-10 | 13F | Secure Asset Management, LLC | 25,143 | 0.13 | 572 | 3.25 | ||||
| 2025-08-07 | 13F | McClarren Financial Advisors, Inc. | 0 | -100.00 | 0 | |||||
| 2025-08-05 | 13F | NewSquare Capital LLC | 1,500 | 0.00 | 34 | 3.03 | ||||
| 2025-08-08 | 13F | Cornerstone Advisors, LLC | 0 | -100.00 | 0 | |||||
| 2025-08-12 | 13F | LPL Financial LLC | 818,404 | 6.89 | 18,635 | 10.28 | ||||
| 2025-08-12 | 13F | AlphaCore Capital LLC | 33,997 | 10.06 | 774 | 13.66 | ||||
| 2025-07-07 | 13F | Trust Co | 400 | 0.00 | 9 | 12.50 | ||||
| 2025-08-12 | 13F | NWF Advisory Services Inc. | 9,902 | 219 | ||||||
| 2025-05-16 | 13F | Coppell Advisory Solutions LLC | 0 | -100.00 | 0 | |||||
| 2025-08-08 | 13F | Hartland & Co., LLC | 2,000 | 46 | ||||||
| 2025-07-17 | 13F | LexAurum Advisors, LLC | 12,218 | 1.03 | 278 | 4.51 | ||||
| 2025-07-17 | 13F | Wolff Wiese Magana Llc | 28 | 0.00 | 1 | |||||
| 2025-08-12 | 13F | one8zero8, LLC | 11,000 | 0.00 | 250 | 3.31 | ||||
| 2025-08-13 | 13F | EverSource Wealth Advisors, LLC | 2,750 | 0.00 | 63 | 3.33 | ||||
| 2025-08-14 | 13F | Wells Fargo & Company/mn | 383,144 | 4.33 | 8,724 | 7.65 | ||||
| 2025-07-17 | 13F | XML Financial, LLC | 313,706 | 41.72 | 7,143 | 46.22 | ||||
| 2025-08-14 | 13F | GWM Advisors LLC | 818 | 0.00 | 19 | 0.00 | ||||
| 2025-08-14 | 13F | CoreCap Advisors, LLC | 4,155 | -0.02 | 95 | 3.30 | ||||
| 2025-08-12 | 13F | Proequities, Inc. | 0 | 0 | ||||||
| 2025-07-15 | 13F | Wealth Effects Llc | 13,800 | -15.34 | 314 | -12.53 | ||||
| 2025-07-21 | 13F | TFG Advisers LLC | 11,919 | -0.38 | 271 | 2.65 | ||||
| 2025-08-04 | 13F | MeadowBrook Investment Advisors LLC | 0 | -100.00 | 0 | |||||
| 2025-08-11 | 13F | Strategic Wealth Partners, Ltd. | 2,050 | 47 | ||||||
| 2025-08-13 | 13F | First Trust Advisors Lp | 80,097 | -6.24 | 1,824 | -3.29 | ||||
| 2025-08-12 | 13F | Intellus Advisors LLC | 9,721 | 5.22 | 221 | 8.87 | ||||
| 2025-08-07 | 13F | Allworth Financial LP | 2,214 | 330.74 | 50 | 400.00 | ||||
| 2025-05-14 | 13F | Monterey Private Wealth, Inc. | 9,902 | 0.00 | 219 | 5.83 | ||||
| 2025-05-12 | 13F | Wolverine Asset Management Llc | 0 | -100.00 | 0 | |||||
| 2025-07-31 | 13F | West Michigan Advisors, Llc | 15,791 | 0.31 | 360 | 3.46 | ||||
| 2025-08-08 | 13F | Creative Planning | 18,389 | 0.78 | 419 | 3.98 | ||||
| 2025-07-10 | 13F | Exchange Traded Concepts, Llc | 350 | 8 | ||||||
| 2025-07-11 | 13F | Annex Advisory Services, LLC | 8,827 | 201 | ||||||
| 2025-08-12 | 13F | Cornerstone Wealth Management, LLC | 9,244 | -66.62 | 210 | -85.34 | ||||
| 2025-08-11 | 13F | HighTower Advisors, LLC | 25,416 | 38.30 | 579 | 42.72 | ||||
| 2025-07-07 | 13F | Investors Research Corp | 2,200 | 0.00 | 50 | 4.17 | ||||
| 2025-08-08 | 13F | TD Capital Management LLC | 409 | 0.00 | 9 | 0.00 | ||||
| 2025-07-24 | 13F | IFP Advisors, Inc | 259 | 0.00 | 6 | 0.00 | ||||
| 2025-05-14 | 13F | Jane Street Group, Llc | 0 | -100.00 | 0 | |||||
| 2025-07-08 | 13F | Nbc Securities, Inc. | 1,400 | -48.15 | 0 | |||||
| 2025-08-01 | 13F | Oarsman Capital, Inc. | 42,350 | -3.75 | 964 | -0.72 | ||||
| 2025-05-14 | 13F | Van Hulzen Asset Management, LLC | 0 | -100.00 | 0 | -100.00 | ||||
| 2025-07-16 | 13F | Magnus Financial Group LLC | 19,956 | 0.13 | 454 | 3.42 | ||||
| 2025-07-24 | 13F | Costello Asset Management, INC | 416 | 0.00 | 9 | 0.00 | ||||
| 2025-08-14 | 13F | Hurley Capital, LLC | 1,000 | 23 | ||||||
| 2025-08-11 | 13F | Nations Financial Group Inc, /ia/ /adv | 17,649 | -11.02 | 402 | -8.24 | ||||
| 2025-04-01 | 13F/A | Talon Private Wealth, LLC | 0 | -100.00 | 0 | -100.00 | ||||
| 2025-08-13 | 13F | Everstar Asset Management, LLC | 29,260 | -9.86 | 666 | -6.98 | ||||
| 2025-07-30 | 13F | Cullen/frost Bankers, Inc. | 2,709 | 0.00 | 62 | 3.39 | ||||
| 2025-07-14 | 13F | Toth Financial Advisory Corp | 835 | 4.38 | 19 | 11.76 | ||||
| 2025-07-17 | 13F | Sound Income Strategies, LLC | 39,283 | -12.37 | 894 | -9.61 | ||||
| 2025-08-14 | 13F | Mariner, LLC | 10,372 | 7.81 | 236 | 11.32 | ||||
| 2025-08-04 | 13F | HBK Sorce Advisory LLC | 10,687 | 0.07 | 243 | 3.40 | ||||
| 2025-08-14 | 13F | Raymond James Financial Inc | 705,164 | 1.91 | 16,057 | 5.14 |