Mga Batayang Estadistika
| Saham Institusional (Jangka Panjang) | 2,043,400 - 14.02% (ex 13D/G) - change of -0.03MM shares -1.29% MRQ |
| Nilai Institusional (Jangka Panjang) | $ 129,259 USD ($1000) |
Kepemilikan Institusional dan Pemegang Saham
Sabine Royalty Trust (US:SBR) memiliki 142 pemilik institusional dan pemegang saham yang telah mengajukan formulir 13D/G atau 13F kepada Komisi Bursa Efek (Securities Exchange Commission/SEC). Lembaga-lembaga ini memegang total 2,043,400 saham. Pemegang saham terbesar meliputi Beacon Pointe Advisors, LLC, King Luther Capital Management Corp, Fayez Sarofim & Co, Horizon Kinetics Asset Management Llc, Morgan Stanley, INFL - Horizon Kinetics Inflation Beneficiaries ETF, Howard Financial Services, Ltd., Two Sigma Investments, Lp, Americana Partners, LLC, and Chilton Capital Management Llc .
Struktur kepemilikan institusional Sabine Royalty Trust (NYSE:SBR) menunjukkan posisi terkini di perusahaan oleh institusi dan dana, serta perubahan terbaru dalam ukuran posisi. Pemegang saham utama dapat mencakup investor individu, reksa dana, dana lindung nilai, atau institusi. Jadwal 13D menunjukkan bahwa investor memegang (atau pernah memegang) lebih dari 5% saham perusahaan dan bermaksud (atau pernah bermaksud) untuk secara aktif mengejar perubahan strategi bisnis. Jadwal 13G menunjukkan investasi pasif lebih dari 5%.
The share price as of September 5, 2025 is 74.39 / share. Previously, on September 6, 2024, the share price was 61.30 / share. This represents an increase of 21.35% over that period.

Skor Sentimen Dana
Skor Sentimen Dana (sebelumnya dikenal sebagai Skor Akumulasi Kepemilikan) menemukan saham-saham yang paling banyak dibeli oleh dana. Ini adalah hasil dari model kuantitatif multi-faktor yang canggih yang mengidentifikasi perusahaan dengan tingkat akumulasi institusional tertinggi. Model penilaian menggunakan kombinasi dari total peningkatan pemilik yang diungkapkan, perubahan dalam alokasi portofolio pada pemilik tersebut, dan metrik lainnya. Angka berkisar dari 0 hingga 100, dengan angka yang lebih tinggi menunjukkan tingkat akumulasi yang lebih tinggi dibandingkan dengan perusahaan sejenisnya, dan 50 adalah rata-ratanya.
Frekuensi Pembaruan: Setiap Hari
Lihat Ownership Explorer, yang menyediakan daftar perusahaan dengan peringkat tertinggi.
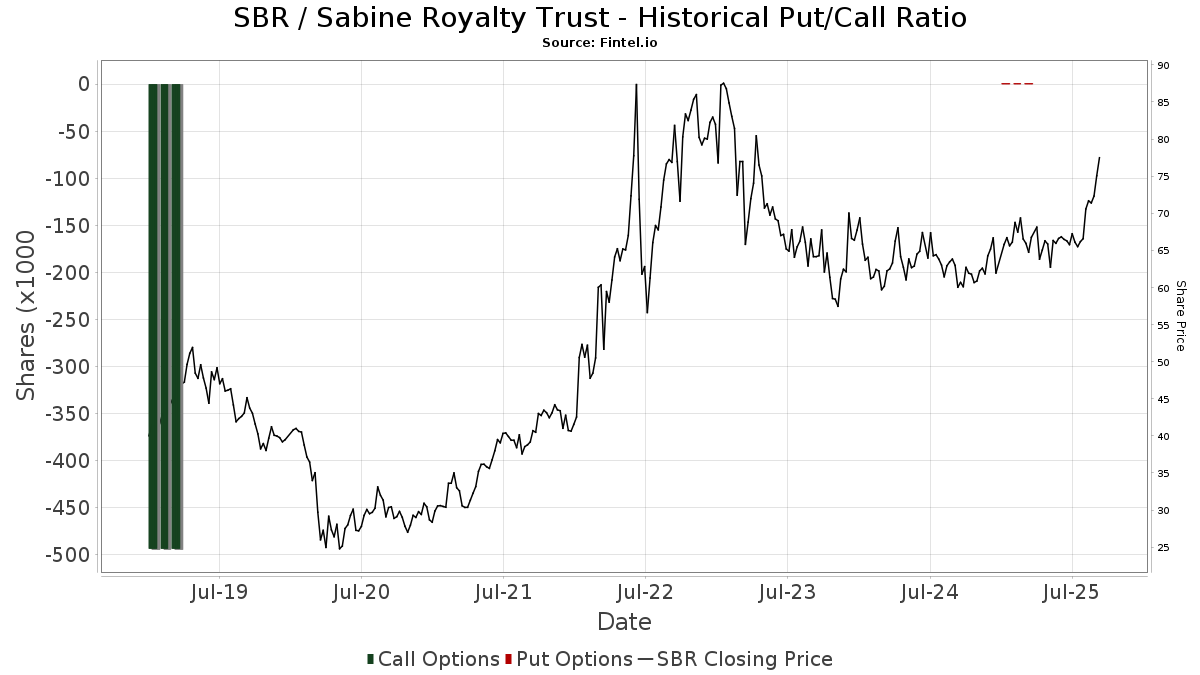
Rasio Put/Call Institusional
Selain melaporkan isu ekuitas dan utang standar, institusi dengan aset di bawah manajemen lebih dari 100 juta dolar AS juga harus mengungkapkan kepemilikan opsi put dan call mereka. Karena opsi put umumnya menunjukkan sentimen negatif, dan opsi call menunjukkan sentimen positif, kita dapat mengetahui sentimen institusional secara keseluruhan dengan memplot rasio put terhadap call. Grafik di sebelah kanan memplot rasio put/call historis untuk instrumen ini.
Menggunakan Rasio Put/Call sebagai indikator sentimen investor mengatasi salah satu kekurangan utama dari penggunaan total kepemilikan institusional, yaitu sejumlah besar aset yang dikelola diinvestasikan secara pasif untuk melacak indeks. Dana yang dikelola secara pasif biasanya tidak membeli opsi, sehingga indikator rasio put/call lebih akurat dalam melacak sentimen dana yang dikelola secara aktif.
Pengajuan 13F dan NPORT
Detail pada pengajuan 13F tersedia gratis. Detail pada pengajuan NP memerlukan keanggotaan premium. Baris berwarna hijau menunjukkan posisi baru. Baris berwarna merah menunjukkan posisi yang sudah ditutup. Klik tautan ini ikon untuk melihat riwayat transaksi selengkapnya.
Tingkatkan
untuk membuka data premium dan mengekspor ke Excel ![]() .
.
| Tanggal File | Sumber | Investor | Ketik | Presyo ng Avg (Silangan) |
Saham | Δ Saham (%) |
Dilaporkan Nilai ($1000) |
Nilai Δ (%) |
Alokasi Port (%) |
|
|---|---|---|---|---|---|---|---|---|---|---|
| 2025-07-31 | 13F | Mcdaniel Terry & Co | 14,000 | 0.00 | 934 | |||||
| 2025-08-12 | 13F | XTX Topco Ltd | 0 | -100.00 | 0 | |||||
| 2025-08-14 | 13F | Fayez Sarofim & Co | 134,038 | -40.60 | 8,938 | -41.48 | ||||
| 2025-08-14 | 13F | Citadel Advisors Llc | 26,095 | 128.12 | 1,740 | 124.81 | ||||
| 2025-07-31 | 13F/A | Sendero Wealth Management, LLC | 12,927 | 0.00 | 862 | -1.60 | ||||
| 2025-07-23 | 13F | Citizens National Bank Trust Department | 1,000 | 0.00 | 67 | -1.49 | ||||
| 2025-05-06 | 13F | Venturi Wealth Management, LLC | 0 | -100.00 | 0 | |||||
| 2025-07-25 | 13F | Ackerman Capital Advisors, LLC | 3,417 | 0.00 | 227 | -1.30 | ||||
| 2025-08-15 | 13F | CI Private Wealth, LLC | 6,883 | 0.00 | 459 | -1.51 | ||||
| 2025-08-14 | 13F/A | Skopos Labs, Inc. | 54 | 14.89 | 4 | 0.00 | ||||
| 2025-08-21 | NP | LUSIX - Lazard US Systematic Small Cap Equity Portfolio Institutional Shares | 843 | -4.10 | 56 | -5.08 | ||||
| 2025-07-30 | 13F | Exencial Wealth Advisors, Llc | 10,357 | 0.00 | 688 | -1.43 | ||||
| 2025-04-29 | 13F | Envestnet Asset Management Inc | 0 | -100.00 | 0 | |||||
| 2025-08-15 | 13F | Morgan Stanley | 90,466 | 27.18 | 6,032 | 25.28 | ||||
| 2025-08-14 | 13F | Chilton Investment Co Llc | 9,067 | 0.00 | 605 | -1.47 | ||||
| 2025-08-19 | 13F | Advisory Services Network, LLC | 10,796 | 249.61 | 716 | 242.11 | ||||
| 2025-08-28 | NP | NVIR - Horizon Kinetics Energy and Remediation ETF | 493 | 0.00 | 33 | -3.03 | ||||
| 2025-08-13 | 13F | Russell Investments Group, Ltd. | 10 | 0.00 | 1 | |||||
| 2025-07-29 | 13F | Burford Brothers, Inc. | 10,142 | 1.42 | 674 | -0.15 | ||||
| 2025-07-10 | 13F | Clare Market Investments LLC | 27,643 | -0.54 | 1,843 | -2.02 | ||||
| 2025-08-08 | 13F | Creative Planning | 17,070 | -0.58 | 1,135 | -2.07 | ||||
| 2025-08-01 | 13F | Transcend Wealth Collective, Llc | 14,480 | 0.00 | 966 | -1.53 | ||||
| 2025-08-14 | 13F | Fmr Llc | 160 | -57.10 | 11 | -60.00 | ||||
| 2025-08-12 | 13F | BlackRock, Inc. | 50 | 0.00 | 3 | 0.00 | ||||
| 2025-07-29 | 13F | Oxbow Advisors, LLC | 4,091 | 0.00 | 272 | -1.45 | ||||
| 2025-07-23 | 13F | BankPlus Trust Department | 1,400 | 0.00 | 93 | -1.06 | ||||
| 2025-08-19 | 13F | State of Wyoming | 9,300 | 3.79 | 620 | 2.31 | ||||
| 2025-07-09 | 13F | Beacon Financial Group | 5,255 | 0.00 | 349 | -1.41 | ||||
| 2025-08-12 | 13F | BWM Planning, LLC | 21,552 | 0.00 | 1,437 | -1.44 | ||||
| 2025-07-25 | 13F | Atria Wealth Solutions, Inc. | 3,078 | 205 | ||||||
| 2025-07-29 | 13F | Private Trust Co Na | 6,800 | 0.00 | 453 | -1.52 | ||||
| 2025-07-31 | 13F | Cambridge Investment Research Advisors, Inc. | 3,929 | -5.94 | 0 | |||||
| 2025-08-13 | 13F | Cresset Asset Management, LLC | 13,005 | 867 | ||||||
| 2025-07-10 | 13F | Moody National Bank Trust Division | 35,185 | 2,346 | ||||||
| 2025-08-12 | 13F | Jpmorgan Chase & Co | 4,017 | -14.35 | 268 | -15.77 | ||||
| 2025-08-14 | 13F | Jane Street Group, Llc | 4,277 | -62.50 | 285 | -63.04 | ||||
| 2025-08-14 | 13F | Comerica Bank | 48 | 3 | ||||||
| 2025-04-08 | 13F | Lowe Wealth Advisors, LLC | 0 | -100.00 | 0 | |||||
| 2025-08-13 | 13F | SCS Capital Management LLC | 31,115 | 0.00 | 2,075 | -1.52 | ||||
| 2025-07-25 | 13F | Concurrent Investment Advisors, LLC | 25,355 | -10.80 | 1,686 | -12.15 | ||||
| 2025-08-11 | 13F | Citigroup Inc | 1,143 | -30.77 | 76 | -31.53 | ||||
| 2025-07-17 | 13F/A | Capital Investment Advisors, LLC | 12,653 | 1.55 | 841 | 0.12 | ||||
| 2025-08-15 | 13F | Kestra Advisory Services, LLC | 0 | -100.00 | 0 | |||||
| 2025-05-13 | 13F | FineMark National Bank & Trust | 0 | -100.00 | 0 | |||||
| 2025-08-08 | 13F | VeraBank, N.A. | 24,024 | 0.00 | 1,602 | -1.54 | ||||
| 2025-07-02 | 13F | Howard Financial Services, Ltd. | 67,814 | -12.42 | 4,506 | -13.73 | ||||
| 2025-08-14 | 13F | Bnp Paribas Arbitrage, Sa | 708 | 79.24 | 47 | 80.77 | ||||
| 2025-07-23 | 13F | Mraz, Amerine & Associates, Inc. | 24,525 | -1.01 | 1,630 | -1.09 | ||||
| 2025-04-22 | 13F | TrueMark Investments, LLC | 0 | -100.00 | 0 | |||||
| 2025-05-14 | 13F | Virtus ETF Advisers LLC | 0 | -100.00 | 0 | |||||
| 2025-08-14 | 13F | Ameriprise Financial Inc | 6,216 | -14.52 | 415 | -15.85 | ||||
| 2025-08-06 | 13F | Adviser Investments LLC | 9,197 | -1.76 | 613 | -3.16 | ||||
| 2025-08-14 | 13F | Kovitz Investment Group Partners, LLC | 7,032 | 0.00 | 467 | -1.48 | ||||
| 2025-08-28 | NP | SMLV - SPDR SSGA US Small Cap Low Volatility Index ETF This fund is a listed as child fund of State Street Corp and if that institution has disclosed ownership in this security, then these positions will not be double counted when calculating total shares and total value | 7,229 | -15.33 | 482 | -16.46 | ||||
| 2025-08-19 | 13F | Campbell Capital Management Inc | 0 | -100.00 | 0 | |||||
| 2025-08-12 | 13F | Steward Partners Investment Advisory, Llc | 200 | 0.00 | 13 | 0.00 | ||||
| 2025-08-14 | 13F | UBS Group AG | 14,037 | -22.20 | 936 | -23.42 | ||||
| 2025-07-16 | 13F | Essex Financial Services, Inc. | 9,186 | -2.43 | 613 | -3.92 | ||||
| 2025-08-14 | 13F | Raymond James Financial Inc | 16,032 | -1.20 | 1,069 | -2.64 | ||||
| 2025-07-23 | 13F | Tyche Wealth Partners LLC | 4,758 | 0.00 | 317 | -1.55 | ||||
| 2025-09-04 | 13F/A | Advisor Group Holdings, Inc. | 17,768 | 8.06 | 1,185 | 6.47 | ||||
| 2025-08-07 | 13F | Allworth Financial LP | 386 | -88.25 | 26 | -88.58 | ||||
| 2025-08-04 | 13F | Quaker Wealth Management, LLC | 1,000 | 66 | ||||||
| 2025-07-25 | 13F | M.e. Allison & Co., Inc. | 4,061 | 0.00 | 271 | -1.46 | ||||
| 2025-08-13 | 13F | Virtus Investment Advisers, Inc. | 2,593 | 7.24 | 173 | 5.52 | ||||
| 2025-08-11 | 13F | Rahlfs Capital, Llc | 11,985 | 1.48 | 798 | 0.00 | ||||
| 2025-08-07 | 13F | PFG Advisors | 14,846 | 0.34 | 987 | -1.20 | ||||
| 2025-07-31 | 13F | Buckingham Strategic Partners | 3,058 | 0.00 | 204 | -1.93 | ||||
| 2025-07-25 | 13F | Cwm, Llc | 237 | 1.28 | 0 | |||||
| 2025-08-04 | 13F | AMG National Trust Bank | 12,680 | 0.00 | 844 | -1.40 | ||||
| 2025-08-12 | 13F | Global Retirement Partners, LLC | 238 | 0.00 | 16 | 0.00 | ||||
| 2025-05-12 | 13F | Invesco Ltd. | 0 | -100.00 | 0 | -100.00 | ||||
| 2025-07-25 | 13F | Verdence Capital Advisors LLC | 10,500 | 0.00 | 700 | -1.41 | ||||
| 2025-08-14 | 13F | Bank Of America Corp /de/ | 28,496 | 11.88 | 1,900 | 10.21 | ||||
| 2025-05-15 | 13F | Mariner, LLC | 0 | -100.00 | 0 | |||||
| 2025-08-15 | 13F | Captrust Financial Advisors | 3,729 | 0.00 | 248 | -1.59 | ||||
| 2025-08-06 | 13F | Commonwealth Equity Services, Llc | 31,588 | 6.30 | 2 | 0.00 | ||||
| 2025-08-11 | 13F | Hexagon Capital Partners LLC | 0 | -100.00 | 0 | |||||
| 2025-08-12 | 13F | Pathstone Holdings, LLC | 3,617 | 0.00 | 241 | -1.23 | ||||
| 2025-08-12 | 13F | Manchester Capital Management LLC | 55 | 0.00 | 4 | 0.00 | ||||
| 2025-08-04 | 13F | Creekmur Asset Management LLC | 1 | 0.00 | 0 | |||||
| 2025-08-07 | 13F | King Luther Capital Management Corp | 143,555 | 0.00 | 9,572 | -1.49 | ||||
| 2025-07-15 | 13F | Significant Wealth Partners LLC | 4,739 | -9.02 | 315 | -10.54 | ||||
| 2025-08-14 | 13F | Two Sigma Investments, Lp | 56,130 | 31.67 | 3,743 | 29.71 | ||||
| 2025-08-12 | 13F | Holderness Investments Co | 6,000 | 0.00 | 399 | -1.49 | ||||
| 2025-08-13 | 13F | Marshall Wace, Llp | 23,172 | 1,545 | ||||||
| 2025-08-14 | 13F | Royal Bank Of Canada | 1,464 | 65.61 | 98 | 63.33 | ||||
| 2025-07-11 | 13F/A | Umb Bank N A/mo | 45 | 0.00 | 3 | 0.00 | ||||
| 2025-08-12 | 13F | Bokf, Na | 6,500 | 0.00 | 433 | -1.37 | ||||
| 2025-07-15 | 13F | Td Private Client Wealth Llc | 10 | 1 | ||||||
| 2025-07-24 | 13F | Robertson Stephens Wealth Management, LLC | 10,600 | 0.00 | 704 | -1.54 | ||||
| 2025-08-01 | 13F | Motco | 11,600 | 0.00 | 769 | -2.17 | ||||
| 2025-08-08 | 13F | Islay Capital Management, Llc | 3,000 | -25.00 | 199 | -26.02 | ||||
| 2025-08-12 | 13F | LPL Financial LLC | 22,923 | 4.03 | 1,528 | 2.48 | ||||
| 2025-07-14 | 13F | GAMMA Investing LLC | 0 | -100.00 | 0 | |||||
| 2025-08-11 | 13F | HighTower Advisors, LLC | 6,644 | -1.20 | 442 | -2.64 | ||||
| 2025-08-04 | 13F | Quaker Wealth Management, LLC | Put | 0 | -100.00 | 0 | -100.00 | |||
| 2025-08-11 | 13F | Principal Securities, Inc. | 17 | 1,600.00 | 1 | |||||
| 2025-08-28 | NP | RENN Fund, Inc. | 100 | 0.00 | 7 | 0.00 | ||||
| 2025-08-13 | 13F | Capital Analysts, Inc. | 27,425 | 16.23 | 2 | 0.00 | ||||
| 2025-08-14 | 13F | Hilltop Holdings Inc. | 6,176 | 1.25 | 412 | -0.24 | ||||
| 2025-08-06 | 13F | Decker Retirement Planning Inc. | 0 | 0 | ||||||
| 2025-08-14 | 13F | Susquehanna International Group, Llp | 24,164 | 48.08 | 1,611 | 45.92 | ||||
| 2025-08-14 | 13F | Wells Fargo & Company/mn | 16,710 | -19.71 | 1,114 | -20.88 | ||||
| 2025-07-24 | 13F | Ronald Blue Trust, Inc. | 17,009 | -41.03 | 1,134 | -41.91 | ||||
| 2025-07-28 | 13F | Harbour Investments, Inc. | 120 | 2.56 | 8 | 0.00 | ||||
| 2025-08-15 | 13F | Tower Research Capital LLC (TRC) | 37 | -94.37 | 2 | -95.45 | ||||
| 2025-04-28 | NP | BFOR - Barron's 400 ETF | 5,972 | 1.22 | 391 | 1.83 | ||||
| 2025-08-14 | 13F | State Street Corp | 7,229 | 4.18 | 482 | 2.77 | ||||
| 2025-07-23 | 13F | Prime Capital Investment Advisors, LLC | 3,000 | 0.00 | 200 | -1.48 | ||||
| 2025-08-07 | 13F | Americana Partners, LLC | 37,155 | 2,469 | ||||||
| 2025-06-25 | NP | VRAI - Virtus Real Asset Income ETF | 2,350 | -1.71 | 155 | -2.53 | ||||
| 2025-08-14 | 13F/A | Perritt Capital Management Inc | 2,579 | 0.00 | 171 | -1.16 | ||||
| 2025-07-15 | 13F | Fifth Third Bancorp | 355 | 24 | ||||||
| 2025-08-14 | 13F | Peapack Gladstone Financial Corp | 22,283 | 8.82 | 1 | 0.00 | ||||
| 2025-08-14 | 13F | GWM Advisors LLC | 540 | 0.00 | 36 | 0.00 | ||||
| 2025-08-05 | 13F | Huntington National Bank | 500 | -14.82 | 33 | -15.38 | ||||
| 2025-07-21 | 13F | Franklin Street Advisors Inc /nc | 10,081 | 0.00 | 1 | |||||
| 2025-08-14 | 13F | Qube Research & Technologies Ltd | 21,405 | -6.08 | 1,427 | -7.46 | ||||
| 2025-07-21 | 13F | Custos Family Office, LLC | 5,564 | 0.00 | 371 | -1.33 | ||||
| 2025-08-06 | 13F | Prospera Financial Services Inc | 31,059 | 4.94 | 2,071 | 3.39 | ||||
| 2025-07-31 | 13F | Fielder Capital Group LLC | 11,377 | 0.00 | 759 | -1.56 | ||||
| 2025-07-31 | 13F | Carnegie Capital Asset Management, LLC | 7,507 | 2.84 | 501 | 12.61 | ||||
| 2025-08-08 | 13F | Cetera Investment Advisers | 5,926 | 7.73 | 395 | 6.18 | ||||
| 2025-08-12 | 13F | Horizon Kinetics Asset Management Llc | 109,521 | -7.41 | 7,303 | -8.79 | ||||
| 2025-08-13 | 13F | Beacon Pointe Advisors, LLC | 195,894 | 1.26 | 13,017 | -0.25 | ||||
| 2025-08-13 | 13F | Brown Advisory Inc | 9,100 | -3.19 | 607 | -4.72 | ||||
| 2025-07-07 | 13F | Salem Investment Counselors Inc | 0 | -100.00 | 0 | |||||
| 2025-07-18 | 13F | PFG Investments, LLC | 3,898 | 260 | ||||||
| 2025-08-15 | 13F | Fairfield, Bush & Co. | 3,951 | -2.47 | 263 | -4.03 | ||||
| 2025-07-30 | 13F | Loring Wolcott & Coolidge Fiduciary Advisors Llp/ma | 1,437 | 0.00 | 96 | 0.00 | ||||
| 2025-04-01 | NP | PRFZ - Invesco FTSE RAFI US 1500 Small-Mid ETF This fund is a listed as child fund of Invesco Ltd. and if that institution has disclosed ownership in this security, then these positions will not be double counted when calculating total shares and total value | 8,283 | -0.10 | 548 | 8.51 | ||||
| 2025-07-17 | 13F | Sound Income Strategies, LLC | 50 | 0.00 | 3 | 0.00 | ||||
| 2025-07-11 | 13F | Farther Finance Advisors, LLC | 22 | 0.00 | 1 | 0.00 | ||||
| 2025-08-28 | NP | INFL - Horizon Kinetics Inflation Beneficiaries ETF | 85,201 | 0.00 | 5,681 | -1.49 | ||||
| 2025-04-30 | 13F | Alps Advisors Inc | 0 | -100.00 | 0 | |||||
| 2025-07-16 | 13F | American National Bank | 1,483 | 0.00 | 99 | -2.00 | ||||
| 2025-07-22 | 13F | Olistico Wealth, LLC | 427 | 0.00 | 28 | 0.00 | ||||
| 2025-07-10 | 13F | Wealth Enhancement Advisory Services, Llc | 3,570 | -9.98 | 237 | -11.24 | ||||
| 2025-08-14 | 13F | Mercer Global Advisors Inc /adv | 14,883 | 0.00 | 990 | -1.49 | ||||
| 2025-07-21 | 13F | Monticello Wealth Management, Llc | 5,908 | 0.00 | 393 | -1.50 | ||||
| 2025-08-14 | 13F | Two Sigma Advisers, Lp | 10,800 | 41.25 | 720 | 39.26 | ||||
| 2025-08-18 | 13F | Geneos Wealth Management Inc. | 5,257 | 11.21 | 351 | 10.06 | ||||
| 2025-08-14 | 13F | Summit Trail Advisors, Llc | 8,500 | 567 | ||||||
| 2025-08-04 | 13F | Assetmark, Inc | 13 | 1 | ||||||
| 2025-08-12 | 13F | Proequities, Inc. | 0 | 0 | ||||||
| 2025-08-14 | 13F | Stifel Financial Corp | 15,673 | 0.13 | 1,045 | -1.32 | ||||
| 2025-08-08 | 13F | Pnc Financial Services Group, Inc. | 3,324 | 0.00 | 222 | -1.78 | ||||
| 2025-08-14 | 13F | Lazard Asset Management Llc | 6,274 | 0.42 | 0 | |||||
| 2025-08-12 | 13F | Argent Trust Co | 4,977 | 0.00 | 332 | -1.49 | ||||
| 2025-08-06 | 13F | Moors & Cabot, Inc. | 18,542 | -1.59 | 1,236 | -3.06 | ||||
| 2025-07-16 | 13F | Signature Resources Capital Management, LLC | 600 | 0.00 | 40 | -2.50 | ||||
| 2025-08-14 | 13F | Sunbelt Securities, Inc. | 5,000 | 0.00 | 324 | -4.14 | ||||
| 2025-08-28 | NP | PVFIX - Pinnacle Value Fund | 5,441 | 817.54 | 363 | 805.00 | ||||
| 2025-08-14 | 13F | Uniplan Investment Counsel, Inc. | 12,859 | 857 | ||||||
| 2025-07-29 | 13F | Regions Financial Corp | 3,819 | 0.00 | 255 | -1.55 | ||||
| 2025-08-01 | 13F | Chilton Capital Management Llc | 35,523 | -13.42 | 2,361 | -14.71 | ||||
| 2025-08-18 | 13F/A | Westwood Holdings Group Inc | 5,325 | 0.41 | 355 | -0.84 | ||||
| 2025-08-14 | 13F | Federation des caisses Desjardins du Quebec | 150 | 0.00 | 10 | 0.00 | ||||
| 2025-08-15 | 13F | WealthCollab, LLC | 195 | 13 |