Mga Batayang Estadistika
| Pemilik Institusional | 109 total, 109 long only, 0 short only, 0 long/short - change of 21.11% MRQ |
| Alokasi Portofolio Rata-rata | 0.2889 % - change of -24.41% MRQ |
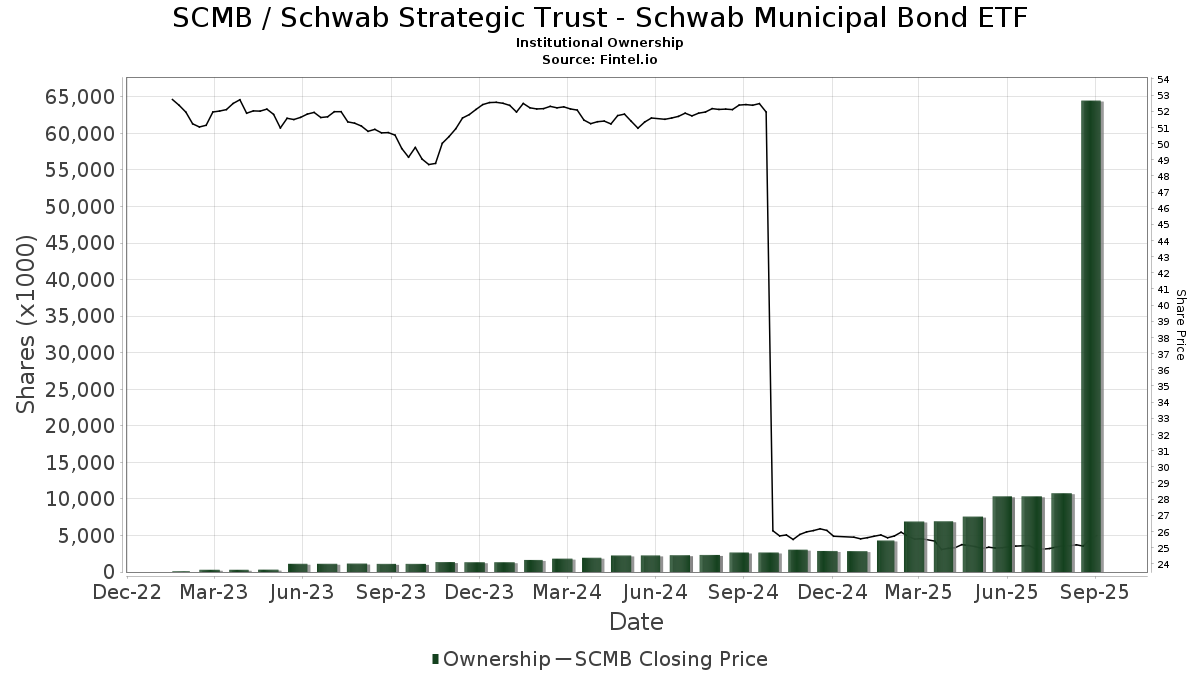
| Saham Institusional (Jangka Panjang) | 64,482,964 (ex 13D/G) - change of 54.13MM shares 522.99% MRQ |
| Nilai Institusional (Jangka Panjang) | $ 1,614,862 USD ($1000) |
Kepemilikan Institusional dan Pemegang Saham
Schwab Strategic Trust - Schwab Municipal Bond ETF (US:SCMB) memiliki 109 pemilik institusional dan pemegang saham yang telah mengajukan formulir 13D/G atau 13F kepada Komisi Bursa Efek (Securities Exchange Commission/SEC). Lembaga-lembaga ini memegang total 64,482,964 saham. Pemegang saham terbesar meliputi Charles Schwab Investment Management Inc, Jones Financial Companies Lllp, Fort Point Capital Partners LLC, Pallas Capital Advisors LLC, Charles Schwab Trust Co, Jane Street Group, Llc, Wedmont Private Capital, United Capital Financial Advisers, Llc, Bank Of America Corp /de/, and Envestnet Asset Management Inc .
Struktur kepemilikan institusional Schwab Strategic Trust - Schwab Municipal Bond ETF (ARCA:SCMB) menunjukkan posisi terkini di perusahaan oleh institusi dan dana, serta perubahan terbaru dalam ukuran posisi. Pemegang saham utama dapat mencakup investor individu, reksa dana, dana lindung nilai, atau institusi. Jadwal 13D menunjukkan bahwa investor memegang (atau pernah memegang) lebih dari 5% saham perusahaan dan bermaksud (atau pernah bermaksud) untuk secara aktif mengejar perubahan strategi bisnis. Jadwal 13G menunjukkan investasi pasif lebih dari 5%.
The share price as of September 5, 2025 is 25.31 / share. Previously, on September 6, 2024, the share price was 26.12 / share. This represents a decline of 3.12% over that period.
Skor Sentimen Dana
Skor Sentimen Dana (sebelumnya dikenal sebagai Skor Akumulasi Kepemilikan) menemukan saham-saham yang paling banyak dibeli oleh dana. Ini adalah hasil dari model kuantitatif multi-faktor yang canggih yang mengidentifikasi perusahaan dengan tingkat akumulasi institusional tertinggi. Model penilaian menggunakan kombinasi dari total peningkatan pemilik yang diungkapkan, perubahan dalam alokasi portofolio pada pemilik tersebut, dan metrik lainnya. Angka berkisar dari 0 hingga 100, dengan angka yang lebih tinggi menunjukkan tingkat akumulasi yang lebih tinggi dibandingkan dengan perusahaan sejenisnya, dan 50 adalah rata-ratanya.
Frekuensi Pembaruan: Setiap Hari
Lihat Ownership Explorer, yang menyediakan daftar perusahaan dengan peringkat tertinggi.
Rasio Put/Call Institusional
Selain melaporkan isu ekuitas dan utang standar, institusi dengan aset di bawah manajemen lebih dari 100 juta dolar AS juga harus mengungkapkan kepemilikan opsi put dan call mereka. Karena opsi put umumnya menunjukkan sentimen negatif, dan opsi call menunjukkan sentimen positif, kita dapat mengetahui sentimen institusional secara keseluruhan dengan memplot rasio put terhadap call. Grafik di sebelah kanan memplot rasio put/call historis untuk instrumen ini.
Menggunakan Rasio Put/Call sebagai indikator sentimen investor mengatasi salah satu kekurangan utama dari penggunaan total kepemilikan institusional, yaitu sejumlah besar aset yang dikelola diinvestasikan secara pasif untuk melacak indeks. Dana yang dikelola secara pasif biasanya tidak membeli opsi, sehingga indikator rasio put/call lebih akurat dalam melacak sentimen dana yang dikelola secara aktif.
Pengajuan 13F dan NPORT
Detail pada pengajuan 13F tersedia gratis. Detail pada pengajuan NP memerlukan keanggotaan premium. Baris berwarna hijau menunjukkan posisi baru. Baris berwarna merah menunjukkan posisi yang sudah ditutup. Klik tautan ini ikon untuk melihat riwayat transaksi selengkapnya.
Tingkatkan
untuk membuka data premium dan mengekspor ke Excel ![]() .
.
| Tanggal File | Sumber | Investor | Ketik | Presyo ng Avg (Silangan) |
Saham | Δ Saham (%) |
Dilaporkan Nilai ($1000) |
Nilai Δ (%) |
Alokasi Port (%) |
|
|---|---|---|---|---|---|---|---|---|---|---|
| 2025-08-11 | 13F | United Capital Financial Advisers, Llc | 462,276 | 164.93 | 11,640 | 162.99 | ||||
| 2025-08-14 | 13F | Goldman Sachs Group Inc | 0 | -100.00 | 0 | |||||
| 2025-08-14 | 13F | Mariner, LLC | 8,200 | 0.00 | 206 | -0.96 | ||||
| 2025-07-30 | 13F | VCI Wealth Management LLC | 15,982 | 3.26 | 402 | 2.55 | ||||
| 2025-07-23 | 13F | West Paces Advisors Inc. | 6,615 | -37.39 | 167 | -38.06 | ||||
| 2025-07-25 | 13F | Ackerman Capital Advisors, LLC | 69,482 | 1,750 | ||||||
| 2025-08-08 | 13F | Larson Financial Group LLC | 3,809 | 277.88 | 96 | 280.00 | ||||
| 2025-08-15 | 13F | Kestra Advisory Services, LLC | 31,904 | 7.41 | 803 | 6.64 | ||||
| 2025-08-19 | 13F | Anchor Investment Management, LLC | 0 | -100.00 | 0 | |||||
| 2025-07-17 | 13F | Halbert Hargrove Global Advisors, Llc | 700 | 18 | ||||||
| 2025-07-22 | 13F | Compass Financial Group, INC/SD | 23,036 | 2.40 | 580 | 1.75 | ||||
| 2025-08-14 | 13F | Quantinno Capital Management LP | 91,765 | 2,311 | ||||||
| 2025-08-12 | 13F | Charles Schwab Investment Management Inc | 52,643,707 | 4,409.67 | 1,325,569 | 4,376.00 | ||||
| 2025-07-24 | 13F | VanderPol Investments L.L.C. | 83,785 | -3.03 | 2,110 | -3.74 | ||||
| 2025-08-14 | 13F | Warren Averett Asset Management, LLC | 18,202 | 458 | ||||||
| 2025-08-15 | 13F | Captrust Financial Advisors | 55,477 | 43.36 | 1,397 | 42.30 | ||||
| 2025-07-18 | 13F | Northeast Financial Group, Inc. | 51,676 | 34.08 | 1,301 | 33.16 | ||||
| 2025-07-30 | 13F | Paul Damon & Associates, Inc. | 24,527 | 5.50 | 618 | 4.75 | ||||
| 2025-08-13 | 13F | Natixis Advisors, L.p. | 119,749 | 333.53 | 3 | |||||
| 2025-07-31 | 13F | Cambridge Investment Research Advisors, Inc. | 33,205 | 1 | ||||||
| 2025-04-23 | 13F | Carl Stuart Investment Advisor, Inc | 0 | -100.00 | 0 | |||||
| 2025-08-14 | 13F | Raymond James Financial Inc | 4,368 | 110 | ||||||
| 2025-07-09 | 13F | Breakwater Investment Management | 9,740 | 245 | ||||||
| 2025-07-31 | 13F | TSA Wealth Managment LLC | 52,747 | 85.70 | 1,328 | 84.44 | ||||
| 2025-08-08 | 13F | Cetera Investment Advisers | 44,660 | -24.20 | 1,125 | -24.77 | ||||
| 2025-08-12 | 13F | Putnam Fl Investment Management Co | 8,329 | -68.68 | 210 | -68.99 | ||||
| 2025-07-16 | 13F | Perigon Wealth Management, LLC | 179,898 | 8.92 | 4,530 | 8.09 | ||||
| 2025-08-14 | 13F | Bank Of America Corp /de/ | 453,989 | -1.14 | 11,431 | -1.88 | ||||
| 2025-08-14 | 13F | Coastal Bridge Advisors, LLC | 47,202 | -2.73 | 1,189 | -3.49 | ||||
| 2025-08-12 | 13F | Bedel Financial Consulting, Inc. | 10,513 | 5.64 | 265 | 6.02 | ||||
| 2025-08-15 | 13F | Morgan Stanley | 1 | 0 | ||||||
| 2025-07-08 | 13F | FF Advisors,LLC | 17,981 | 0.00 | 453 | 0.22 | ||||
| 2025-07-31 | 13F | CVA Family Office, LLC | 700 | -71.83 | 18 | -73.02 | ||||
| 2025-08-19 | 13F | National Asset Management, Inc. | 0 | -100.00 | 0 | |||||
| 2025-07-30 | 13F | Avidian Wealth Solutions, LLC | 77,355 | 1,948 | ||||||
| 2025-08-14 | 13F | Citadel Advisors Llc | 0 | -100.00 | 0 | |||||
| 2025-07-09 | 13F | Pallas Capital Advisors LLC | 755,515 | 12.89 | 19,024 | 12.04 | ||||
| 2025-09-04 | 13F/A | Advisor Group Holdings, Inc. | 34,249 | -11.94 | 862 | -12.58 | ||||
| 2025-07-22 | 13F | Rochester Wealth Strategies, LLC | 0 | -100.00 | 0 | |||||
| 2025-04-29 | 13F | Truist Financial Corp | 0 | -100.00 | 0 | |||||
| 2025-07-08 | 13F | Heartwood Wealth Advisors LLC | 9,243 | 233 | ||||||
| 2025-08-11 | 13F | Elequin Capital Lp | 100,000 | 2,518 | ||||||
| 2025-07-28 | NP | SPMFX - Symmetry Panoramic Municipal Fixed Income Fund Class I Shares | 154,000 | 0.00 | 3,856 | -3.53 | ||||
| 2025-08-14 | 13F | Mml Investors Services, Llc | 78,195 | 97.72 | 2 | 0.00 | ||||
| 2025-08-06 | 13F | Commonwealth Equity Services, Llc | 12,108 | 0 | ||||||
| 2025-08-26 | 13F/A | Thrivent Financial For Lutherans | 0 | -100.00 | 0 | |||||
| 2025-07-09 | 13F | Breakwater Capital Group | 8,194 | 206 | ||||||
| 2025-08-15 | 13F | Asset Allocation Strategies LLC | 10,609 | -4.65 | 267 | -5.32 | ||||
| 2025-08-04 | 13F | Grant Street Asset Management, Inc. | 15,776 | 0.71 | 397 | 0.00 | ||||
| 2025-08-14 | 13F | Jane Street Group, Llc | 522,022 | 143.51 | 13,145 | 141.71 | ||||
| 2025-08-11 | 13F | Aptus Capital Advisors, LLC | 205 | 0.00 | 5 | 0.00 | ||||
| 2025-07-15 | 13F | Garrett Investment Advisors LLC | 207,164 | -11.49 | 5,216 | -12.14 | ||||
| 2025-08-01 | 13F | Envestnet Asset Management Inc | 320,242 | 44.83 | 8,064 | 43.75 | ||||
| 2025-08-14 | 13F | Wells Fargo & Company/mn | 1 | 0 | ||||||
| 2025-08-12 | 13F | Howe & Rusling Inc | 8,174 | 206 | ||||||
| 2025-08-14 | 13F | Mercer Global Advisors Inc /adv | 25,812 | 0.19 | 650 | -0.61 | ||||
| 2025-07-16 | 13F | Vestia Personal Wealth Advisors | 18,728 | 472 | ||||||
| 2025-08-12 | 13F | Jpmorgan Chase & Co | 128,813 | 165.54 | 3,244 | 163.66 | ||||
| 2025-08-14 | 13F | Aqr Capital Management Llc | 58,755 | 1,479 | ||||||
| 2025-07-28 | 13F | Harbour Investments, Inc. | 9,252 | 101.48 | 233 | 100.00 | ||||
| 2025-07-24 | 13F | Galvin, Gaustad & Stein, LLC | 17,628 | 3.76 | 444 | 2.78 | ||||
| 2025-07-03 | 13F | Trinity Financial Advisors LLC | 0 | -100.00 | 0 | |||||
| 2025-08-11 | 13F | Root Financial Partners, LLC | 22,672 | 0.00 | 571 | -0.87 | ||||
| 2025-07-24 | 13F | IFP Advisors, Inc | 3,290 | 0.00 | 83 | -1.20 | ||||
| 2025-07-22 | 13F | Gemmer Asset Management LLC | 13,831 | 33.76 | 348 | 32.82 | ||||
| 2025-08-07 | 13F | Donaldson Capital Management, Llc | 41,887 | 0.00 | 1,055 | -0.75 | ||||
| 2025-07-11 | 13F | Myecfo, Llc | 145,160 | 9.34 | 3,659 | 9.03 | ||||
| 2025-07-17 | 13F | Charles Schwab Trust Co | 733,104 | 38.73 | 18,460 | 37.69 | ||||
| 2025-07-23 | 13F | Columbus Macro, LLC | 43,946 | -26.79 | 1,107 | -27.33 | ||||
| 2025-08-13 | 13F | Northwestern Mutual Wealth Management Co | 1,258 | 0.00 | 32 | 0.00 | ||||
| 2025-08-12 | 13F | Proequities, Inc. | 0 | 0 | ||||||
| 2025-07-21 | 13F | Pflug Koory, LLC | 12 | 0.00 | 0 | |||||
| 2025-07-22 | 13F | Red Tortoise LLC | 377 | -8.50 | 9 | -10.00 | ||||
| 2025-08-19 | 13F | Cape Investment Advisory, Inc. | 510 | 0.59 | 13 | 0.00 | ||||
| 2025-07-17 | 13F | Janney Montgomery Scott LLC | 75,000 | 15.38 | 2 | 0.00 | ||||
| 2025-04-29 | 13F | Element Wealth, LLC | 0 | -100.00 | 0 | |||||
| 2025-05-13 | 13F | EPG Wealth Management LLC | 0 | -100.00 | 0 | -100.00 | ||||
| 2025-08-13 | 13F | Continuum Advisory, LLC | 14,631 | 1,728.88 | 368 | 1,740.00 | ||||
| 2025-08-07 | 13F | Allworth Financial LP | 0 | -100.00 | 0 | |||||
| 2025-05-13 | 13F | UBS Group AG | 0 | -100.00 | 0 | |||||
| 2025-07-18 | 13F | O'ROURKE & COMPANY, Inc | 76,021 | -14.09 | 1,914 | -14.74 | ||||
| 2025-08-12 | 13F | CIBC Private Wealth Group, LLC | 6,000 | 0.00 | 151 | 2.03 | ||||
| 2025-07-17 | 13F | Legacy Wealth Management, Inc | 34,193 | 182.35 | 861 | 180.13 | ||||
| 2025-07-22 | 13F | Berger Financial Group, Inc | 20,644 | -15.94 | 520 | -16.69 | ||||
| 2025-08-08 | 13F | Capital Investment Advisory Services, LLC | 0 | -100.00 | 0 | |||||
| 2025-04-21 | 13F | Nelson, Van Denburg & Campbell Wealth Management Group, LLC | 0 | -100.00 | 0 | |||||
| 2025-08-13 | 13F | Smith, Moore & Co. | 44,860 | 1,130 | ||||||
| 2025-08-13 | 13F | Capital Analysts, Inc. | 3,874 | 38.80 | 0 | |||||
| 2025-08-08 | 13F | Francis Financial, Inc. | 42,671 | 1,074 | ||||||
| 2025-08-12 | 13F | Change Path, LLC | 16,337 | 33.35 | 411 | 32.58 | ||||
| 2025-08-14 | 13F | Susquehanna International Group, Llp | 0 | -100.00 | 0 | |||||
| 2025-08-06 | 13F | Adviser Investments LLC | 98,812 | -27.98 | 2,488 | -28.51 | ||||
| 2025-08-14 | 13F | Peapack Gladstone Financial Corp | 22,598 | 1 | ||||||
| 2025-07-21 | 13F | Investment Planning Advisors, Inc. | 62,039 | 11.85 | 1,562 | 11.02 | ||||
| 2025-08-13 | 13F | Jones Financial Companies Lllp | 2,950,244 | 14.40 | 74,258 | 13.61 | ||||
| 2025-07-23 | 13F | Pure Portfolios Holdings Llc | 87,748 | 481.69 | 2,209 | 478.27 | ||||
| 2025-08-14 | 13F | Fort Point Capital Partners LLC | 1,241,508 | 90.21 | 31,261 | 88.80 | ||||
| 2025-07-31 | 13F | CAP Partners, LLC | 14,554 | 8.18 | 366 | 7.33 | ||||
| 2025-07-14 | 13F | AdvisorNet Financial, Inc | 32,128 | 0.00 | 809 | -0.86 | ||||
| 2025-08-12 | 13F | Blueprint Financial Advisors LLC | 24,245 | 610 | ||||||
| 2025-08-08 | 13F | Emerald Investment Partners, Llc | 5,724 | 0.00 | 144 | -0.69 | ||||
| 2025-08-04 | 13F | Assetmark, Inc | 738 | 19 | ||||||
| 2025-08-12 | 13F | MAI Capital Management | 24,802 | 1.69 | 625 | 0.97 | ||||
| 2025-07-10 | 13F | Wealth Enhancement Advisory Services, Llc | 134,584 | 136.07 | 3,377 | 133.47 | ||||
| 2025-08-15 | 13F | Chapman Financial Group, Llc | 5,800 | 0.00 | 146 | -1.35 | ||||
| 2025-04-18 | 13F | Bell Bank | 0 | -100.00 | 0 | |||||
| 2025-07-21 | 13F | Ameritas Advisory Services, LLC | 5,530 | 139 | ||||||
| 2025-08-08 | 13F | Burling Wealth Partners, Llc | 8,625 | 217 | ||||||
| 2025-08-05 | 13F | Golden Bell Financial Planning LLC | 15,455 | 12.31 | 389 | 11.46 | ||||
| 2025-08-14 | 13F | Beaird Harris Wealth Management, LLC | 209,152 | -1.25 | 5,266 | -1.99 | ||||
| 2025-08-08 | 13F | Meridian Wealth Management, LLC | 57,392 | 0.10 | 1,445 | -0.62 | ||||
| 2025-08-08 | 13F | Altiora Financial Group, LLC | 20,000 | 0.00 | 504 | -0.79 | ||||
| 2025-08-14 | 13F | Royal Bank Of Canada | 130,722 | 3,292 | ||||||
| 2025-08-08 | 13F | Cornerstone Advisors Asset Management, Inc | 85,203 | 5.03 | 2,145 | 4.28 | ||||
| 2025-08-04 | 13F | Creative Financial Designs Inc /adv | 53,969 | -6.13 | 1,359 | -6.86 | ||||
| 2025-08-08 | 13F | Creative Planning | 34,647 | -2.54 | 872 | -3.22 | ||||
| 2025-08-06 | 13F | AE Wealth Management LLC | 672 | -30.72 | 17 | -33.33 | ||||
| 2025-07-10 | 13F | Wedmont Private Capital | 489,484 | -14.78 | 12,296 | -13.15 | ||||
| 2025-07-03 | 13F | Fiduciary Financial Group, Llc | 12,844 | -37.58 | 323 | -36.74 | ||||
| 2025-08-27 | 13F/A | Brinker Capital Investments, LLC | 10,689 | 269 | ||||||
| 2025-08-04 | 13F | Savvy Advisors, Inc. | 0 | -100.00 | 0 | |||||
| 2025-07-25 | 13F | Sequoia Financial Advisors, LLC | 14,791 | -19.88 | 372 | -20.51 | ||||
| 2025-08-14 | 13F | Great Valley Advisor Group, Inc. | 15,285 | 385 | ||||||
| 2025-08-15 | 13F | CI Private Wealth, LLC | 52,852 | 1,331 | ||||||
| 2025-04-28 | 13F | BCO Wealth Management LLC | 0 | -100.00 | 0 | |||||
| 2025-08-12 | 13F | LPL Financial LLC | 12,516 | 315 | ||||||
| 2025-07-31 | 13F | Resonant Capital Advisors, LLC | 41,046 | 13.36 | 1,034 | 12.53 | ||||
| 2025-08-13 | 13F | SageView Advisory Group, LLC | 9,940 | 248 | ||||||
| 2025-08-11 | 13F | HighTower Advisors, LLC | 10,083 | 254 | ||||||
| 2025-04-21 | 13F | LifeGoal Wealth Advisors | 0 | -100.00 | 0 |