Mga Batayang Estadistika
| Pemilik Institusional | 148 total, 148 long only, 0 short only, 0 long/short - change of 12.88% MRQ |
| Alokasi Portofolio Rata-rata | 0.1798 % - change of -5.11% MRQ |
| Saham Institusional (Jangka Panjang) | 6,065,021 (ex 13D/G) - change of 1.45MM shares 31.54% MRQ |
| Nilai Institusional (Jangka Panjang) | $ 364,095 USD ($1000) |
Kepemilikan Institusional dan Pemegang Saham
The RBB Fund, Inc. - Motley Fool 100 Index ETF (US:TMFC) memiliki 148 pemilik institusional dan pemegang saham yang telah mengajukan formulir 13D/G atau 13F kepada Komisi Bursa Efek (Securities Exchange Commission/SEC). Lembaga-lembaga ini memegang total 6,065,021 saham. Pemegang saham terbesar meliputi Amplius Wealth Advisors, LLC, LPL Financial LLC, Raymond James Financial Inc, Portfolio Strategies, Inc., Private Advisor Group, LLC, Royal Bank Of Canada, Cambridge Investment Research Advisors, Inc., Wells Fargo & Company/mn, Advisor Group Holdings, Inc., and Two Sigma Investments, Lp .
Struktur kepemilikan institusional The RBB Fund, Inc. - Motley Fool 100 Index ETF (BATS:TMFC) menunjukkan posisi terkini di perusahaan oleh institusi dan dana, serta perubahan terbaru dalam ukuran posisi. Pemegang saham utama dapat mencakup investor individu, reksa dana, dana lindung nilai, atau institusi. Jadwal 13D menunjukkan bahwa investor memegang (atau pernah memegang) lebih dari 5% saham perusahaan dan bermaksud (atau pernah bermaksud) untuk secara aktif mengejar perubahan strategi bisnis. Jadwal 13G menunjukkan investasi pasif lebih dari 5%.
The share price as of September 5, 2025 is 67.96 / share. Previously, on September 6, 2024, the share price was 52.42 / share. This represents an increase of 29.65% over that period.

Skor Sentimen Dana
Skor Sentimen Dana (sebelumnya dikenal sebagai Skor Akumulasi Kepemilikan) menemukan saham-saham yang paling banyak dibeli oleh dana. Ini adalah hasil dari model kuantitatif multi-faktor yang canggih yang mengidentifikasi perusahaan dengan tingkat akumulasi institusional tertinggi. Model penilaian menggunakan kombinasi dari total peningkatan pemilik yang diungkapkan, perubahan dalam alokasi portofolio pada pemilik tersebut, dan metrik lainnya. Angka berkisar dari 0 hingga 100, dengan angka yang lebih tinggi menunjukkan tingkat akumulasi yang lebih tinggi dibandingkan dengan perusahaan sejenisnya, dan 50 adalah rata-ratanya.
Frekuensi Pembaruan: Setiap Hari
Lihat Ownership Explorer, yang menyediakan daftar perusahaan dengan peringkat tertinggi.
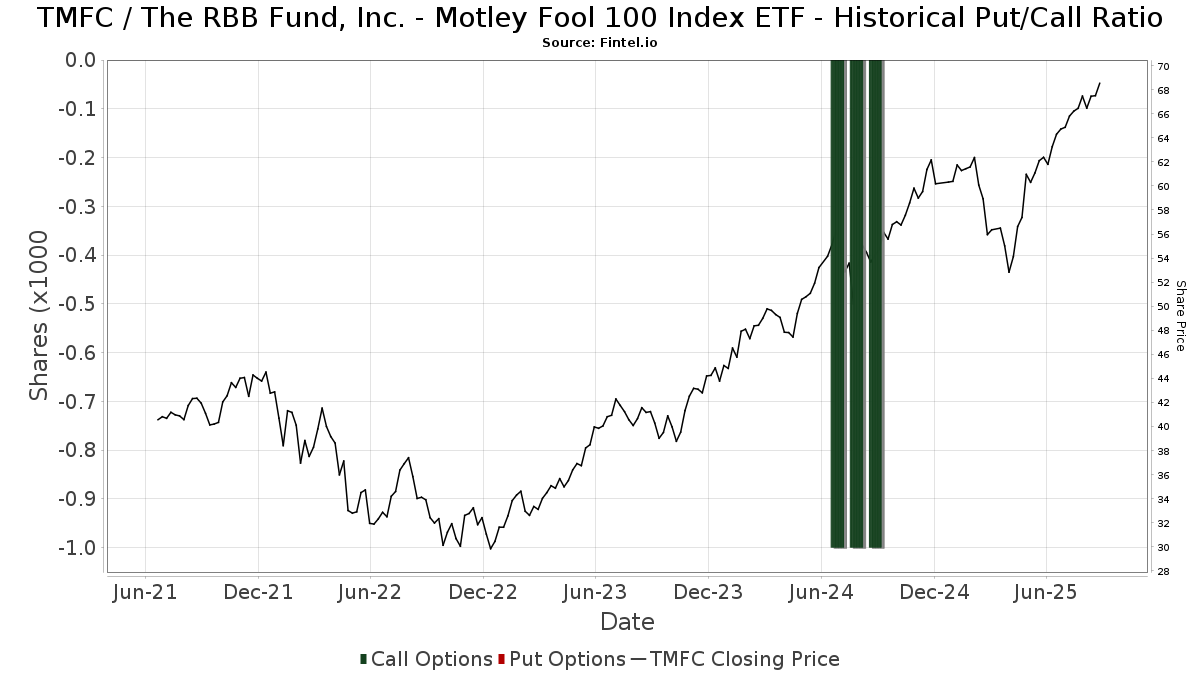
Rasio Put/Call Institusional
Selain melaporkan isu ekuitas dan utang standar, institusi dengan aset di bawah manajemen lebih dari 100 juta dolar AS juga harus mengungkapkan kepemilikan opsi put dan call mereka. Karena opsi put umumnya menunjukkan sentimen negatif, dan opsi call menunjukkan sentimen positif, kita dapat mengetahui sentimen institusional secara keseluruhan dengan memplot rasio put terhadap call. Grafik di sebelah kanan memplot rasio put/call historis untuk instrumen ini.
Menggunakan Rasio Put/Call sebagai indikator sentimen investor mengatasi salah satu kekurangan utama dari penggunaan total kepemilikan institusional, yaitu sejumlah besar aset yang dikelola diinvestasikan secara pasif untuk melacak indeks. Dana yang dikelola secara pasif biasanya tidak membeli opsi, sehingga indikator rasio put/call lebih akurat dalam melacak sentimen dana yang dikelola secara aktif.
Pengajuan 13F dan NPORT
Detail pada pengajuan 13F tersedia gratis. Detail pada pengajuan NP memerlukan keanggotaan premium. Baris berwarna hijau menunjukkan posisi baru. Baris berwarna merah menunjukkan posisi yang sudah ditutup. Klik tautan ini ikon untuk melihat riwayat transaksi selengkapnya.
Tingkatkan
untuk membuka data premium dan mengekspor ke Excel ![]() .
.
| Tanggal File | Sumber | Investor | Ketik | Presyo ng Avg (Silangan) |
Saham | Δ Saham (%) |
Dilaporkan Nilai ($1000) |
Nilai Δ (%) |
Alokasi Port (%) |
|
|---|---|---|---|---|---|---|---|---|---|---|
| 2025-08-14 | 13F | Atomi Financial Group, Inc. | 14,461 | 12.21 | 933 | 30.17 | ||||
| 2025-08-14 | 13F | Wells Fargo & Company/mn | 286,630 | 1.42 | 18,491 | 17.63 | ||||
| 2025-07-18 | 13F | Bartlett & Co. Wealth Management Llc | 400 | 0.00 | 26 | 13.64 | ||||
| 2025-08-05 | 13F | Corps Capital Advisors, LLC | 6,698 | 6.61 | 432 | 23.78 | ||||
| 2025-08-12 | 13F | J.w. Cole Advisors, Inc. | 5,041 | 9.90 | 325 | 27.45 | ||||
| 2025-08-11 | 13F | Advisor Resource Council | 0 | -100.00 | 0 | |||||
| 2025-07-30 | 13F | Whittier Trust Co | 15 | 0.00 | 1 | |||||
| 2025-08-12 | 13F | CIBC Private Wealth Group, LLC | 1,000 | 0.00 | 65 | 30.61 | ||||
| 2025-08-14 | 13F | Federation des caisses Desjardins du Quebec | 1,390 | 0.00 | 90 | 15.58 | ||||
| 2025-08-18 | 13F | Tyler-Stone Wealth Management | 3,176 | 205 | ||||||
| 2025-07-23 | 13F | Nbt Bank N A /ny | 500 | 0.00 | 32 | 18.52 | ||||
| 2025-07-16 | 13F | Perigon Wealth Management, LLC | 12,663 | 2.01 | 817 | 18.26 | ||||
| 2025-08-12 | 13F | LPL Financial LLC | 790,191 | 18.88 | 50,975 | 37.89 | ||||
| 2025-08-14 | 13F | Bank Of America Corp /de/ | 50 | 0.00 | 3 | 50.00 | ||||
| 2025-08-13 | 13F | Northwestern Mutual Wealth Management Co | 27,670 | 278.52 | 1,785 | 339.41 | ||||
| 2025-08-18 | 13F | Geneos Wealth Management Inc. | 100 | 0.00 | 6 | 20.00 | ||||
| 2025-08-11 | 13F | Aptus Capital Advisors, LLC | 297 | 0.00 | 19 | 18.75 | ||||
| 2025-08-11 | 13F | Mill Creek Capital Advisors, LLC | 3,653 | 0.00 | 236 | 15.76 | ||||
| 2025-07-29 | 13F | Elevation Capital Advisory, LLC | 47,765 | 9.83 | 3,081 | 27.42 | ||||
| 2025-04-23 | 13F | B.O.S.S. Retirement Advisors, LLC | 0 | -100.00 | 0 | |||||
| 2025-07-30 | 13F | Bogart Wealth, LLC | 8 | 0.00 | 1 | |||||
| 2025-07-30 | 13F | Pittenger & Anderson Inc | 150 | 0.00 | 10 | 12.50 | ||||
| 2025-08-27 | 13F/A | Brinker Capital Investments, LLC | 4,035 | -19.41 | 260 | -6.47 | ||||
| 2025-08-14 | 13F | Two Sigma Investments, Lp | 108,400 | 6,993 | ||||||
| 2025-07-11 | 13F | Farther Finance Advisors, LLC | 403 | 71.49 | 26 | 100.00 | ||||
| 2025-07-25 | 13F | Concurrent Investment Advisors, LLC | 7,700 | 5.18 | 497 | 21.87 | ||||
| 2025-07-16 | 13F | Signaturefd, Llc | 17 | 1 | ||||||
| 2025-08-13 | 13F | RIA Advisory Group LLC | 12,756 | 823 | ||||||
| 2025-08-14 | 13F | Old Mission Capital Llc | 0 | -100.00 | 0 | |||||
| 2025-05-09 | 13F | GeoWealth Management, LLC | 0 | -100.00 | 0 | -100.00 | ||||
| 2025-05-15 | 13F/A | Orion Portfolio Solutions, LLC | 5,007 | 278 | ||||||
| 2025-08-11 | 13F | Private Advisor Group, LLC | 381,122 | 1,219.49 | 24,586 | 1,430.88 | ||||
| 2025-07-22 | 13F | DAVENPORT & Co LLC | 15,875 | 1.28 | 1,024 | 17.57 | ||||
| 2025-08-12 | 13F | Proequities, Inc. | 0 | 0 | ||||||
| 2025-08-12 | 13F | Global Retirement Partners, LLC | 1,350 | 0.00 | 87 | 7.41 | ||||
| 2025-07-10 | 13F | Wealth Enhancement Advisory Services, Llc | 8,641 | 26.18 | 561 | 47.37 | ||||
| 2025-07-31 | 13F | Cambridge Investment Research Advisors, Inc. | 299,710 | 7.70 | 19 | 26.67 | ||||
| 2025-08-13 | 13F | Keystone Financial Group | 10,713 | -2.43 | 691 | 13.28 | ||||
| 2025-08-14 | 13F | Royal Bank Of Canada | 316,323 | 98.69 | 20,406 | 130.42 | ||||
| 2025-07-09 | 13F | Lbmc Investment Advisors, Llc | 3,364 | 217 | ||||||
| 2025-08-12 | 13F | Integrated Advisors Network LLC | 3,842 | 248 | ||||||
| 2025-07-31 | 13F | Wealthfront Advisers Llc | 60,436 | 2.10 | 3,899 | 18.41 | ||||
| 2025-04-21 | 13F | Nelson, Van Denburg & Campbell Wealth Management Group, LLC | 0 | -100.00 | 0 | |||||
| 2025-08-08 | 13F | Gts Securities Llc | 38,952 | 2,513 | ||||||
| 2025-05-28 | NP | TFAFX - Tactical Growth Allocation Fund Class I | 0 | -100.00 | 0 | -100.00 | ||||
| 2025-07-30 | 13F | Cullen/frost Bankers, Inc. | 181 | 0.00 | 12 | 10.00 | ||||
| 2025-07-30 | 13F | D.a. Davidson & Co. | 3,550 | 229 | ||||||
| 2025-08-14 | 13F | IHT Wealth Management, LLC | 86,500 | 1.23 | 5,580 | 17.42 | ||||
| 2025-07-02 | 13F | Howard Financial Services, Ltd. | 4,969 | 0.00 | 321 | 15.94 | ||||
| 2025-08-19 | 13F | Newbridge Financial Services Group, Inc. | 14,633 | 2,826.60 | 944 | 3,392.59 | ||||
| 2025-04-14 | 13F | Lloyd Advisory Services, LLC. | 0 | -100.00 | 0 | |||||
| 2025-07-07 | 13F | Bangor Savings Bank | 127 | 8 | ||||||
| 2025-08-12 | 13F | Archer Investment Corp | 100 | 6 | ||||||
| 2025-08-18 | 13F | N.E.W. Advisory Services LLC | 26 | 0.00 | 2 | 0.00 | ||||
| 2025-08-12 | 13F | Calton & Associates, Inc. | 24,818 | -3.48 | 1,601 | 11.96 | ||||
| 2025-07-07 | 13F | TruWealth Advisors, LLC | 3,302 | 213 | ||||||
| 2025-08-12 | 13F | MAI Capital Management | 265 | 32.50 | 17 | 54.55 | ||||
| 2025-05-01 | 13F | Quest 10 Wealth Builders, Inc. | 0 | -100.00 | 0 | |||||
| 2025-08-13 | 13F | Marshall Wace, Llp | 8,664 | 559 | ||||||
| 2025-08-14 | 13F | Jane Street Group, Llc | 0 | -100.00 | 0 | |||||
| 2025-07-30 | 13F | Avidian Wealth Solutions, LLC | 28,349 | 0.60 | 1,829 | 16.66 | ||||
| 2025-08-05 | 13F | Key FInancial Inc | 15 | 0.00 | 1 | |||||
| 2025-05-05 | 13F | Transce3nd, LLC | 0 | -100.00 | 0 | |||||
| 2025-07-21 | 13F | Ameritas Advisory Services, LLC | 424 | 27 | ||||||
| 2025-08-12 | 13F | Jpmorgan Chase & Co | 250 | 150.00 | 16 | 220.00 | ||||
| 2025-08-07 | 13F | Sound View Wealth Advisors Group, LLC | 17,388 | 8.44 | 1,122 | 25.81 | ||||
| 2025-08-11 | 13F | Pineridge Advisors LLC | 0 | -100.00 | 0 | |||||
| 2025-08-11 | 13F | HighTower Advisors, LLC | 14,021 | 0.16 | 905 | 16.20 | ||||
| 2025-08-08 | 13F | Creative Planning | 20,785 | -0.65 | 1,341 | 15.22 | ||||
| 2025-08-14 | 13F | Planwiser Financial, Llc | 21,918 | -1.92 | 1,457 | 13.57 | ||||
| 2025-07-24 | 13F | Us Bancorp \de\ | 738 | 0.00 | 48 | 14.63 | ||||
| 2025-05-05 | 13F | Lindbrook Capital, Llc | 1,389 | 55.54 | 77 | 45.28 | ||||
| 2025-07-25 | 13F | Almanack Investment Partners, LLC. | 5,665 | 33.20 | 365 | 54.66 | ||||
| 2025-07-11 | 13F | SILVER OAK SECURITIES, Inc | 0 | -100.00 | 0 | |||||
| 2025-08-08 | 13F | Glassman Wealth Services | 5,990 | 0.00 | 386 | 15.92 | ||||
| 2025-06-10 | 13F | Birchbrook, Inc. | 0 | -100.00 | 0 | -100.00 | ||||
| 2025-07-29 | 13F | Koshinski Asset Management, Inc. | 2,366 | 4.28 | 1,365 | 6.31 | ||||
| 2025-08-11 | 13F | TRUE Private Wealth Advisors | 6,561 | 423 | ||||||
| 2025-08-14 | 13F | Stifel Financial Corp | 46,548 | 83.57 | 3,003 | 112.91 | ||||
| 2025-04-22 | 13F | Synergy Financial Management, LLC | 0 | -100.00 | 0 | |||||
| 2025-08-08 | 13F | Wiser Advisor Group LLC | 0 | -100.00 | 0 | |||||
| 2025-04-23 | 13F | Mascagni Wealth Management, Inc. | 0 | -100.00 | 0 | -100.00 | ||||
| 2025-05-16 | 13F/A | Goldman Sachs Group Inc | 0 | -100.00 | 0 | -100.00 | ||||
| 2025-08-06 | 13F | Aspect Partners, LLC | 8 | -27.27 | 1 | |||||
| 2025-07-31 | 13F | Carrera Capital Advisors | 5,592 | 0.00 | 361 | 15.76 | ||||
| 2025-08-12 | 13F | AlphaCore Capital LLC | 4,890 | 315 | ||||||
| 2025-05-02 | 13F | Cable Hill Partners, LLC | 5,825 | -29.82 | 330 | -33.94 | ||||
| 2025-08-11 | 13F | Strategic Wealth Partners, Ltd. | 235 | 15 | ||||||
| 2025-08-14 | 13F | Mml Investors Services, Llc | 16,336 | 4.60 | 1 | |||||
| 2025-08-12 | 13F | Richmond Investment Services, LLC | 24,200 | 6.76 | 1,561 | 23.89 | ||||
| 2025-08-01 | 13F | Envestnet Asset Management Inc | 39,276 | 73.35 | 2,534 | 101.03 | ||||
| 2025-08-13 | 13F | Lido Advisors, LLC | 3,201 | -46.18 | 207 | -37.58 | ||||
| 2025-08-14 | 13F | GWM Advisors LLC | 604 | 179.63 | 39 | 216.67 | ||||
| 2025-07-29 | 13F | Dale Q Rice Investment Management Ltd | 24,690 | -48.77 | 1,602 | -40.26 | ||||
| 2025-08-06 | 13F | AE Wealth Management LLC | 16,030 | 201.26 | 1,034 | 250.51 | ||||
| 2025-07-10 | 13F | Capital Advisory Group Advisory Services, LLC | 61,012 | 17.42 | 3,936 | 36.16 | ||||
| 2025-07-14 | 13F | Signature Securities Group Corporation | 0 | -100.00 | 0 | |||||
| 2025-08-08 | 13F | Avantax Advisory Services, Inc. | 3,702 | -7.50 | 239 | 7.21 | ||||
| 2025-08-05 | 13F | Huntington National Bank | 6 | 0.00 | ||||||
| 2025-08-08 | 13F | Cetera Investment Advisers | 64,953 | 30.25 | 4,190 | 51.10 | ||||
| 2025-07-24 | 13F | IFP Advisors, Inc | 4,254 | 261.73 | 274 | 321.54 | ||||
| 2025-08-12 | 13F | SRS Capital Advisors, Inc. | 6,888 | 0.00 | 444 | 15.93 | ||||
| 2025-08-15 | 13F | Equitable Holdings, Inc. | 15,187 | -3.33 | 980 | 12.14 | ||||
| 2025-07-25 | 13F | Envestnet Portfolio Solutions, Inc. | 14,419 | 91.03 | 930 | 121.96 | ||||
| 2025-08-19 | 13F | Asset Dedication, LLC | 318 | 0.00 | 21 | 17.65 | ||||
| 2025-08-12 | 13F | Steward Partners Investment Advisory, Llc | 578 | 0.00 | 37 | 15.63 | ||||
| 2025-07-15 | 13F | Armis Advisers, LLC | 5,996 | -0.08 | 386 | 13.86 | ||||
| 2025-08-04 | 13F | Amplius Wealth Advisors, LLC | 873,033 | -3.16 | 56,315 | 12.30 | ||||
| 2025-07-25 | 13F | Cwm, Llc | 200 | -44.29 | 0 | |||||
| 2025-08-04 | 13F | Assetmark, Inc | 3 | 0.00 | 0 | |||||
| 2025-08-14 | 13F | Fmr Llc | 18,827 | 2.44 | 1,215 | 18.79 | ||||
| 2025-08-08 | 13F | Flaharty Asset Management, LLC | 0 | -100.00 | 0 | |||||
| 2025-08-14 | 13F | Susquehanna International Group, Llp | 0 | -100.00 | 0 | |||||
| 2025-08-04 | 13F | Spire Wealth Management | 9,511 | 1,429.10 | 614 | 1,702.94 | ||||
| 2025-08-14 | 13F | LaSalle St. Investment Advisors, LLC | 11,671 | 1 | ||||||
| 2025-08-07 | 13F | Parkside Financial Bank & Trust | 1,123 | 72 | ||||||
| 2025-08-11 | 13F | Brown Brothers Harriman & Co | 2,950 | 18.00 | 190 | 36.69 | ||||
| 2025-07-17 | 13F | Sound Income Strategies, LLC | 879 | 57 | ||||||
| 2025-08-08 | 13F | Larson Financial Group LLC | 44,798 | 25.78 | 2,890 | 45.91 | ||||
| 2025-08-12 | 13F | Coldstream Capital Management Inc | 5,825 | 14,462.50 | 376 | 18,650.00 | ||||
| 2025-07-28 | 13F | Frazier Financial Advisors, LLC | 267 | 17 | ||||||
| 2025-08-14 | 13F | Visionary Wealth Advisors | 56,314 | 17.91 | 3,633 | 36.75 | ||||
| 2025-07-22 | 13F | Berger Financial Group, Inc | 4,440 | -14.60 | 286 | -1.04 | ||||
| 2025-07-30 | 13F | Green Square Capital Advisors Llc | 19,080 | 1,231 | ||||||
| 2025-08-13 | 13F | Cerity Partners LLC | 11,345 | -0.02 | 732 | 15.85 | ||||
| 2025-05-15 | 13F | Concorde Asset Management, LLC | 3,761 | 5.59 | 207 | -3.74 | ||||
| 2025-08-15 | 13F | Synergy Financial Group, LTD | 44,107 | 6.21 | 2,845 | 23.21 | ||||
| 2025-08-05 | 13F | American Capital Advisory, LLC | 132 | 0.00 | 8 | 14.29 | ||||
| 2025-08-08 | 13F | Thoroughbred Financial Services, Llc | 13,742 | 1 | ||||||
| 2025-08-08 | 13F | Foundations Investment Advisors, LLC | 3,453 | 223 | ||||||
| 2025-08-06 | 13F | Rps Advisory Solutions Llc | 0 | -100.00 | 0 | |||||
| 2025-08-05 | 13F | GPS Wealth Strategies Group, LLC | 42 | 0.00 | 3 | 0.00 | ||||
| 2025-05-15 | 13F | Warren Averett Asset Management, LLC | 0 | -100.00 | 0 | |||||
| 2025-08-14 | 13F/A | Barclays Plc | 3,387 | 0.00 | 0 | |||||
| 2025-08-06 | 13F | Commonwealth Equity Services, Llc | 80,165 | 17.99 | 5 | 66.67 | ||||
| 2025-08-14 | 13F | Raymond James Financial Inc | 693,971 | 82.83 | 44,768 | 112.06 | ||||
| 2025-07-08 | 13F | Parallel Advisors, LLC | 268 | 0.00 | 17 | 21.43 | ||||
| 2025-08-11 | 13F | Intrepid Financial Planning Group LLC | 14,727 | 2.36 | 950 | 18.75 | ||||
| 2025-07-08 | 13F | Strategic Advocates LLC | 7,139 | 19.24 | 461 | 38.14 | ||||
| 2025-07-15 | 13F | FLP Wealth Management, LLC | 0 | -100.00 | 0 | |||||
| 2025-08-14 | 13F | Mariner, LLC | 4,716 | 17.52 | 304 | 36.32 | ||||
| 2025-08-14 | 13F | Great Valley Advisor Group, Inc. | 10,262 | 662 | ||||||
| 2025-08-07 | 13F | Allworth Financial LP | 500 | 0.00 | 32 | 18.52 | ||||
| 2025-09-04 | 13F/A | Advisor Group Holdings, Inc. | 119,000 | 107.24 | 7,677 | 140.36 | ||||
| 2025-07-10 | 13F | Wedmont Private Capital | 3,114 | 202 | ||||||
| 2025-07-25 | 13F | Atria Wealth Solutions, Inc. | 89,291 | 40.36 | 5,760 | 62.80 | ||||
| 2025-08-04 | 13F | Creative Financial Designs Inc /adv | 599 | 0.00 | 39 | 15.15 | ||||
| 2025-07-24 | 13F | JNBA Financial Advisors | 125 | 8 | ||||||
| 2025-08-14 | 13F | Marathon Capital Management | 4,126 | 1.23 | 266 | 17.70 | ||||
| 2025-08-15 | 13F | First Heartland Consultants, Inc. | 10,571 | 17.07 | 682 | 35.66 | ||||
| 2025-08-11 | 13F | Principal Securities, Inc. | 670 | 109.38 | 43 | 126.32 | ||||
| 2025-07-17 | 13F | Janney Montgomery Scott LLC | 13,371 | 32.82 | 1 | |||||
| 2025-08-14 | 13F | Wiley Bros.-aintree Capital, Llc | 47,281 | 7.43 | 3,050 | 25.05 | ||||
| 2025-08-14 | 13F | UBS Group AG | 0 | -100.00 | 0 | |||||
| 2025-07-16 | 13F | Strategic Investment Solutions, Inc. /IL | 50 | 3 | ||||||
| 2025-07-28 | 13F | Mutual Advisors, LLC | 33,436 | 45.05 | 2,215 | 70.91 | ||||
| 2025-08-06 | 13F | Prospera Financial Services Inc | 10,874 | 1.29 | 701 | 17.42 | ||||
| 2025-08-18 | 13F | Hollencrest Capital Management | 1,500 | 0.00 | 97 | 15.66 | ||||
| 2025-07-28 | 13F | RFG Advisory, LLC | 7,980 | -15.82 | 515 | -2.47 | ||||
| 2025-08-14 | 13F | CoreCap Advisors, LLC | 9,071 | -1.90 | 585 | 13.81 | ||||
| 2025-07-08 | 13F | Goldstone Financial Group, LLC | 3,569 | -2.59 | 232 | 13.79 | ||||
| 2025-07-28 | 13F | Harbour Investments, Inc. | 5,415 | 10.20 | 349 | 27.84 | ||||
| 2025-08-11 | 13F | Lowe Brockenbrough & Co Inc | 5,900 | 0.00 | 381 | 15.85 | ||||
| 2025-08-12 | 13F | Titleist Asset Management, Llc | 17,212 | 0.40 | 1,110 | 16.47 | ||||
| 2025-08-15 | 13F | Captrust Financial Advisors | 5,623 | 0.00 | 363 | 16.03 | ||||
| 2025-08-11 | 13F | Western Wealth Management, LLC | 18,639 | 1,202 | ||||||
| 2025-08-05 | 13F | Bank Of Montreal /can/ | 1,100 | 0.00 | 71 | 14.75 | ||||
| 2025-07-17 | 13F | Walker Asset Management, LLC | 71,432 | 9.52 | 4,608 | 27.05 | ||||
| 2025-07-21 | 13F | Portfolio Strategies, Inc. | 439,867 | 9.50 | 28,368 | 26.97 | ||||
| 2025-08-15 | 13F | Morgan Stanley | 16,347 | 25.28 | 1,055 | 45.38 | ||||
| 2025-07-21 | 13F | Cornell Pochily Investment Advisors, Inc. | 3,887 | 5.88 | 251 | 22.55 | ||||
| 2025-08-14 | 13F | Headinvest, Llc | 5,783 | 0.00 | 373 | 16.20 | ||||
| 2025-08-14 | 13F | Comerica Bank | 90 | 0.00 | 6 | 0.00 | ||||
| 2025-08-14 | 13F | Redwood Financial Network Corp | 60,220 | 0.51 | 3,885 | 16.57 |