Mga Batayang Estadistika
| Pemilik Institusional | 230 total, 229 long only, 0 short only, 1 long/short - change of 5.02% MRQ |
| Alokasi Portofolio Rata-rata | 0.2477 % - change of -6.35% MRQ |
| Saham Institusional (Jangka Panjang) | 9,789,220 (ex 13D/G) - change of 0.18MM shares 1.89% MRQ |
| Nilai Institusional (Jangka Panjang) | $ 1,558,879 USD ($1000) |
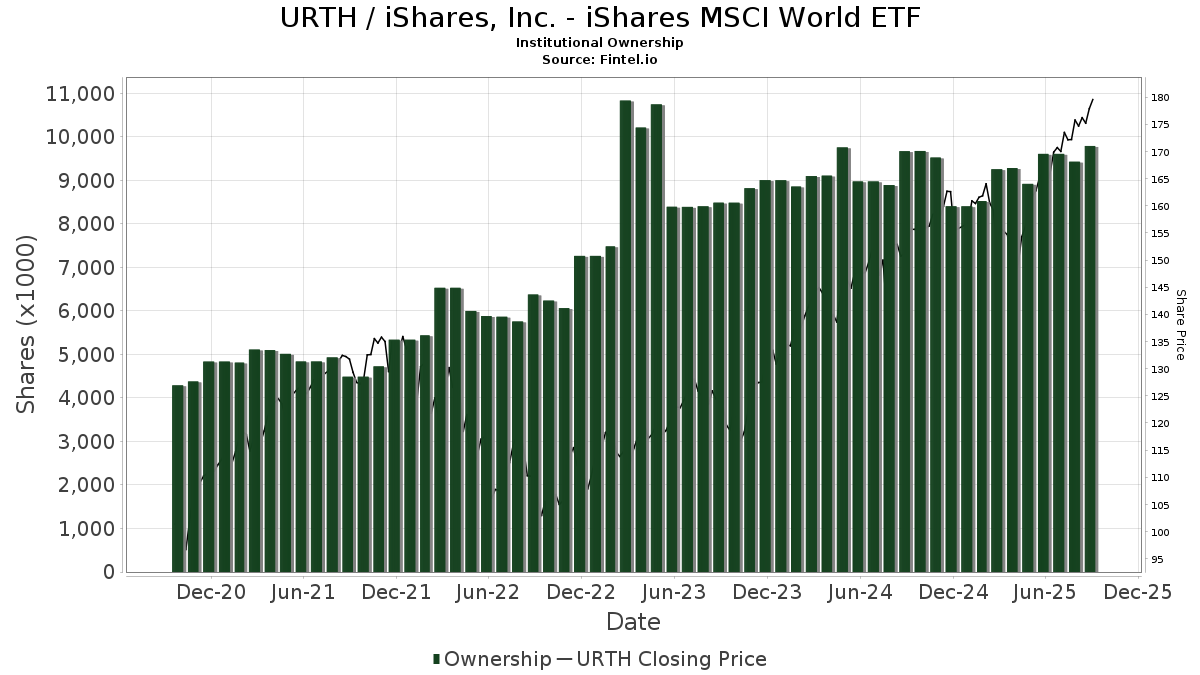
Kepemilikan Institusional dan Pemegang Saham
iShares, Inc. - iShares MSCI World ETF (US:URTH) memiliki 230 pemilik institusional dan pemegang saham yang telah mengajukan formulir 13D/G atau 13F kepada Komisi Bursa Efek (Securities Exchange Commission/SEC). Lembaga-lembaga ini memegang total 9,789,220 saham. Pemegang saham terbesar meliputi Royal Bank Of Canada, Morgan Stanley, Goldman Sachs Group Inc, Prudential Plc, Sumitomo Mitsui DS Asset Management Company, Ltd, Barings Llc, Obermeyer Wood Investment Counsel, Lllp, Evensky & Katz LLC, Mirae Asset Global Investments Co., Ltd., and Jpmorgan Chase & Co .
Struktur kepemilikan institusional iShares, Inc. - iShares MSCI World ETF (ARCA:URTH) menunjukkan posisi terkini di perusahaan oleh institusi dan dana, serta perubahan terbaru dalam ukuran posisi. Pemegang saham utama dapat mencakup investor individu, reksa dana, dana lindung nilai, atau institusi. Jadwal 13D menunjukkan bahwa investor memegang (atau pernah memegang) lebih dari 5% saham perusahaan dan bermaksud (atau pernah bermaksud) untuk secara aktif mengejar perubahan strategi bisnis. Jadwal 13G menunjukkan investasi pasif lebih dari 5%.
The share price as of September 5, 2025 is 176.43 / share. Previously, on September 9, 2024, the share price was 149.33 / share. This represents an increase of 18.15% over that period.
Skor Sentimen Dana
Skor Sentimen Dana (sebelumnya dikenal sebagai Skor Akumulasi Kepemilikan) menemukan saham-saham yang paling banyak dibeli oleh dana. Ini adalah hasil dari model kuantitatif multi-faktor yang canggih yang mengidentifikasi perusahaan dengan tingkat akumulasi institusional tertinggi. Model penilaian menggunakan kombinasi dari total peningkatan pemilik yang diungkapkan, perubahan dalam alokasi portofolio pada pemilik tersebut, dan metrik lainnya. Angka berkisar dari 0 hingga 100, dengan angka yang lebih tinggi menunjukkan tingkat akumulasi yang lebih tinggi dibandingkan dengan perusahaan sejenisnya, dan 50 adalah rata-ratanya.
Frekuensi Pembaruan: Setiap Hari
Lihat Ownership Explorer, yang menyediakan daftar perusahaan dengan peringkat tertinggi.
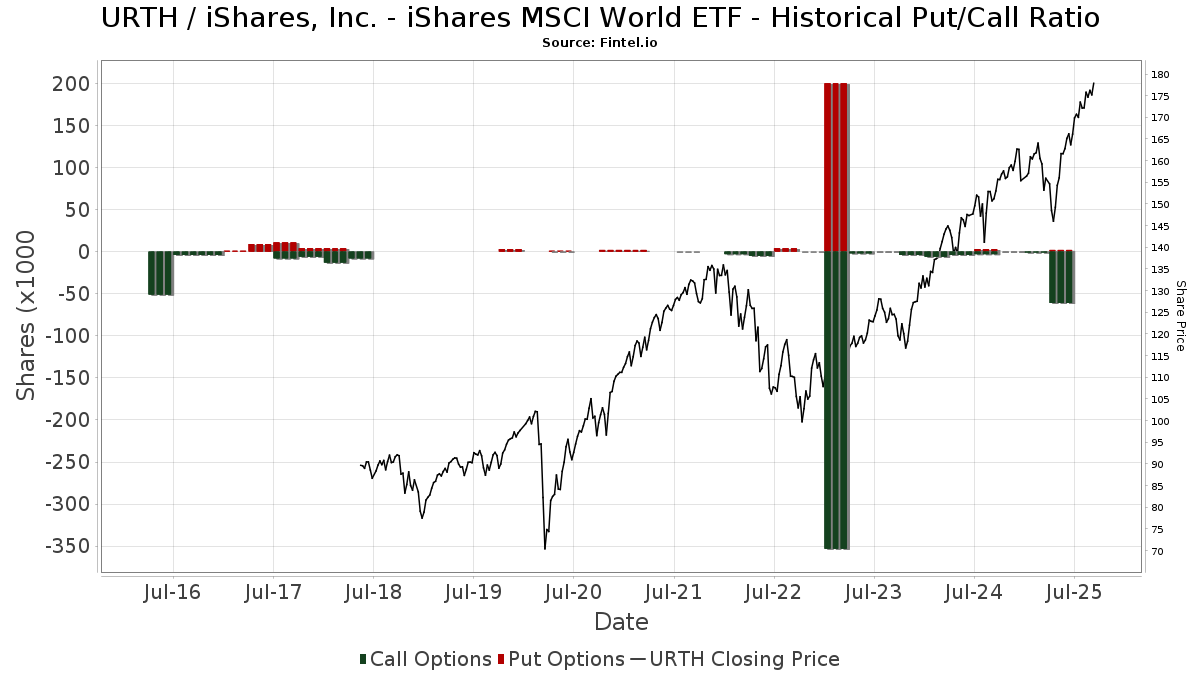
Rasio Put/Call Institusional
Selain melaporkan isu ekuitas dan utang standar, institusi dengan aset di bawah manajemen lebih dari 100 juta dolar AS juga harus mengungkapkan kepemilikan opsi put dan call mereka. Karena opsi put umumnya menunjukkan sentimen negatif, dan opsi call menunjukkan sentimen positif, kita dapat mengetahui sentimen institusional secara keseluruhan dengan memplot rasio put terhadap call. Grafik di sebelah kanan memplot rasio put/call historis untuk instrumen ini.
Menggunakan Rasio Put/Call sebagai indikator sentimen investor mengatasi salah satu kekurangan utama dari penggunaan total kepemilikan institusional, yaitu sejumlah besar aset yang dikelola diinvestasikan secara pasif untuk melacak indeks. Dana yang dikelola secara pasif biasanya tidak membeli opsi, sehingga indikator rasio put/call lebih akurat dalam melacak sentimen dana yang dikelola secara aktif.
Pengajuan 13F dan NPORT
Detail pada pengajuan 13F tersedia gratis. Detail pada pengajuan NP memerlukan keanggotaan premium. Baris berwarna hijau menunjukkan posisi baru. Baris berwarna merah menunjukkan posisi yang sudah ditutup. Klik tautan ini ikon untuk melihat riwayat transaksi selengkapnya.
Tingkatkan
untuk membuka data premium dan mengekspor ke Excel ![]() .
.
| Tanggal File | Sumber | Investor | Ketik | Presyo ng Avg (Silangan) |
Saham | Δ Saham (%) |
Dilaporkan Nilai ($1000) |
Nilai Δ (%) |
Alokasi Port (%) |
|
|---|---|---|---|---|---|---|---|---|---|---|
| 2025-08-14 | 13F | Raymond James Financial Inc | 115,770 | 5.26 | 19,609 | 16.39 | ||||
| 2025-04-09 | 13F | LVW Advisors, LLC | 0 | -100.00 | 0 | |||||
| 2025-08-14 | 13F/A | Bank Julius Baer & Co. Ltd, Zurich | 84,860 | -18.21 | 14,374 | -19.98 | ||||
| 2025-08-12 | 13F | Prudential Financial Inc | 67,050 | 10,504 | ||||||
| 2025-08-08 | 13F | Emerald Investment Partners, Llc | 600 | 0.00 | 102 | 10.99 | ||||
| 2025-09-04 | 13F/A | Advisor Group Holdings, Inc. | 9,762 | -4.73 | 1,654 | 5.42 | ||||
| 2025-04-18 | 13F | Insigneo Advisory Services, Llc | 0 | -100.00 | 0 | -100.00 | ||||
| 2025-08-04 | 13F | Roble, Belko & Company, Inc | 14 | 0.00 | 0 | |||||
| 2025-08-14 | 13F | Main Street Financial Solutions, LLC | 3,029 | 513 | ||||||
| 2025-07-22 | 13F | Evensky & Katz LLC | 287,317 | 0.12 | 49 | 11.63 | ||||
| 2025-07-30 | 13F | Arbor Investment Advisors, LLC | 2,793 | 43.82 | 473 | 59.26 | ||||
| 2025-07-24 | 13F | Us Bancorp \de\ | 801 | 136 | ||||||
| 2025-08-11 | 13F | Wealthgarden F.s. Llc | 1,730 | 10.33 | 296 | 23.33 | ||||
| 2025-08-14 | 13F | BTG Pactual Asset Management US LLC | 1,470 | 0.00 | 225 | 0.00 | ||||
| 2025-08-14 | 13F | Financial Advisory Service, Inc. | 1,060 | 0.86 | 179 | 11.18 | ||||
| 2025-07-31 | 13F | Buckingham Strategic Partners | 1,650 | 0.00 | 279 | 10.71 | ||||
| 2025-07-30 | 13F | Bleakley Financial Group, LLC | 55,444 | 4.09 | 9,391 | 15.10 | ||||
| 2025-08-13 | 13F | Northwestern Mutual Wealth Management Co | 37,659 | -20.69 | 6,379 | -12.31 | ||||
| 2025-08-14 | 13F | Fmr Llc | 6,308 | 794.75 | 1,068 | 898.13 | ||||
| 2025-07-08 | 13F | Parallel Advisors, LLC | 187 | 0.54 | 32 | 10.71 | ||||
| 2025-07-10 | 13F | Exchange Traded Concepts, Llc | 714 | 121 | ||||||
| 2025-08-08 | 13F | Principal Financial Group Inc | 207,424 | 6.57 | 35,133 | 17.84 | ||||
| 2025-07-31 | 13F | AlTi Global, Inc. | 6,072 | 0.00 | 1,028 | 10.54 | ||||
| 2025-08-08 | 13F | SG Americas Securities, LLC | 3,553 | 0.65 | 1 | |||||
| 2025-08-14 | 13F | Federation des caisses Desjardins du Quebec | 3,135 | -58.82 | 531 | -54.46 | ||||
| 2025-08-07 | 13F | Runnymede Capital Advisors, Inc. | 0 | -100.00 | 0 | |||||
| 2025-08-14 | 13F | Ausdal Financial Partners, Inc. | 2,720 | 0.00 | 461 | 10.58 | ||||
| 2025-07-18 | 13F | Union Bancaire Privee, UBP SA | 7,851 | 823.65 | 1,199 | 829.46 | ||||
| 2025-07-10 | 13F | Sumitomo Mitsui DS Asset Management Company, Ltd | 473,643 | -24.05 | 80,226 | -16.01 | ||||
| 2025-08-14 | 13F | Bbr Partners, Llc | 22,957 | -2.11 | 3,888 | 8.24 | ||||
| 2025-07-11 | 13F | Compass Ion Advisors, LLC | 0 | -100.00 | 0 | |||||
| 2025-08-11 | 13F | Wealthspire Advisors, LLC | 3,866 | 0.00 | 655 | 10.47 | ||||
| 2025-07-08 | 13F | Webster Bank, N. A. | 300 | 0.00 | 51 | 11.11 | ||||
| 2025-07-24 | 13F | Blair William & Co/il | 6,694 | 3.37 | 1,134 | 14.33 | ||||
| 2025-08-14 | 13F | Atomi Financial Group, Inc. | 6,842 | 4.97 | 1,159 | 16.03 | ||||
| 2025-08-07 | 13F | Nwam Llc | 3,210 | 6.93 | 553 | 20.26 | ||||
| 2025-08-04 | 13F | Keybank National Association/oh | 3,050 | 0.00 | 517 | 10.49 | ||||
| 2025-08-14 | 13F | Gen-Wealth Partners Inc | 617 | 0.00 | 105 | 10.64 | ||||
| 2025-08-05 | 13F | KDT Advisors, LLC | 3,100 | 0.00 | 525 | 10.76 | ||||
| 2025-05-02 | 13F | BluePointe Capital Management, LLC | 41,546 | 25.51 | 6,364 | 23.63 | ||||
| 2025-08-14 | 13F | Waterford Advisors, LLC | 24,250 | 557.54 | 625 | 10.64 | ||||
| 2025-05-06 | 13F | Assetmark, Inc | 0 | -100.00 | 0 | |||||
| 2025-07-25 | 13F | Atria Wealth Solutions, Inc. | 1,256 | 213 | ||||||
| 2025-07-16 | 13F | Beaumont Financial Advisors, LLC | 2,110 | 0.00 | 357 | 10.53 | ||||
| 2025-08-14 | 13F | Mariner, LLC | 7,217 | 2.25 | 1,222 | 13.04 | ||||
| 2025-08-21 | NP | LAZARD RETIREMENT SERIES INC - Lazard Retirement Global Dynamic Multi-Asset Portfolio Investor Shares | 50,300 | 184.82 | 8,520 | 214.94 | ||||
| 2025-07-16 | 13F | Banque Pictet & Cie Sa | 28,523 | -0.63 | 4,831 | 9.87 | ||||
| 2025-08-08 | 13F | Banco Bilbao Vizcaya Argentaria, S.a. | 21,670 | -1.68 | 3,670 | 8.71 | ||||
| 2025-08-14 | 13F | Ameriprise Financial Inc | 4,879 | -0.14 | 826 | 10.43 | ||||
| 2025-07-15 | 13F | CHB Investment Group, LLC | 7,594 | -1.52 | 1 | 0.00 | ||||
| 2025-08-05 | 13F | MidAtlantic Capital Management, Inc. | 6,444 | 0.23 | 1,091 | 10.87 | ||||
| 2025-08-14 | 13F | DRW Securities, LLC | 0 | -100.00 | 0 | -100.00 | ||||
| 2025-08-13 | 13F | Holos Integrated Wealth LLC | 1,285 | -10.70 | 223 | 1.36 | ||||
| 2025-07-25 | 13F | We Are One Seven, LLC | 0 | -100.00 | 0 | |||||
| 2025-07-31 | 13F | Washington Trust Advisors, Inc. | 393 | 5.08 | 67 | 15.79 | ||||
| 2025-08-11 | 13F | Aptus Capital Advisors, LLC | 165 | -7.30 | 28 | 0.00 | ||||
| 2025-08-12 | 13F | Archer Investment Corp | 484 | 188.10 | 82 | 224.00 | ||||
| 2025-08-12 | 13F | Prudential Plc | 560,510 | -3.88 | 94,939 | 6.28 | ||||
| 2025-04-30 | 13F | Stratos Wealth Advisors, LLC | 0 | -100.00 | 0 | |||||
| 2025-08-13 | 13F | M&t Bank Corp | 8,382 | 4.70 | 1,420 | 15.74 | ||||
| 2025-08-14 | 13F | Colony Group, LLC | 4,598 | 0.24 | 779 | 10.83 | ||||
| 2025-08-15 | 13F | Tower Research Capital LLC (TRC) | 0 | -100.00 | 0 | |||||
| 2025-08-14 | 13F | Xponance, Inc. | 58,494 | 57.69 | 9,908 | 74.36 | ||||
| 2025-07-28 | 13F | BRYN MAWR TRUST Co | 4,793 | 0.00 | 812 | 10.49 | ||||
| 2025-08-12 | 13F | Personal Cfo Solutions, Llc | 3,002 | 508 | ||||||
| 2025-08-15 | 13F | Equitable Holdings, Inc. | 4,056 | 16.65 | 687 | 29.14 | ||||
| 2025-08-14 | 13F | Arizona PSPRS Trust | 0 | -100.00 | 0 | |||||
| 2025-05-15 | 13F | Squarepoint Ops LLC | 0 | -100.00 | 0 | |||||
| 2025-08-04 | 13F | Impact Partnership Wealth, LLC | 1,685 | -16.38 | 285 | -7.47 | ||||
| 2025-07-21 | 13F | Mirae Asset Global Investments Co., Ltd. | 264,024 | 8.79 | 44,720 | 20.54 | ||||
| 2025-08-04 | 13F | GAM Holding AG | 143,421 | 24,293 | ||||||
| 2025-07-23 | 13F | Joel Isaacson & Co., LLC | 4,793 | 0.00 | 812 | 10.49 | ||||
| 2025-08-06 | 13F | Pekin Hardy Strauss, Inc. | 8,800 | 0.00 | 1,491 | 10.62 | ||||
| 2025-07-15 | 13F | Financial Management Professionals, Inc. | 52 | 0.00 | 9 | 14.29 | ||||
| 2025-08-14 | 13F | Citadel Advisors Llc | 69,327 | 11,743 | ||||||
| 2025-07-24 | 13F | Fischer Investment Strategies, Llc | 52,943 | 13.34 | 8,967 | 25.32 | ||||
| 2025-07-17 | 13F | Nelson, Van Denburg & Campbell Wealth Management Group, LLC | 5,627 | -4.47 | 953 | 5.65 | ||||
| 2025-07-24 | 13F | Robertson Stephens Wealth Management, LLC | 3,272 | 0.77 | 554 | 11.47 | ||||
| 2025-08-08 | 13F | Cetera Investment Advisers | 74,235 | -5.83 | 12,574 | 4.13 | ||||
| 2025-08-13 | 13F | Lido Advisors, LLC | 48,589 | 664.70 | 8,230 | 745.84 | ||||
| 2025-08-04 | 13F | Atria Investments Llc | 1,630 | 276 | ||||||
| 2025-07-15 | 13F | Retirement Income Solutions, Inc | 3,985 | 0.00 | 675 | 10.49 | ||||
| 2025-08-08 | 13F | Hartland & Co., LLC | 126 | 0.00 | 21 | 10.53 | ||||
| 2025-08-14 | 13F | Lazard Asset Management Llc | 50,300 | 184.82 | 9 | 300.00 | ||||
| 2025-08-14 | 13F | Smartleaf Asset Management LLC | 1,315 | -29.57 | 222 | -22.46 | ||||
| 2025-07-29 | 13F | Horst & Graben Wealth Management LLC | 1,614 | 0.00 | 273 | 10.53 | ||||
| 2025-08-14 | 13F | Mercer Global Advisors Inc /adv | 2,488 | -2.66 | 421 | 7.67 | ||||
| 2025-08-12 | 13F | J.w. Cole Advisors, Inc. | 1,828 | 310 | ||||||
| 2025-08-12 | 13F | Barings Llc | 358,101 | 13.96 | 60,655 | 26.01 | ||||
| 2025-04-21 | 13F | Envestnet Portfolio Solutions, Inc. | 0 | -100.00 | 0 | |||||
| 2025-07-16 | 13F | Perigon Wealth Management, LLC | 2,561 | 0.08 | 434 | 10.74 | ||||
| 2025-08-11 | 13F | HighTower Advisors, LLC | 2,857 | 9.59 | 484 | 21.05 | ||||
| 2025-08-11 | 13F | TD Waterhouse Canada Inc. | 29,211 | -0.17 | 4,938 | 9.90 | ||||
| 2025-08-13 | 13F | Taikang Asset Management (Hong Kong) Co Ltd | 9,769 | -33.49 | 1,655 | -26.49 | ||||
| 2025-07-24 | 13F | IFP Advisors, Inc | 11 | 0.00 | 2 | 0.00 | ||||
| 2025-08-12 | 13F | LPL Financial LLC | 187,256 | 13.80 | 31,717 | 25.84 | ||||
| 2025-07-29 | 13F | Fundamentun, Llc | 5,051 | 39.96 | 856 | 54.89 | ||||
| 2025-07-29 | 13F | JTC Employer Solutions Trusteee Ltd | 878 | 0.00 | 0 | |||||
| 2025-08-15 | 13F | CI Private Wealth, LLC | 1,304 | 221 | ||||||
| 2025-08-12 | 13F | Seeds Investor Llc | 9,433 | 66.57 | 1,598 | 84.20 | ||||
| 2025-08-19 | 13F | Advisory Services Network, LLC | 3,290 | 67.60 | 563 | 87.33 | ||||
| 2025-08-05 | 13F | Dunhill Financial, LLC | 400 | 68 | ||||||
| 2025-08-14 | 13F | Old Mission Capital Llc | 0 | -100.00 | 0 | |||||
| 2025-08-05 | 13F | Tsfg, Llc | 403 | 0.00 | 0 | |||||
| 2025-07-22 | 13F | Valeo Financial Advisors, LLC | 4,068 | 0.00 | 689 | 10.59 | ||||
| 2025-08-14 | 13F | EP Wealth Advisors, Inc. | 905 | 0.33 | 153 | 10.87 | ||||
| 2025-07-28 | 13F | Sagespring Wealth Partners, Llc | 3,363 | -20.94 | 570 | -12.60 | ||||
| 2025-08-13 | 13F | Cerity Partners LLC | 5,374 | 0.00 | 910 | 10.57 | ||||
| 2025-08-13 | 13F | Silphium Asset Management Ltd | 44,830 | 7,593 | ||||||
| 2025-08-14 | 13F | Ieq Capital, Llc | 3,006 | 3.62 | 509 | 14.64 | ||||
| 2025-07-29 | 13F | Private Trust Co Na | 238 | 0.00 | 40 | 11.11 | ||||
| 2025-08-14 | 13F | Tudor Investment Corp Et Al | 1,881 | 319 | ||||||
| 2025-08-14 | 13F | Bank Of America Corp /de/ | 202,674 | -32.93 | 34,329 | -25.84 | ||||
| 2025-08-14 | 13F | Warren Averett Asset Management, LLC | 3,822 | 647 | ||||||
| 2025-08-04 | 13F | JDM Financial Group LLC | 1,457 | 0.00 | 247 | 10.31 | ||||
| 2025-08-08 | 13F | Pnc Financial Services Group, Inc. | 18,935 | 0.00 | 3,207 | 10.59 | ||||
| 2025-08-13 | 13F | Qtron Investments LLC | 5,337 | 904 | ||||||
| 2025-08-12 | 13F | CIBC Private Wealth Group, LLC | 50 | 0.00 | 8 | 33.33 | ||||
| 2025-08-12 | 13F | Bokf, Na | 0 | -100.00 | 0 | |||||
| 2025-08-12 | 13F | Jpmorgan Chase & Co | 263,989 | 15.82 | 44,715 | 28.07 | ||||
| 2025-08-14 | 13F | Comerica Bank | 186 | 84.16 | 31 | 106.67 | ||||
| 2025-08-14 | 13F | Two Sigma Securities, Llc | 2,052 | 42.70 | 348 | 57.73 | ||||
| 2025-05-13 | 13F | Sterling Capital Management LLC | 0 | -100.00 | 0 | |||||
| 2025-08-14 | 13F | Susquehanna International Group, Llp | 2,031 | 344 | ||||||
| 2025-07-17 | 13F | Keystone Global Partners, LLC | 124 | 195.24 | 21 | 250.00 | ||||
| 2025-08-11 | 13F | Principal Securities, Inc. | 1,155 | 178.99 | 196 | 204.69 | ||||
| 2025-08-14 | 13F | Susquehanna International Group, Llp | Call | 61,000 | 3,488.24 | 10,332 | 3,873.85 | |||
| 2025-08-14 | 13F | C M Bidwell & Associates Ltd | 432 | 0.23 | 73 | 10.61 | ||||
| 2025-08-14 | 13F | Susquehanna International Group, Llp | Put | 2,300 | 390 | |||||
| 2025-07-30 | 13F | Strategic Blueprint, LLC | 4,320 | 167.00 | 732 | 195.95 | ||||
| 2025-08-08 | 13F | Avantax Advisory Services, Inc. | 0 | -100.00 | 0 | |||||
| 2025-07-28 | 13F | Arlington Financial Advisors, LLC | 2,975 | -29.88 | 504 | -22.50 | ||||
| 2025-07-29 | 13F | Signature Estate & Investment Advisors Llc | 1,420 | 8.48 | 241 | 20.00 | ||||
| 2025-08-14 | 13F | Brevan Howard Capital Management LP | 0 | -100.00 | 0 | |||||
| 2025-08-15 | 13F | Captrust Financial Advisors | 2,757 | 467 | ||||||
| 2025-08-18 | 13F | Geneos Wealth Management Inc. | 1,012 | 0.10 | 171 | 11.04 | ||||
| 2025-08-25 | 13F | Fulcrum Equity Management | 46,192 | 0.00 | 7,824 | 10.59 | ||||
| 2025-08-11 | 13F | Citigroup Inc | 2,713 | 1.95 | 460 | 12.78 | ||||
| 2025-08-13 | 13F | EverSource Wealth Advisors, LLC | 6 | 0.00 | 1 | |||||
| 2025-07-17 | 13F | BFI Infinity Ltd. | 2,056 | 348 | ||||||
| 2025-08-06 | 13F | AE Wealth Management LLC | 150 | 1,400.00 | 25 | 2,400.00 | ||||
| 2025-08-12 | 13F | Auxano Advisors, LLC | 1,270 | 215 | ||||||
| 2025-08-07 | 13F | LOM Asset Management Ltd | 5,165 | 1 | ||||||
| 2025-05-15 | 13F | Rakuten Investment Management, Inc. | 1 | 0 | ||||||
| 2025-07-18 | 13F | First Pacific Financial | 0 | -100.00 | 0 | -100.00 | ||||
| 2025-07-30 | 13F | Lorne Steinberg Wealth Management Inc. | 9,779 | 109.58 | 1,656 | 131.93 | ||||
| 2025-08-14 | 13F | Great Valley Advisor Group, Inc. | 7,347 | -3.62 | 1,244 | 6.60 | ||||
| 2025-08-13 | 13F | Quadrature Capital Ltd | 0 | -100.00 | 0 | |||||
| 2025-08-07 | 13F | LFA - Lugano Financial Advisors SA | 108 | 18 | ||||||
| 2025-08-14 | 13F | Financial Engines Advisors L.L.C. | 1,250 | -36.42 | 212 | -29.57 | ||||
| 2025-07-30 | 13F | Retirement Planning Group | 7,236 | -0.44 | 1,226 | 10.06 | ||||
| 2025-08-11 | 13F | Sierra Capital LLC | 10,814 | 1.72 | 2 | 0.00 | ||||
| 2025-07-15 | 13F | Compagnie Lombard Odier SCmA | 48,329 | 10.54 | 8,186 | 22.22 | ||||
| 2025-07-31 | 13F | Glass Jacobson Investment Advisors llc | 0 | -100.00 | 0 | |||||
| 2025-08-12 | 13F | Ci Investments Inc. | 122,633 | -5.70 | 21 | 5.26 | ||||
| 2025-08-14 | 13F | Snowden Capital Advisors LLC | 3,700 | 0.00 | 627 | 10.60 | ||||
| 2025-08-13 | 13F | Rsm Us Wealth Management Llc | 2,364 | 400 | ||||||
| 2025-07-16 | 13F/A | CX Institutional | 5,041 | -6.04 | 1 | |||||
| 2025-08-04 | 13F | Creekmur Asset Management LLC | 103 | 0.00 | 17 | 13.33 | ||||
| 2025-08-13 | 13F | Mackenzie Financial Corp | 39,843 | 22.61 | 6,749 | 35.58 | ||||
| 2025-04-28 | 13F | D.a. Davidson & Co. | 0 | -100.00 | 0 | |||||
| 2025-08-15 | 13F | Kestra Advisory Services, LLC | 0 | -100.00 | 0 | |||||
| 2025-08-01 | 13F | Envestnet Asset Management Inc | 128,615 | -8.40 | 21,785 | 1.28 | ||||
| 2025-07-18 | 13F | Centricity Wealth Management, LLC | 450 | 0.00 | 76 | 11.76 | ||||
| 2025-08-27 | NP | PRUDENTIAL SERIES FUND - GLOBAL PORTFOLIO Class I | 67,050 | 11,357 | ||||||
| 2025-07-30 | 13F | Wbh Advisory Inc | 18,917 | 15.71 | 3,204 | 27.96 | ||||
| 2025-07-23 | 13F | Litman Gregory Asset Management LLC | 9,348 | 9.10 | 1,583 | 20.66 | ||||
| 2025-05-14 | 13F | Causeway Capital Management Llc | 0 | -100.00 | 0 | |||||
| 2025-07-16 | 13F | Magnus Financial Group LLC | 3,017 | 0.87 | 511 | 11.57 | ||||
| 2025-08-05 | 13F | Main Street Research LLC | 18,688 | 0.99 | 3,165 | 11.68 | ||||
| 2025-08-13 | 13F | Brown Advisory Inc | 30,272 | 0.60 | 5,127 | 11.24 | ||||
| 2025-08-12 | 13F | AlphaCore Capital LLC | 1,075 | 217.11 | 182 | 256.86 | ||||
| 2025-08-14 | 13F | DZ BANK AG Deutsche Zentral Genossenschafts Bank, Frankfurt am Main | 0 | -100.00 | 0 | |||||
| 2025-08-14 | 13F | LWM Advisory Services, LLC | 3,242 | 0.00 | 549 | 10.69 | ||||
| 2025-08-14 | 13F | Banque Transatlantique SA | 0 | -100.00 | 0 | |||||
| 2025-08-14 | 13F | Jane Street Group, Llc | 0 | -100.00 | 0 | |||||
| 2025-05-08 | 13F | Letko, Brosseau & Associates Inc | 0 | -100.00 | 0 | |||||
| 2025-08-14 | 13F | Gerber Kawasaki Wealth & Investment Management | 79,757 | 3.34 | 13,509 | 14.27 | ||||
| 2025-07-30 | 13F | Rehmann Capital Advisory Group | 2,373 | 0.00 | 402 | 10.47 | ||||
| 2025-08-04 | 13F | Migdal Insurance & Financial Holdings Ltd. | 1,300 | 0.00 | 0 | |||||
| 2025-07-28 | 13F | J.Safra Asset Management Corp | 1,274 | 0.00 | 215 | 9.74 | ||||
| 2025-08-13 | 13F | Jones Financial Companies Lllp | 3,108 | 71.52 | 524 | 88.81 | ||||
| 2025-08-12 | 13F | Jefferies Financial Group Inc. | 0 | -100.00 | 0 | |||||
| 2025-08-13 | 13F | Mount Capital Ltd | 23,725 | -8.75 | 4,019 | 0.90 | ||||
| 2025-08-13 | 13F | Hsbc Holdings Plc | 34,600 | 0.00 | 5,861 | 10.57 | ||||
| 2025-08-12 | 13F | BlackRock, Inc. | 145,072 | 43.37 | 24,572 | 58.54 | ||||
| 2025-08-13 | 13F | Avestar Capital, LLC | 17,137 | -18.69 | 2,903 | -10.10 | ||||
| 2025-07-29 | 13F | Angeles Wealth Management, Llc | 119,304 | 5.68 | 20,208 | 16.86 | ||||
| 2025-08-14 | 13F | Bnp Paribas Arbitrage, Sa | 4,521 | -1.42 | 766 | 8.97 | ||||
| 2025-08-12 | 13F | Investments & Financial Planning, LLC | 54,495 | 6.40 | 9,230 | 17.65 | ||||
| 2025-04-23 | 13F | Corundum Group, Inc. | 0 | -100.00 | 0 | |||||
| 2025-08-13 | 13F | First Trust Advisors Lp | 17,137 | -18.69 | 2,903 | -10.10 | ||||
| 2025-08-12 | 13F | Edmond De Rothschild Holding S.a. | 5,615 | 0.00 | 951 | 10.58 | ||||
| 2025-05-12 | 13F | Independent Advisor Alliance | 0 | -100.00 | 0 | |||||
| 2025-08-14 | 13F | CIBC World Markets Inc. | 2,610 | 1.05 | 442 | 11.90 | ||||
| 2025-08-14 | 13F | Empire Life Investments Inc. | 76,900 | 9.54 | 13,025 | 21.13 | ||||
| 2025-08-14 | 13F | Centerstone Investors, LLC | 0 | -100.00 | 0 | |||||
| 2025-08-14 | 13F | Glen Eagle Advisors, LLC | 200 | 0.00 | 34 | 10.00 | ||||
| 2025-05-09 | 13F | Headlands Technologies LLC | 0 | -100.00 | 0 | |||||
| 2025-08-14 | 13F | Goldman Sachs Group Inc | 571,899 | -5.43 | 96,868 | 4.58 | ||||
| 2025-07-23 | 13F | Vontobel Holding Ltd. | 14,042 | 37.80 | 2,378 | 52.44 | ||||
| 2025-07-29 | 13F | Activest Wealth Management | 443 | 0.68 | 75 | 11.94 | ||||
| 2025-08-18 | 13F/A | National Bank Of Canada /fi/ | 574 | 731.88 | 97 | 870.00 | ||||
| 2025-07-29 | 13F | Chicago Partners Investment Group LLC | 3,031 | 0.76 | 526 | 11.94 | ||||
| 2025-08-05 | 13F | Cassaday & Co Wealth Management LLC | 1,740 | -2.79 | 295 | 7.30 | ||||
| 2025-07-31 | 13F | Nisa Investment Advisors, Llc | 1,500 | 0.00 | 254 | 10.92 | ||||
| 2025-08-08 | 13F | Gts Securities Llc | 1,727 | 293 | ||||||
| 2025-08-14 | 13F | ICONIQ Capital, LLC | 29,109 | 0.00 | 4,930 | 10.59 | ||||
| 2025-08-01 | 13F | SYM FINANCIAL Corp | 1,546 | 94.22 | 262 | 115.70 | ||||
| 2025-08-14 | 13F | Scientech Research LLC | 0 | -100.00 | 0 | |||||
| 2025-08-14 | 13F | GWM Advisors LLC | 25,404 | 70,466.67 | 4,303 | 85,940.00 | ||||
| 2025-08-14 | 13F | Partners Capital Investment Group, Llp | 28,981 | -83.53 | 4,909 | -81.79 | ||||
| 2025-07-23 | 13F | Ameliora Wealth Management Ltd. | 440 | -25.42 | 75 | -17.78 | ||||
| 2025-08-14 | 13F | Hrt Financial Lp | 1,876 | 0 | ||||||
| 2025-08-13 | 13F | StoneX Group Inc. | 2,347 | 2.62 | 398 | 13.43 | ||||
| 2025-08-13 | 13F | PineBridge Investments, L.P. | 59,103 | 75.49 | 10,011 | 94.07 | ||||
| 2025-07-16 | 13F | Signaturefd, Llc | 74 | 0.00 | 13 | 9.09 | ||||
| 2025-08-13 | 13F | Schroder Investment Management Group | 94,784 | 2.78 | 15,980 | 13.33 | ||||
| 2025-08-13 | 13F | Allie Family Office LLC | 2,478 | 0.00 | 420 | 10.55 | ||||
| 2025-07-30 | 13F | Whittier Trust Co | 1,775 | 0.00 | 301 | 10.70 | ||||
| 2025-08-01 | 13F | Banco Santander, S.A. | 206,346 | -14.41 | 34,951 | -5.36 | ||||
| 2025-08-05 | 13F | Mission Wealth Management, Lp | 2,641 | 0.00 | 447 | 10.64 | ||||
| 2025-08-14 | 13F | Glenmede Investment Management, LP | 3,927 | 665 | ||||||
| 2025-07-30 | 13F | LGT Financial Advisors LLC | 12 | 2 | ||||||
| 2025-08-12 | 13F | Steward Partners Investment Advisory, Llc | 17 | 0.00 | 3 | 0.00 | ||||
| 2025-08-07 | 13F | Resources Investment Advisors, LLC. | 2,284 | 387 | ||||||
| 2025-08-14 | 13F | Mml Investors Services, Llc | 4,026 | -60.57 | 1 | -100.00 | ||||
| 2025-07-17 | 13F | Fifth Third Securities, Inc. | 11,651 | 8.30 | 1,973 | 19.72 | ||||
| 2025-07-14 | 13F | Park Avenue Securities Llc | 4,172 | -30.20 | 1 | |||||
| 2025-08-15 | 13F | First Heartland Consultants, Inc. | 1,630 | 276 | ||||||
| 2025-08-14 | 13F | Sunbelt Securities, Inc. | 173 | 0.00 | 27 | 0.00 | ||||
| 2025-08-11 | 13F | Y.D. More Investments Ltd | 215 | 0.00 | 36 | 12.50 | ||||
| 2025-05-16 | 13F | Guardian Partners Inc. | 0 | -100.00 | 0 | |||||
| 2025-08-05 | 13F | Bank of New York Mellon Corp | 1,996 | -4.36 | 338 | 5.96 | ||||
| 2025-08-12 | 13F | Jaffetilchin Investment Partners, LLC | 2,625 | 0.77 | 445 | 11.28 | ||||
| 2025-08-13 | 13F | Cresset Asset Management, LLC | 21,749 | 30.45 | 3,684 | 44.26 | ||||
| 2025-08-14 | 13F | Qube Research & Technologies Ltd | 95 | -92.33 | 16 | -91.53 | ||||
| 2025-08-07 | 13F | Allworth Financial LP | 2,026 | -3.48 | 343 | 7.52 | ||||
| 2025-08-14 | 13F | UBS Group AG | 126,409 | 3.26 | 21,411 | 14.18 | ||||
| 2025-05-15 | 13F | Glenmede Trust Co Na | 3,927 | 0.00 | 602 | -1.48 | ||||
| 2025-08-14 | 13F | Royal Bank Of Canada | 1,538,407 | 5.49 | 260,576 | 16.65 | ||||
| 2025-08-13 | 13F | GeoWealth Management, LLC | 206 | 0.98 | 35 | 9.68 | ||||
| 2025-08-05 | 13F | Simplex Trading, Llc | 1,997 | 0 | ||||||
| 2025-08-06 | 13F | Vestmark Advisory Solutions, Inc. | 0 | -100.00 | 0 | |||||
| 2025-05-15 | 13F | Citadel Advisors Llc | Put | 0 | -100.00 | 0 | -100.00 | |||
| 2025-08-05 | 13F | BEAM Asset Management, LLC | 22,996 | -6.38 | 3,895 | 3.54 | ||||
| 2025-05-15 | 13F | Citadel Advisors Llc | Call | 0 | -100.00 | 0 | -100.00 | |||
| 2025-07-21 | 13F | J. Safra Sarasin Holding AG | 15,869 | 2,688 | ||||||
| 2025-04-10 | 13F | Veracity Capital LLC | 0 | -100.00 | 0 | -100.00 | ||||
| 2025-04-29 | 13F | Truist Financial Corp | 0 | -100.00 | 0 | |||||
| 2025-07-15 | 13F | Pictet North America Advisors SA | 16,365 | -81.06 | 2,772 | -79.07 | ||||
| 2025-07-17 | 13F/A | Capital Investment Advisors, LLC | 10,073 | -11.13 | 1,706 | -1.73 | ||||
| 2025-08-12 | 13F | Global Retirement Partners, LLC | 1 | 0.00 | 0 | |||||
| 2025-08-01 | 13F | Brookwood Investment Group LLC | 1,662 | 0.73 | 281 | 11.51 | ||||
| 2025-08-13 | 13F | 1832 Asset Management L.P. | 1,995 | 338 | ||||||
| 2025-08-13 | 13F | Victory Capital Management Inc | 9,664 | 0.00 | 1,637 | 10.54 | ||||
| 2025-08-15 | 13F | Morgan Stanley | 875,450 | 52.61 | 148,284 | 68.75 | ||||
| 2025-07-22 | 13F | BridgePort Financial Solutions, LLC | 2,148 | 0.75 | 364 | 11.35 | ||||
| 2025-07-31 | 13F | PKO Investment Management Joint-Stock Co | 24,800 | 0.00 | 4,201 | 10.58 | ||||
| 2025-08-05 | 13F | Sheridan Capital Management, LLC | 16,621 | 0.00 | 2,815 | 10.57 | ||||
| 2025-08-13 | 13F | Renaissance Technologies Llc | 22,600 | 370.83 | 3,828 | 420.68 | ||||
| 2025-08-05 | 13F | Bank Of Montreal /can/ | 151,032 | -10.67 | 25,582 | -1.22 | ||||
| 2025-07-07 | 13F | Investors Research Corp | 396 | -27.47 | 67 | -19.28 | ||||
| 2025-08-05 | 13F | Obermeyer Wood Investment Counsel, Lllp | 341,698 | 57,877 | ||||||
| 2025-08-06 | 13F | Stone House Investment Management, LLC | 39 | 0.00 | 7 | 20.00 | ||||
| 2025-07-25 | 13F | Sequoia Financial Advisors, LLC | 22,262 | 29.36 | 3,771 | 43.02 | ||||
| 2025-08-04 | 13F | Mesirow Financial Investment Management, Inc. | 0 | -100.00 | 0 | |||||
| 2025-08-14 | 13F | Wells Fargo & Company/mn | 26,501 | -1.27 | 4,489 | 9.17 | ||||
| 2025-08-06 | 13F | Commonwealth Equity Services, Llc | 26,018 | -14.48 | 4 | 0.00 | ||||
| 2025-07-15 | 13F | Td Private Client Wealth Llc | 7,818 | -1.39 | 1,324 | 9.06 | ||||
| 2025-07-31 | 13F | Cambridge Investment Research Advisors, Inc. | 21,370 | 133.48 | 4 | 200.00 | ||||
| 2025-07-07 | 13F | RDA Financial Network | 2,361 | 1.29 | 400 | 11.76 | ||||
| 2025-08-12 | 13F | Proequities, Inc. | 0 | 0 |
Other Listings
| MX:URTH |