Mga Batayang Estadistika
| Pemilik Institusional | 167 total, 167 long only, 0 short only, 0 long/short - change of -2.34% MRQ |
| Alokasi Portofolio Rata-rata | 0.4834 % - change of -1.44% MRQ |
| Saham Institusional (Jangka Panjang) | 27,849,495 (ex 13D/G) - change of -1.61MM shares -5.47% MRQ |
| Nilai Institusional (Jangka Panjang) | $ 878,132 USD ($1000) |
Kepemilikan Institusional dan Pemegang Saham
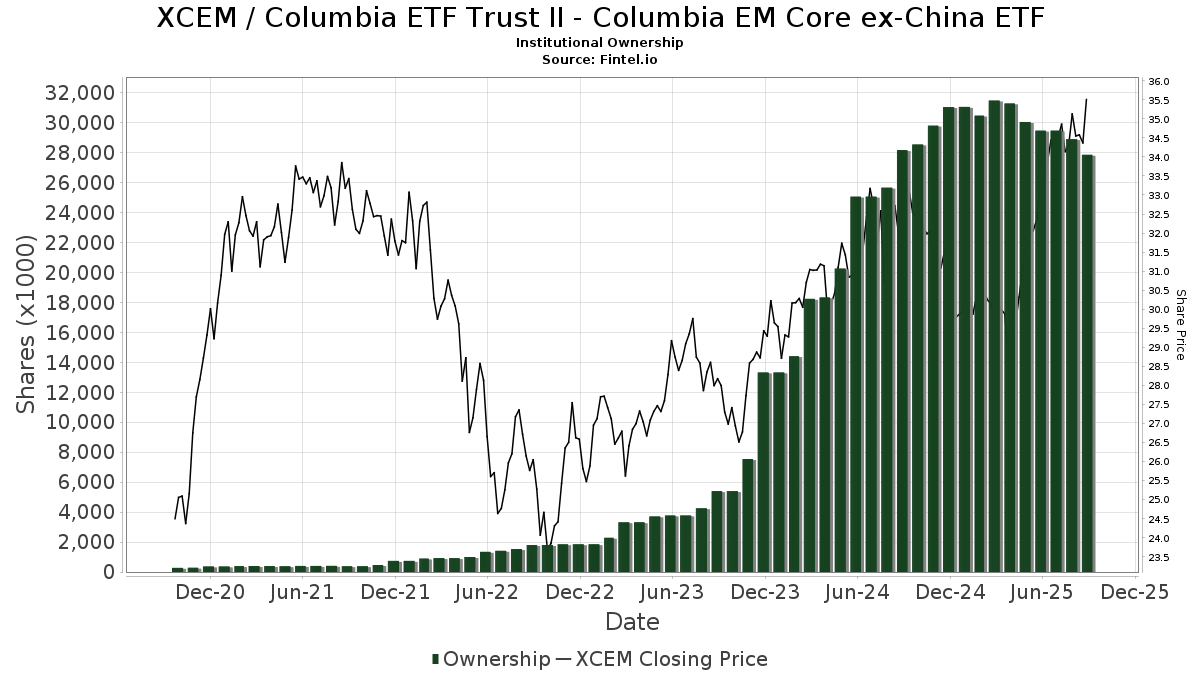
Columbia ETF Trust II - Columbia EM Core ex-China ETF (US:XCEM) memiliki 167 pemilik institusional dan pemegang saham yang telah mengajukan formulir 13D/G atau 13F kepada Komisi Bursa Efek (Securities Exchange Commission/SEC). Lembaga-lembaga ini memegang total 27,849,495 saham. Pemegang saham terbesar meliputi Morgan Stanley, Bank Of America Corp /de/, Northwestern Mutual Wealth Management Co, Penserra Capital Management LLC, LPL Financial LLC, TBFG - The Brinsmere Fund - Growth ETF, Marotta Asset Management, Raymond James Financial Inc, Flaharty Asset Management, LLC, and O'Brien Wealth Partners LLC .
Struktur kepemilikan institusional Columbia ETF Trust II - Columbia EM Core ex-China ETF (ARCA:XCEM) menunjukkan posisi terkini di perusahaan oleh institusi dan dana, serta perubahan terbaru dalam ukuran posisi. Pemegang saham utama dapat mencakup investor individu, reksa dana, dana lindung nilai, atau institusi. Jadwal 13D menunjukkan bahwa investor memegang (atau pernah memegang) lebih dari 5% saham perusahaan dan bermaksud (atau pernah bermaksud) untuk secara aktif mengejar perubahan strategi bisnis. Jadwal 13G menunjukkan investasi pasif lebih dari 5%.
The share price as of September 5, 2025 is 34.76 / share. Previously, on September 9, 2024, the share price was 31.79 / share. This represents an increase of 9.34% over that period.
Skor Sentimen Dana
Skor Sentimen Dana (sebelumnya dikenal sebagai Skor Akumulasi Kepemilikan) menemukan saham-saham yang paling banyak dibeli oleh dana. Ini adalah hasil dari model kuantitatif multi-faktor yang canggih yang mengidentifikasi perusahaan dengan tingkat akumulasi institusional tertinggi. Model penilaian menggunakan kombinasi dari total peningkatan pemilik yang diungkapkan, perubahan dalam alokasi portofolio pada pemilik tersebut, dan metrik lainnya. Angka berkisar dari 0 hingga 100, dengan angka yang lebih tinggi menunjukkan tingkat akumulasi yang lebih tinggi dibandingkan dengan perusahaan sejenisnya, dan 50 adalah rata-ratanya.
Frekuensi Pembaruan: Setiap Hari
Lihat Ownership Explorer, yang menyediakan daftar perusahaan dengan peringkat tertinggi.
Rasio Put/Call Institusional
Selain melaporkan isu ekuitas dan utang standar, institusi dengan aset di bawah manajemen lebih dari 100 juta dolar AS juga harus mengungkapkan kepemilikan opsi put dan call mereka. Karena opsi put umumnya menunjukkan sentimen negatif, dan opsi call menunjukkan sentimen positif, kita dapat mengetahui sentimen institusional secara keseluruhan dengan memplot rasio put terhadap call. Grafik di sebelah kanan memplot rasio put/call historis untuk instrumen ini.
Menggunakan Rasio Put/Call sebagai indikator sentimen investor mengatasi salah satu kekurangan utama dari penggunaan total kepemilikan institusional, yaitu sejumlah besar aset yang dikelola diinvestasikan secara pasif untuk melacak indeks. Dana yang dikelola secara pasif biasanya tidak membeli opsi, sehingga indikator rasio put/call lebih akurat dalam melacak sentimen dana yang dikelola secara aktif.
Pengajuan 13F dan NPORT
Detail pada pengajuan 13F tersedia gratis. Detail pada pengajuan NP memerlukan keanggotaan premium. Baris berwarna hijau menunjukkan posisi baru. Baris berwarna merah menunjukkan posisi yang sudah ditutup. Klik tautan ini ikon untuk melihat riwayat transaksi selengkapnya.
Tingkatkan
untuk membuka data premium dan mengekspor ke Excel ![]() .
.
| Tanggal File | Sumber | Investor | Ketik | Presyo ng Avg (Silangan) |
Saham | Δ Saham (%) |
Dilaporkan Nilai ($1000) |
Nilai Δ (%) |
Alokasi Port (%) |
|
|---|---|---|---|---|---|---|---|---|---|---|
| 2025-07-11 | 13F | Pinnacle Bancorp, Inc. | 1,816 | 0.00 | 62 | 16.98 | ||||
| 2025-08-14 | 13F | Royal Bank Of Canada | 6,636 | -85.46 | 227 | -83.16 | ||||
| 2025-08-13 | 13F | Northwestern Mutual Wealth Management Co | 1,604,767 | 192.92 | 54,851 | 239.00 | ||||
| 2025-08-14 | 13F | Jane Street Group, Llc | 229,428 | -52.61 | 7,842 | -45.16 | ||||
| 2025-04-25 | 13F | Avidian Wealth Solutions, LLC | 0 | -100.00 | 0 | |||||
| 2025-08-06 | 13F | O'Dell Group, LLC | 243,700 | -1.14 | 8,330 | 14.41 | ||||
| 2025-08-14 | 13F | Mml Investors Services, Llc | 7,418 | -19.99 | 0 | |||||
| 2025-07-25 | 13F | Retirement Planning Group, Llc / Ny | 12,893 | 2.14 | 441 | 18.28 | ||||
| 2025-07-08 | 13F | Richard P Slaughter Associates Inc | 190,789 | 5.06 | 6,521 | 21.59 | ||||
| 2025-08-08 | 13F | Avantax Advisory Services, Inc. | 12,908 | 13.02 | 441 | 30.86 | ||||
| 2025-07-30 | 13F | D.a. Davidson & Co. | 132,466 | -13.19 | 4,528 | 0.47 | ||||
| 2025-08-14 | 13F | Comerica Bank | 2,913 | -32.48 | 100 | -22.05 | ||||
| 2025-08-14 | 13F | Old Mission Capital Llc | 9,993 | -98.20 | 342 | -97.92 | ||||
| 2025-08-05 | 13F | Sigma Planning Corp | 30,484 | 28.80 | 1,042 | 48.93 | ||||
| 2025-07-22 | 13F | Belpointe Asset Management LLC | 45,048 | 1,540 | ||||||
| 2025-07-10 | 13F | Focus Financial Network, Inc. | 90,278 | 3.41 | 3,086 | 19.67 | ||||
| 2025-08-14 | 13F | Tennessee Valley Asset Management Partners | 0 | -100.00 | 0 | |||||
| 2025-08-14 | 13F/A | Rockefeller Capital Management L.P. | 66,318 | 22.31 | 2,267 | 41.54 | ||||
| 2025-08-06 | 13F | Commonwealth Equity Services, Llc | 571,374 | -10.39 | 20 | 5.56 | ||||
| 2025-08-14 | 13F | Graney & King, LLC | 1,087 | 0.00 | 37 | 15.63 | ||||
| 2025-08-05 | 13F | GPS Wealth Strategies Group, LLC | 20,294 | 22.50 | 694 | 41.72 | ||||
| 2025-08-12 | 13F | Main Management LLC | 125 | 0.00 | 0 | |||||
| 2025-04-30 | 13F | Ridgeline Wealth Planning, LLC | 0 | -100.00 | 0 | |||||
| 2025-08-13 | 13F | Vertex Planning Partners, LLC | 99,846 | -0.20 | 3,413 | 15.50 | ||||
| 2025-08-11 | 13F | Private Advisor Group, LLC | 149,448 | -9.14 | 5,108 | 5.17 | ||||
| 2025-08-19 | 13F | Advisory Services Network, LLC | 20,006 | -11.74 | 682 | 1.94 | ||||
| 2025-08-06 | 13F | Golden State Wealth Management, LLC | 816 | 0.00 | 28 | 12.50 | ||||
| 2025-07-17 | 13F | Halbert Hargrove Global Advisors, Llc | 5,136 | 176 | ||||||
| 2025-07-17 | 13F | KWB Wealth | 204,916 | -24.85 | 6,052 | -25.02 | ||||
| 2025-07-30 | 13F | Bogart Wealth, LLC | 900 | 0.00 | 31 | 15.38 | ||||
| 2025-07-24 | 13F | MA Private Wealth | 575,267 | -18.53 | 19,663 | -5.72 | ||||
| 2025-08-19 | 13F | National Asset Management, Inc. | 0 | -100.00 | 0 | |||||
| 2025-09-04 | 13F/A | Advisor Group Holdings, Inc. | 175,053 | -0.16 | 5,983 | 15.55 | ||||
| 2025-07-31 | 13F | CAP Partners, LLC | 0 | -100.00 | 0 | |||||
| 2025-08-11 | 13F | Advisor Resource Council | 0 | -100.00 | 0 | |||||
| 2025-08-01 | 13F | Koss-Olinger Consulting, LLC | 14,091 | -2.62 | 482 | 12.65 | ||||
| 2025-08-12 | 13F | SRS Capital Advisors, Inc. | 1,072 | -87.94 | 37 | -86.26 | ||||
| 2025-08-07 | 13F | McClarren Financial Advisors, Inc. | 0 | -100.00 | 0 | |||||
| 2025-07-23 | 13F | Watershed Private Wealth Llc | 80,351 | -48.94 | 2,746 | -40.91 | ||||
| 2025-07-29 | 13F | Private Trust Co Na | 610 | 46.99 | 21 | 66.67 | ||||
| 2025-08-14 | 13F | First Foundation Advisors | 246,547 | -21.43 | 8,427 | -9.09 | ||||
| 2025-08-11 | 13F | United Advisor Group, LLC | 55,478 | 19.14 | 1,896 | 37.89 | ||||
| 2025-08-13 | 13F | EverSource Wealth Advisors, LLC | 3,783 | 129 | ||||||
| 2025-08-26 | 13F/A | Thrivent Financial For Lutherans | 18,510 | 21.33 | 1 | |||||
| 2025-08-14 | 13F | Ameriprise Financial Inc | 291,840 | 468.84 | 9,975 | 557.98 | ||||
| 2025-08-14 | 13F | Syon Capital Llc | 451,576 | 8.92 | 15,435 | 26.04 | ||||
| 2025-08-12 | 13F | Planning Alternatives Ltd /adv | 324,394 | -0.54 | 11,088 | 15.09 | ||||
| 2025-07-29 | 13F | Activest Wealth Management | 0 | 0 | ||||||
| 2025-07-22 | 13F | Merit Financial Group, LLC | 36,694 | -15.21 | 1,254 | -1.88 | ||||
| 2025-07-24 | 13F | Eastern Bank | 53,748 | -12.03 | 1,837 | 1.83 | ||||
| 2025-07-25 | 13F | Northwest Capital Management Inc | 51,145 | -46.34 | 1,748 | -37.90 | ||||
| 2025-08-14 | 13F | Fmr Llc | 18,049 | -10.06 | 617 | 4.05 | ||||
| 2025-08-12 | 13F | Proequities, Inc. | 0 | 0 | ||||||
| 2025-08-08 | 13F | RAM Investment Partners, LLC | 0 | -100.00 | 0 | |||||
| 2025-08-25 | NP | IETFX - Morningstar Income and Growth ETF Asset Allocation Portfolio Class II | 14,930 | -10.30 | 510 | 3.87 | ||||
| 2025-08-25 | NP | BETFX - Morningstar Balanced ETF Asset Allocation Portfolio Class I | 75,025 | -28.97 | 2,564 | -17.79 | ||||
| 2025-04-24 | 13F | Wingate Wealth Advisors, Inc. | 0 | -100.00 | 0 | |||||
| 2025-08-18 | 13F | Arq Wealth Advisors, Llc | 132,419 | 0.00 | 3,911 | 0.00 | ||||
| 2025-07-25 | 13F | Gw Henssler & Associates Ltd | 14,800 | 0.00 | 506 | 15.56 | ||||
| 2025-08-14 | 13F | Susquehanna International Group, Llp | 25,467 | -91.49 | 870 | -90.15 | ||||
| 2025-07-21 | 13F | Fortis Capital Advisors, LLC | 45,048 | 1,540 | ||||||
| 2025-08-13 | 13F | Twin Peaks Wealth Advisors, LLC | 1,623 | 57 | ||||||
| 2025-08-12 | 13F | AlphaCore Capital LLC | 174,300 | 1.92 | 5,958 | 17.94 | ||||
| 2025-07-14 | 13F | Armstrong Advisory Group, Inc | 2,542 | 87 | ||||||
| 2025-08-11 | 13F | Aptus Capital Advisors, LLC | 165,093 | 3.04 | 5,643 | 19.23 | ||||
| 2025-07-16 | 13F | Pacific Sage Partners, LLC | 9,093 | 23.09 | 311 | 42.20 | ||||
| 2025-08-11 | 13F | Principal Securities, Inc. | 8,715 | 22.09 | 298 | 40.76 | ||||
| 2025-08-08 | 13F | New England Capital Financial Advisors LLC | 105,190 | 0.68 | 3,595 | 16.53 | ||||
| 2025-08-14 | 13F | GWM Advisors LLC | 43,625 | 7.13 | 1,491 | 24.04 | ||||
| 2025-08-14 | 13F | CoreCap Advisors, LLC | 34,365 | -2.55 | 1,174 | 12.78 | ||||
| 2025-07-31 | 13F | Leavell Investment Management, Inc. | 168,346 | 47.99 | 5,754 | 71.30 | ||||
| 2025-07-24 | 13F | McKinley Carter Wealth Services, Inc. | 233,358 | 112.56 | 7,976 | 146.02 | ||||
| 2025-07-15 | 13F | Highland Financial Advisors, LLC | 154,485 | -4.08 | 5,280 | 11.02 | ||||
| 2025-05-15 | 13F | Hrt Financial Lp | 0 | -100.00 | 0 | |||||
| 2025-07-15 | 13F | McAdam, LLC | 8,588 | -30.87 | 294 | -19.95 | ||||
| 2025-08-12 | 13F | Change Path, LLC | 21,147 | -2.76 | 723 | 12.46 | ||||
| 2025-07-09 | 13F | Krilogy Financial LLC | 123,229 | 2.12 | 4,212 | 18.15 | ||||
| 2025-08-05 | 13F | Mission Wealth Management, Lp | 7,431 | -4.08 | 254 | 10.96 | ||||
| 2025-08-01 | 13F | Envestnet Asset Management Inc | 95,127 | 172.95 | 3,251 | 215.94 | ||||
| 2025-08-05 | 13F | Telos Capital Management, Inc. | 21,058 | -6.54 | 720 | 8.12 | ||||
| 2025-08-06 | 13F | Nicholas Hoffman & Company, LLC. | 25,685 | 53.60 | 878 | 77.89 | ||||
| 2025-08-06 | 13F | Prospera Financial Services Inc | 80,028 | 3.04 | 2,735 | 19.28 | ||||
| 2025-08-13 | 13F | Legacy Capital Wealth Partners, LLC | 0 | -100.00 | 0 | |||||
| 2025-05-14 | 13F | Flow Traders U.s. Llc | 0 | -100.00 | 0 | |||||
| 2025-08-05 | 13F | Scarborough Advisors, LLC | 39,424 | 11.10 | 1,348 | 28.53 | ||||
| 2025-08-11 | 13F | Alps Advisors Inc | 410,990 | -32.74 | 14,048 | -22.16 | ||||
| 2025-04-30 | 13F | Valeo Financial Advisors, LLC | 0 | -100.00 | 0 | |||||
| 2025-05-12 | 13F | Quantinno Capital Management LP | 0 | -100.00 | 0 | |||||
| 2025-07-09 | 13F | O'Brien Wealth Partners LLC | 747,975 | 49.53 | 25,566 | 73.04 | ||||
| 2025-07-14 | 13F | U.S. Capital Wealth Advisors, LLC | 71,429 | -33.57 | 2,441 | -23.12 | ||||
| 2025-08-05 | 13F | Snider Financial Group | 15,564 | 8.92 | 532 | 25.83 | ||||
| 2025-08-14 | 13F | Diversify Advisory Services, LLC | 37,554 | 4.49 | 1,315 | 21.09 | ||||
| 2025-04-30 | 13F | Stonebrook Private Inc. | 0 | -100.00 | 0 | |||||
| 2025-08-14 | 13F | Principia Wealth Advisory, LLC | 84 | 0.00 | 3 | 0.00 | ||||
| 2025-07-09 | 13F | WealthCare Investment Partners, LLC | 66,231 | -26.63 | 2,301 | -12.18 | ||||
| 2025-08-14 | 13F | Bank Of America Corp /de/ | 2,817,275 | 1.62 | 96,294 | 17.61 | ||||
| 2025-08-04 | 13F | Amplius Wealth Advisors, LLC | 13,467 | -41.93 | 460 | -32.75 | ||||
| 2025-07-22 | 13F | Miracle Mile Advisors, LLC | 24,589 | -20.39 | 840 | -7.89 | ||||
| 2025-08-08 | 13F | Cetera Investment Advisers | 123,498 | 0.49 | 4,221 | 16.31 | ||||
| 2025-07-24 | 13F | IFP Advisors, Inc | 103 | 0.00 | 4 | 0.00 | ||||
| 2025-07-21 | 13F | Ameritas Advisory Services, LLC | 1,320 | 45 | ||||||
| 2025-08-14 | 13F | Redwood Financial Network Corp | 19,738 | 3.44 | 675 | 19.72 | ||||
| 2025-07-14 | 13F | Abound Wealth Management | 509 | 0.00 | 17 | 13.33 | ||||
| 2025-07-21 | 13F | DHJJ Financial Advisors, Ltd. | 34 | 0.00 | 1 | 0.00 | ||||
| 2025-08-05 | 13F | Sebold Capital Management, Inc. | 99,601 | -4.27 | 3,404 | 10.77 | ||||
| 2025-07-25 | 13F | ONE Advisory Partners, LLC | 10,842 | -92.43 | 378 | -91.08 | ||||
| 2025-07-31 | 13F | SoundView Advisors Inc. | 47,542 | 0.91 | 2 | 0.00 | ||||
| 2025-07-08 | 13F | Prism Advisors, Inc. | 553,088 | -30.31 | 18,905 | -19.35 | ||||
| 2025-07-17 | 13F | Janney Montgomery Scott LLC | 76,118 | -3.68 | 3 | 0.00 | ||||
| 2025-08-13 | 13F | Alerus Financial Na | 1,337 | 46 | ||||||
| 2025-08-12 | 13F | Gladstone Institutional Advisory LLC | 126,097 | 17.66 | 4,310 | 36.18 | ||||
| 2025-08-08 | 13F | Flaharty Asset Management, LLC | 789,437 | 1.22 | 26,983 | 17.13 | ||||
| 2025-07-22 | 13F | Wealthcare Advisory Partners LLC | 191,962 | 2.93 | 6,561 | 19.12 | ||||
| 2025-08-12 | 13F | CIBC Private Wealth Group, LLC | 19,277 | -0.65 | 659 | 27.27 | ||||
| 2025-08-14 | 13F | Atomi Financial Group, Inc. | 8,801 | 301 | ||||||
| 2025-08-25 | NP | GETFX - Morningstar Growth ETF Asset Allocation Portfolio Class I | 164,755 | -37.85 | 5,631 | -28.07 | ||||
| 2025-07-11 | 13F | Farther Finance Advisors, LLC | 22,425 | -79.85 | 766 | -76.89 | ||||
| 2025-07-28 | 13F | Kiker Wealth Management, LLC | 0 | -100.00 | 0 | |||||
| 2025-08-11 | 13F | Citigroup Inc | 4,753 | 162 | ||||||
| 2025-08-12 | 13F | Quadcap Wealth Management, LLC | 58,138 | 4.15 | 1,987 | 20.57 | ||||
| 2025-05-05 | 13F | Jackson Creek Investment Advisors LLC | 0 | -100.00 | 0 | |||||
| 2025-07-14 | 13F | LaFleur & Godfrey LLC | 12,867 | -0.73 | 440 | 14.92 | ||||
| 2025-07-23 | 13F | Heck Capital Advisors, LLC | 0 | -100.00 | 0 | |||||
| 2025-04-28 | 13F | Redmont Wealth Advisors Llc | 18,896 | 0.00 | 558 | -0.18 | ||||
| 2025-07-14 | 13F | Buttonwood Financial Group, LLC | 0 | -100.00 | 0 | |||||
| 2025-07-28 | 13F | RFG Advisory, LLC | 15,685 | 536 | ||||||
| 2025-08-05 | 13F | Westside Investment Management, Inc. | 4,724 | 1.40 | 161 | 17.52 | ||||
| 2025-08-14 | 13F | Goldman Sachs Group Inc | 0 | -100.00 | 0 | |||||
| 2025-08-14 | 13F | Guardian Wealth Advisors, Llc / Nc | 165,093 | 3.04 | 5,643 | 19.23 | ||||
| 2025-07-18 | 13F | BSW Wealth Partners | 8,278 | 5.29 | 283 | 21.55 | ||||
| 2025-08-25 | NP | AGTFX - Morningstar Aggressive Growth ETF Asset Allocation Portfolio Class I | 156,280 | -30.13 | 5,342 | -19.15 | ||||
| 2025-08-11 | 13F | Greykasell Wealth Strategies, Inc. | 0 | -100.00 | 0 | |||||
| 2025-07-25 | 13F | Cwm, Llc | 54,532 | -42.79 | 2 | -50.00 | ||||
| 2025-07-31 | 13F | Cambridge Investment Research Advisors, Inc. | 9,904 | 1.90 | 0 | |||||
| 2025-07-09 | 13F | Brand Asset Management Group, Inc. | 21,904 | 0.00 | 749 | 15.79 | ||||
| 2025-08-06 | 13F | Stone House Investment Management, LLC | 660 | -91.01 | 23 | -89.81 | ||||
| 2025-08-14 | 13F | Oxford Financial Group Ltd | 17,175 | 0.00 | 587 | 15.78 | ||||
| 2025-07-08 | 13F | First National Corp /ma/ /adv | 98,857 | 3.02 | 3,379 | 19.20 | ||||
| 2025-08-12 | 13F | Jpmorgan Chase & Co | 27,362 | -89.12 | 935 | -87.42 | ||||
| 2025-07-08 | 13F | Ehrlich Financial Group | 8,150 | -92.08 | 279 | -90.85 | ||||
| 2025-07-10 | 13F | Fortress Wealth Management, Inc. | 8,142 | -52.70 | 278 | -45.28 | ||||
| 2025-08-04 | 13F | Savvy Advisors, Inc. | 236,697 | -2.04 | 8,090 | 13.37 | ||||
| 2025-08-07 | 13F | Legacy Financial Advisors, Inc. | 34,455 | 127.98 | 1,178 | 163.90 | ||||
| 2025-08-15 | 13F | Kestra Advisory Services, LLC | 54,742 | 39.95 | 1,871 | 61.99 | ||||
| 2025-08-14 | 13F | McIlrath & Eck, LLC | 18,168 | 525.62 | 621 | 629.41 | ||||
| 2025-08-14 | 13F | Raymond James Financial Inc | 856,800 | -1.78 | 29,285 | 13.66 | ||||
| 2025-07-30 | 13F | Exencial Wealth Advisors, Llc | 79,226 | -2.64 | 2,708 | 12.65 | ||||
| 2025-07-16 | 13F | MKT Advisors LLC | 0 | -100.00 | 0 | |||||
| 2025-08-14 | 13F | Qube Research & Technologies Ltd | 7,942 | 10.97 | 271 | 28.44 | ||||
| 2025-08-26 | NP | TBFC - The Brinsmere Fund - Conservative ETF | 375,720 | 6.74 | 12,842 | 23.53 | ||||
| 2025-08-11 | 13F | Tidemark, LLC | 108 | -54.62 | 4 | -57.14 | ||||
| 2025-08-07 | 13F | CENTRAL TRUST Co | 306,581 | 1.31 | 10,479 | 17.24 | ||||
| 2025-07-07 | 13F | Centurion Wealth Management LLC | 0 | -100.00 | 0 | |||||
| 2025-07-17 | 13F | Beacon Capital Management, LLC | 0 | -100.00 | 0 | |||||
| 2025-08-07 | 13F | Hennion & Walsh Asset Management, Inc. | 649,375 | 1.18 | 22,196 | 17.09 | ||||
| 2025-07-17 | 13F | Coastline Trust Co | 31,276 | -3.59 | 1,069 | 11.59 | ||||
| 2025-08-12 | 13F | LPL Financial LLC | 989,110 | -20.44 | 33,808 | -7.93 | ||||
| 2025-08-12 | 13F | Atlas Capital Advisors Llc | 3,639 | 0.00 | 124 | 15.89 | ||||
| 2025-07-09 | 13F | Breakwater Capital Group | 183,340 | -11.39 | 6,267 | 2.55 | ||||
| 2025-08-14 | 13F | UBS Group AG | 481,609 | -5.36 | 16,461 | 9.53 | ||||
| 2025-08-05 | 13F | Sheridan Capital Management, LLC | 0 | -100.00 | 0 | |||||
| 2025-08-14 | 13F | Citadel Advisors Llc | 6,670 | -50.38 | 228 | -42.82 | ||||
| 2025-07-23 | 13F | Nelson Capital Management, LLC | 145,076 | 4,959 | ||||||
| 2025-08-14 | 13F | Colony Group, LLC | 186,594 | 5.28 | 6,378 | 21.84 | ||||
| 2025-08-06 | 13F | Penserra Capital Management LLC | 1,319,497 | 52.29 | 45 | 80.00 | ||||
| 2025-07-30 | 13F | Bleakley Financial Group, LLC | 162,735 | 7.90 | 5,562 | 24.88 | ||||
| 2025-04-14 | 13F | Strategic Wealth Designers | 0 | -100.00 | 0 | -100.00 | ||||
| 2025-08-08 | 13F | Gts Securities Llc | 16,185 | 553 | ||||||
| 2025-07-18 | 13F | Pure Financial Advisors, Inc. | 11,058 | -5.95 | 378 | 8.65 | ||||
| 2025-08-07 | 13F | WESCAP Management Group, Inc. | 7,947 | 272 | ||||||
| 2025-08-13 | 13F | Brown Advisory Inc | 17,514 | 0.00 | 599 | 15.67 | ||||
| 2025-08-13 | 13F | Cerity Partners LLC | 449,478 | -4.83 | 15,363 | 10.14 | ||||
| 2025-08-07 | 13F | Allworth Financial LP | 1,264 | 0.00 | 43 | 16.22 | ||||
| 2025-05-13 | 13F | Skopos Labs, Inc. | 0 | -100.00 | 0 | |||||
| 2025-08-14 | 13F | Wells Fargo & Company/mn | 55,107 | 23.70 | 1,884 | 43.19 | ||||
| 2025-08-11 | 13F | HighTower Advisors, LLC | 197,700 | -3.71 | 6,757 | 11.43 | ||||
| 2025-07-02 | 13F | Marotta Asset Management | 876,654 | 0.98 | 29,964 | 5.66 | ||||
| 2025-07-28 | 13F | Cypress Wealth Services, LLC | 33,109 | -81.21 | 1,132 | -78.26 | ||||
| 2025-08-11 | 13F | Managed Asset Portfolios, Llc | 19,303 | 14.03 | 660 | 32.06 | ||||
| 2025-07-17 | 13F | Nelson, Van Denburg & Campbell Wealth Management Group, LLC | 6,414 | 219 | ||||||
| 2025-08-14 | 13F | Partners Capital Investment Group, Llp | 406,326 | -27.39 | 13,888 | -15.97 | ||||
| 2025-04-22 | 13F | Petra Financial Advisors Inc | 0 | -100.00 | 0 | |||||
| 2025-07-28 | 13F | Harbour Investments, Inc. | 999 | 7.19 | 34 | 25.93 | ||||
| 2025-07-23 | 13F | Financial Life Advisors | 127,507 | 2.78 | 4,358 | 18.94 | ||||
| 2025-08-08 | 13F | Smithfield Trust Co | 6,475 | 16.14 | 0 | |||||
| 2025-07-31 | 13F | Mason & Associates Inc | 90,514 | 2.87 | 3,094 | 19.05 | ||||
| 2025-08-14 | 13F | Stifel Financial Corp | 177,693 | 32.79 | 6,074 | 53.67 | ||||
| 2025-08-26 | NP | TBFG - The Brinsmere Fund - Growth ETF | 943,777 | 83.45 | 32,258 | 112.31 | ||||
| 2025-07-10 | 13F | CWC Advisors, LLC. | 28,898 | 8.05 | 988 | 25.10 | ||||
| 2025-08-08 | 13F | Creative Planning | 89,987 | -0.35 | 3,076 | 15.30 | ||||
| 2025-08-08 | 13F | Larson Financial Group LLC | 6,111 | -11.73 | 209 | 1.96 | ||||
| 2025-07-25 | 13F | Total Clarity Wealth Management, Inc. | 116,885 | 586.87 | 3,995 | 694.23 | ||||
| 2025-08-14 | 13F | Mariner, LLC | 17,264 | -88.21 | 590 | -86.36 | ||||
| 2025-08-15 | 13F | Morgan Stanley | 2,841,783 | -19.53 | 97,132 | -6.87 | ||||
| 2025-08-12 | 13F | MAI Capital Management | 1,751 | -19.31 | 60 | -7.81 | ||||
| 2025-08-13 | 13F | Cresset Asset Management, LLC | 22,393 | 0.00 | 765 | 15.73 | ||||
| 2025-07-29 | 13F | Smithbridge Asset Management Inc/de | 6,845 | -5.36 | 234 | 9.39 |