Mga Batayang Estadistika
| Pemilik Institusional | 157 total, 157 long only, 0 short only, 0 long/short - change of 12.14% MRQ |
| Alokasi Portofolio Rata-rata | 0.1090 % - change of 1.08% MRQ |
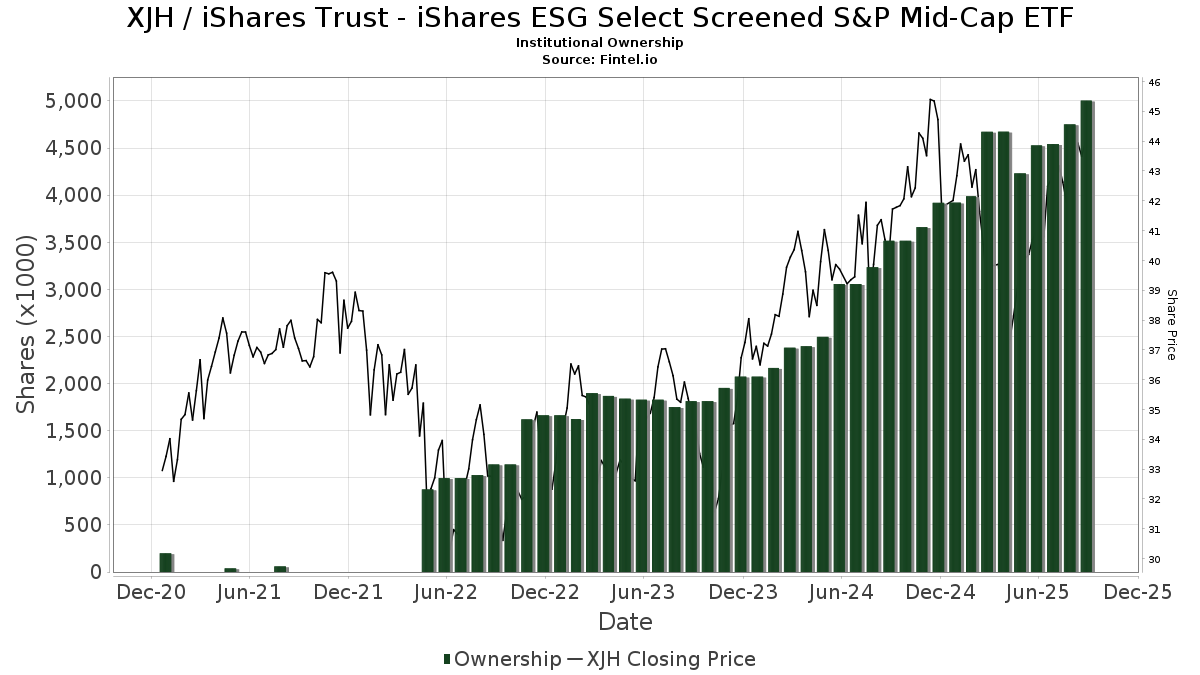
| Saham Institusional (Jangka Panjang) | 5,004,450 (ex 13D/G) - change of 0.47MM shares 10.49% MRQ |
| Nilai Institusional (Jangka Panjang) | $ 197,580 USD ($1000) |
Kepemilikan Institusional dan Pemegang Saham
iShares Trust - iShares ESG Select Screened S&P Mid-Cap ETF (US:XJH) memiliki 157 pemilik institusional dan pemegang saham yang telah mengajukan formulir 13D/G atau 13F kepada Komisi Bursa Efek (Securities Exchange Commission/SEC). Lembaga-lembaga ini memegang total 5,004,450 saham. Pemegang saham terbesar meliputi Bank Of America Corp /de/, Raymond James Financial Inc, Eastern Bank, Mariner, LLC, LPL Financial LLC, Bailard, Inc., Shira Ridge Wealth Management, Litman Gregory Asset Management LLC, Miracle Mile Advisors, LLC, and Koss-Olinger Consulting, LLC .
Struktur kepemilikan institusional iShares Trust - iShares ESG Select Screened S&P Mid-Cap ETF (BATS:XJH) menunjukkan posisi terkini di perusahaan oleh institusi dan dana, serta perubahan terbaru dalam ukuran posisi. Pemegang saham utama dapat mencakup investor individu, reksa dana, dana lindung nilai, atau institusi. Jadwal 13D menunjukkan bahwa investor memegang (atau pernah memegang) lebih dari 5% saham perusahaan dan bermaksud (atau pernah bermaksud) untuk secara aktif mengejar perubahan strategi bisnis. Jadwal 13G menunjukkan investasi pasif lebih dari 5%.
The share price as of September 5, 2025 is 44.55 / share. Previously, on September 9, 2024, the share price was 40.01 / share. This represents an increase of 11.36% over that period.
Skor Sentimen Dana
Skor Sentimen Dana (sebelumnya dikenal sebagai Skor Akumulasi Kepemilikan) menemukan saham-saham yang paling banyak dibeli oleh dana. Ini adalah hasil dari model kuantitatif multi-faktor yang canggih yang mengidentifikasi perusahaan dengan tingkat akumulasi institusional tertinggi. Model penilaian menggunakan kombinasi dari total peningkatan pemilik yang diungkapkan, perubahan dalam alokasi portofolio pada pemilik tersebut, dan metrik lainnya. Angka berkisar dari 0 hingga 100, dengan angka yang lebih tinggi menunjukkan tingkat akumulasi yang lebih tinggi dibandingkan dengan perusahaan sejenisnya, dan 50 adalah rata-ratanya.
Frekuensi Pembaruan: Setiap Hari
Lihat Ownership Explorer, yang menyediakan daftar perusahaan dengan peringkat tertinggi.
Rasio Put/Call Institusional
Selain melaporkan isu ekuitas dan utang standar, institusi dengan aset di bawah manajemen lebih dari 100 juta dolar AS juga harus mengungkapkan kepemilikan opsi put dan call mereka. Karena opsi put umumnya menunjukkan sentimen negatif, dan opsi call menunjukkan sentimen positif, kita dapat mengetahui sentimen institusional secara keseluruhan dengan memplot rasio put terhadap call. Grafik di sebelah kanan memplot rasio put/call historis untuk instrumen ini.
Menggunakan Rasio Put/Call sebagai indikator sentimen investor mengatasi salah satu kekurangan utama dari penggunaan total kepemilikan institusional, yaitu sejumlah besar aset yang dikelola diinvestasikan secara pasif untuk melacak indeks. Dana yang dikelola secara pasif biasanya tidak membeli opsi, sehingga indikator rasio put/call lebih akurat dalam melacak sentimen dana yang dikelola secara aktif.
Pengajuan 13F dan NPORT
Detail pada pengajuan 13F tersedia gratis. Detail pada pengajuan NP memerlukan keanggotaan premium. Baris berwarna hijau menunjukkan posisi baru. Baris berwarna merah menunjukkan posisi yang sudah ditutup. Klik tautan ini ikon untuk melihat riwayat transaksi selengkapnya.
Tingkatkan
untuk membuka data premium dan mengekspor ke Excel ![]() .
.
| Tanggal File | Sumber | Investor | Ketik | Presyo ng Avg (Silangan) |
Saham | Δ Saham (%) |
Dilaporkan Nilai ($1000) |
Nilai Δ (%) |
Alokasi Port (%) |
|
|---|---|---|---|---|---|---|---|---|---|---|
| 2025-08-12 | 13F | Deutsche Bank Ag\ | 1,175 | 571.43 | 49 | 700.00 | ||||
| 2025-07-21 | 13F | Cape Ann Savings Bank | 6,039 | 1.68 | 251 | 7.76 | ||||
| 2025-08-01 | 13F | Biltmore Family Office, LLC | 31,248 | 0.00 | 1,297 | 6.23 | ||||
| 2025-04-21 | 13F | Nelson, Van Denburg & Campbell Wealth Management Group, LLC | 0 | -100.00 | 0 | |||||
| 2025-08-05 | 13F | GHP Investment Advisors, Inc. | 678 | 0.30 | 28 | 7.69 | ||||
| 2025-07-09 | 13F | Massmutual Trust Co Fsb/adv | 20,485 | -6.50 | 850 | -0.70 | ||||
| 2025-08-12 | 13F | Nemes Rush Group LLC | 1,305 | 0.31 | 54 | 8.00 | ||||
| 2025-08-13 | 13F | Parkworth Wealth Management, Inc. | 2,594 | 0.31 | 108 | 5.94 | ||||
| 2025-07-18 | 13F | Truist Financial Corp | 9,922 | 3.74 | 412 | 10.19 | ||||
| 2025-07-23 | 13F | Optas, LLC | 14,320 | 4.10 | 594 | 10.61 | ||||
| 2025-07-25 | 13F | Cwm, Llc | 1,762 | 0.00 | 0 | |||||
| 2025-07-29 | 13F | Harbor Asset Planning, Inc. | 823 | 34 | ||||||
| 2025-07-28 | 13F | Harbour Investments, Inc. | 26,886 | 38.62 | 1,116 | 47.29 | ||||
| 2025-08-14 | 13F | Jane Street Group, Llc | 12,245 | 508 | ||||||
| 2025-08-08 | 13F | Good Life Advisors, LLC | 10,046 | 2.85 | 417 | 9.19 | ||||
| 2025-08-19 | 13F | Advisory Services Network, LLC | 78,934 | -9.05 | 3,329 | -1.80 | ||||
| 2025-07-29 | 13F | Signature Estate & Investment Advisors Llc | 5,147 | 214 | ||||||
| 2025-08-07 | 13F | Allworth Financial LP | 123 | 0.82 | 5 | 25.00 | ||||
| 2025-07-29 | 13F | Novare Capital Management Llc | 8,712 | 362 | ||||||
| 2025-07-31 | 13F/A | Avion Wealth | 36 | 0.00 | 0 | |||||
| 2025-08-14 | 13F | Goldman Sachs Group Inc | 30,818 | 0.00 | 1,279 | 6.15 | ||||
| 2025-08-11 | 13F | Aptus Capital Advisors, LLC | 18,579 | 133.11 | 771 | 147.91 | ||||
| 2025-08-14 | 13F | Susquehanna International Group, Llp | 13,867 | 126.22 | 575 | 140.59 | ||||
| 2025-08-11 | 13F | Principal Securities, Inc. | 64 | 20.75 | 3 | 0.00 | ||||
| 2025-08-12 | 13F | Eley Financial Management, Inc | 19,501 | -1.25 | 809 | 4.39 | ||||
| 2025-07-24 | 13F | JNBA Financial Advisors | 81,126 | -6.09 | 3,367 | -0.27 | ||||
| 2025-05-02 | 13F | Napatree Capital Llc | 8,991 | 1.79 | 351 | -4.88 | ||||
| 2025-07-29 | 13F | Stratos Wealth Partners, LTD. | 14,515 | -4.94 | 602 | 1.01 | ||||
| 2025-07-24 | 13F | McKinley Carter Wealth Services, Inc. | 22,844 | -3.58 | 948 | 2.49 | ||||
| 2025-08-06 | 13F | Commonwealth Equity Services, Llc | 63,237 | -7.88 | 3 | 0.00 | ||||
| 2025-04-14 | 13F | Regatta Capital Group, Llc | 0 | -100.00 | 0 | |||||
| 2025-07-21 | 13F | Ameritas Advisory Services, LLC | 80 | 3 | ||||||
| 2025-08-08 | 13F | Creative Planning | 12,589 | 11.77 | 522 | 18.64 | ||||
| 2025-08-11 | 13F | Bradley Foster & Sargent Inc/ct | 8,991 | 373 | ||||||
| 2025-08-01 | 13F | Fort Vancouver Investment Management, LLC | 773 | 6.77 | 32 | 14.29 | ||||
| 2025-07-11 | 13F | Hilltop Wealth Advisors, Llc | 44,254 | 2.80 | 1,837 | 9.22 | ||||
| 2025-08-08 | 13F | Larson Financial Group LLC | 2,540 | 0.99 | 105 | 7.14 | ||||
| 2025-07-29 | 13F | Chicago Partners Investment Group LLC | 8,420 | -2.14 | 364 | 8.36 | ||||
| 2025-07-29 | 13F | Crux Wealth Advisors | 4,865 | -82.25 | 202 | -81.21 | ||||
| 2025-08-08 | 13F | Francis Financial, Inc. | 56,138 | -40.83 | 2,330 | -37.16 | ||||
| 2025-08-13 | 13F | SageView Advisory Group, LLC | 23,095 | 14.34 | 994 | 25.86 | ||||
| 2025-08-11 | 13F | Atlantic Private Wealth, LLC | 15,450 | 0.05 | 641 | 6.30 | ||||
| 2025-07-16 | 13F | Magnus Financial Group LLC | 12,392 | 0.30 | 514 | 6.64 | ||||
| 2025-08-12 | 13F | Proequities, Inc. | 0 | 0 | ||||||
| 2025-07-30 | 13F | Caliber Wealth Management, LLC / KS | 20,394 | 846 | ||||||
| 2025-08-15 | 13F | WFA of San Diego, LLC | 791 | 0.00 | 33 | -3.03 | ||||
| 2025-08-01 | 13F | Envestnet Asset Management Inc | 28,772 | -7.87 | 1,194 | -2.13 | ||||
| 2025-08-13 | 13F | Milestone Investment Advisors LLC | 120 | 0.00 | 5 | 0.00 | ||||
| 2025-08-12 | 13F | Marshall & Sterling Wealth Advisors Inc. | 5,733 | -11.92 | 237 | -6.69 | ||||
| 2025-07-18 | 13F | First United Bank Trust/ | 5,925 | -39.11 | 246 | -35.53 | ||||
| 2025-07-29 | 13F | Stordahl Capital Management, Inc. | 11,724 | 37.59 | 487 | 46.39 | ||||
| 2025-07-11 | 13F | Capital Advantage, Inc. | 0 | -100.00 | 0 | |||||
| 2025-08-14 | 13F | Mercer Global Advisors Inc /adv | 0 | -100.00 | 0 | |||||
| 2025-07-15 | 13F | RTD Financial Advisors, Inc. | 30,794 | 4.07 | 1,278 | 10.47 | ||||
| 2025-08-08 | 13F | Bailard, Inc. | 213,721 | -0.97 | 8,869 | 5.20 | ||||
| 2025-08-07 | 13F | Weil Company, Inc. | 9,234 | 48.39 | 383 | 57.61 | ||||
| 2025-07-23 | 13F | Litman Gregory Asset Management LLC | 136,908 | 10.46 | 5,682 | 17.33 | ||||
| 2025-08-18 | 13F/A | National Bank Of Canada /fi/ | 160 | 0.00 | 7 | 0.00 | ||||
| 2025-07-25 | 13F | Wells Financial Advisors INC | 800 | 0.00 | 33 | 6.45 | ||||
| 2025-07-22 | 13F | Mascoma Wealth Management LLC | 1,994 | -6.87 | 83 | -1.20 | ||||
| 2025-08-04 | 13F | Pensionmark Financial Group, Llc | 68,178 | -10.49 | 2,829 | -4.91 | ||||
| 2025-07-15 | 13F | Carr Financial Group Corp | 0 | -100.00 | 0 | |||||
| 2025-07-18 | 13F | Rogco, Lp | 4,921 | 0.20 | 204 | 6.81 | ||||
| 2025-07-22 | 13F | Sage Financial Group Inc | 30,014 | 8.53 | 1,246 | 15.28 | ||||
| 2025-07-25 | 13F | Pathway Financial Advisors LLC | 10,559 | 0.00 | 438 | 6.31 | ||||
| 2025-07-23 | 13F | 1 North Wealth Services Llc | 245 | 0.00 | 10 | 11.11 | ||||
| 2025-07-10 | 13F | Mogy Joel R Investment Counsel Inc | 3,000 | 0.00 | 124 | 5.98 | ||||
| 2025-07-11 | 13F | Caldwell Securities, Inc | 991 | 0.00 | 41 | 7.89 | ||||
| 2025-07-31 | 13F | Opes Wealth Management LLC | 39,062 | 14.79 | 1,621 | 21.97 | ||||
| 2025-08-14 | 13F | Mml Investors Services, Llc | 6,037 | -30.82 | 0 | |||||
| 2025-08-04 | 13F | BLB&B Advisors, LLC | 11,866 | 6.51 | 492 | 13.10 | ||||
| 2025-08-14 | 13F | Citadel Advisors Llc | 46,848 | 1,944 | ||||||
| 2025-07-23 | 13F | Dohj, Llc | 86,289 | 43.13 | 3,222 | 36.82 | ||||
| 2025-08-11 | 13F | Pin Oak Investment Advisors Inc | 94 | 0.00 | 0 | |||||
| 2025-08-13 | 13F | Fortress Financial Solutions, LLC | 6,223 | 258 | ||||||
| 2025-09-04 | 13F/A | Advisor Group Holdings, Inc. | 37,055 | 6.00 | 1,538 | 12.59 | ||||
| 2025-08-14 | 13F | Balanced Rock Investment Advisor | 30,961 | -17.27 | 1,285 | -12.18 | ||||
| 2025-08-13 | 13F | Cary Street Partners Financial Llc | 75,097 | 1.22 | 3,117 | 7.52 | ||||
| 2025-07-15 | 13F | RVW Wealth, LLC | 13,694 | -23.93 | 568 | -19.20 | ||||
| 2025-08-04 | 13F | Assetmark, Inc | 37 | 0.00 | 2 | 0.00 | ||||
| 2025-08-11 | 13F | HighTower Advisors, LLC | 29,120 | 3.01 | 1,208 | 9.42 | ||||
| 2025-08-11 | 13F | Beta Wealth Group, Inc. | 14,491 | 601 | ||||||
| 2025-07-24 | 13F | IFP Advisors, Inc | 272 | 17.75 | 11 | 22.22 | ||||
| 2025-08-14 | 13F | Royal Bank Of Canada | 21,096 | -41.65 | 876 | -38.00 | ||||
| 2025-07-18 | 13F | Bartlett & Co. Wealth Management Llc | 965 | 0.00 | 40 | 8.11 | ||||
| 2025-08-13 | 13F | Capital Analysts, Inc. | 10,723 | -0.76 | 0 | |||||
| 2025-08-01 | 13F | Redwood Park Advisors LLC | 210 | 0.48 | 9 | 0.00 | ||||
| 2025-08-11 | 13F | MainStreet Investment Advisors LLC | 20,710 | -6.44 | 859 | -0.58 | ||||
| 2025-08-19 | 13F | Asset Dedication, LLC | 3,690 | 158.95 | 153 | 178.18 | ||||
| 2025-08-07 | 13F | Addison Advisors LLC | 700 | 0.00 | 29 | 7.41 | ||||
| 2025-08-11 | 13F | Birchbrook, Inc. | 19,585 | 40.84 | 813 | 49.54 | ||||
| 2025-08-08 | 13F | Smithfield Trust Co | 857 | 0.00 | 0 | |||||
| 2025-07-08 | 13F | First National Corp /ma/ /adv | 6,475 | 5.23 | 269 | 11.67 | ||||
| 2025-07-21 | 13F | Impact Investors, Inc | 6,821 | 0.98 | 283 | 7.60 | ||||
| 2025-07-23 | 13F | Sax Wealth Advisors, Llc | 6,334 | 0.00 | 263 | 6.07 | ||||
| 2025-08-14 | 13F | Bank Of America Corp /de/ | 588,393 | 9.85 | 24,418 | 16.69 | ||||
| 2025-08-11 | 13F | CBIZ Investment Advisory Services, LLC | 24 | 4.35 | 1 | |||||
| 2025-08-11 | 13F | Ritter Daniher Financial Advisory LLC / DE | 1,600 | 0.00 | 66 | 6.45 | ||||
| 2025-07-10 | 13F | Wealth Enhancement Advisory Services, Llc | 15,771 | -15.09 | 673 | -7.17 | ||||
| 2025-08-14 | 13F | McIlrath & Eck, LLC | 1,083 | 0.00 | 45 | 4.76 | ||||
| 2025-08-11 | 13F | Amara Financial, Llc. | 8,177 | -15.92 | 339 | -10.55 | ||||
| 2025-07-14 | 13F | Sound Stewardship, LLC | 5,301 | 220 | ||||||
| 2025-08-11 | 13F | Estate Counselors, LLC | 7,390 | 307 | ||||||
| 2025-08-11 | 13F | Private Advisor Group, LLC | 29,450 | -20.18 | 1,222 | -15.20 | ||||
| 2025-05-14 | 13F | Oarsman Capital, Inc. | 0 | -100.00 | 0 | |||||
| 2025-08-12 | 13F | Steward Partners Investment Advisory, Llc | 30,771 | 2.26 | 1,277 | 8.60 | ||||
| 2025-08-26 | 13F/A | Thrivent Financial For Lutherans | 97,066 | 4 | ||||||
| 2025-07-14 | 13F | Armstrong Advisory Group, Inc | 1,159 | 15.21 | 48 | 14.29 | ||||
| 2025-07-18 | 13F | Cantor Fitzgerald Investment Adviser L.p. | 6,872 | -1.09 | 285 | 5.17 | ||||
| 2025-08-12 | 13F | SRS Capital Advisors, Inc. | 2,640 | -47.29 | 110 | -44.10 | ||||
| 2025-07-23 | 13F | Arcadia Investment Advisors Llc | 2,816 | 1.15 | 117 | 7.41 | ||||
| 2025-08-12 | 13F | MAI Capital Management | 7,243 | 3.58 | 301 | 9.89 | ||||
| 2025-08-08 | 13F | Better Money Decisions, LLC | 21,743 | 4.07 | 902 | 10.54 | ||||
| 2025-07-25 | 13F | Stephens Consulting, LLC | 3,099 | -2.36 | 129 | 3.23 | ||||
| 2025-05-07 | 13F | JSF Financial, LLC | 0 | -100.00 | 0 | |||||
| 2025-08-12 | 13F | Coldstream Capital Management Inc | 24,806 | -24.66 | 1,029 | -19.98 | ||||
| 2025-07-30 | 13F | Whittier Trust Co Of Nevada Inc | 710 | 0.00 | 29 | 7.41 | ||||
| 2025-08-05 | 13F | Key FInancial Inc | 330 | 0.00 | 14 | 8.33 | ||||
| 2025-07-10 | 13F | Shira Ridge Wealth Management | 141,548 | 4.13 | 5,874 | 10.62 | ||||
| 2025-07-21 | 13F | Financial Council Asset Management Inc | 5,313 | 0.08 | 220 | 6.28 | ||||
| 2025-08-13 | 13F | Baird Financial Group, Inc. | 13,843 | 0.00 | 574 | 6.30 | ||||
| 2025-07-25 | 13F | Wealth Advisory Team LLC | 17,010 | 706 | ||||||
| 2025-08-01 | 13F | Bessemer Group Inc | 21,985 | 1 | ||||||
| 2025-08-14 | 13F | Mariner, LLC | 286,555 | 13.45 | 11,892 | 20.51 | ||||
| 2025-08-14 | 13F | Colony Group, LLC | 17,940 | 47.50 | 745 | 56.63 | ||||
| 2025-07-23 | 13F | Armbruster Capital Management, Inc. | 8,175 | 6.51 | 339 | 13.38 | ||||
| 2025-08-14 | 13F | Raymond James Financial Inc | 534,644 | 1.07 | 22,188 | 7.36 | ||||
| 2025-07-25 | NP | MIDE - Xtrackers S&P MidCap 400 ESG ETF | 850 | -22.73 | 34 | -24.44 | ||||
| 2025-07-10 | 13F | Affiance Financial, LLC | 31,214 | 6.73 | 1,295 | 13.40 | ||||
| 2025-08-12 | 13F | Tarbox Family Office, Inc. | 8,318 | -4.61 | 345 | 1.47 | ||||
| 2025-08-12 | 13F | Jpmorgan Chase & Co | 594 | 266.67 | 25 | 300.00 | ||||
| 2025-07-22 | 13F | Valley National Advisers Inc | 971 | 0 | ||||||
| 2025-07-22 | 13F | Berkshire Money Management, Inc. | 1,000 | 42 | ||||||
| 2025-07-18 | 13F | PFG Investments, LLC | 7,633 | 7.31 | 317 | 14.08 | ||||
| 2025-07-30 | 13F | Whittier Trust Co | 20,309 | 0.00 | 843 | 6.18 | ||||
| 2025-07-30 | 13F | D.a. Davidson & Co. | 20,957 | -3.74 | 870 | 2.24 | ||||
| 2025-08-12 | 13F | Global Retirement Partners, LLC | 4,517 | 44.59 | 187 | 43.85 | ||||
| 2025-08-13 | 13F | Congress Wealth Management LLC / DE / | 15,091 | 16.85 | 626 | 24.21 | ||||
| 2025-08-15 | 13F | Morgan Stanley | 1,961 | 29.10 | 81 | 37.29 | ||||
| 2025-07-17 | 13F | Hanson & Doremus Investment Management | 1,118 | 0.00 | 0 | |||||
| 2025-07-31 | 13F | Cambridge Investment Research Advisors, Inc. | 29,446 | -30.15 | 1 | 0.00 | ||||
| 2025-08-15 | 13F | CI Private Wealth, LLC | 23,020 | 6.88 | 955 | 13.56 | ||||
| 2025-08-01 | 13F | Koss-Olinger Consulting, LLC | 135,265 | -9.33 | 5,613 | -3.71 | ||||
| 2025-08-12 | 13F | Wood Tarver Financial Group, LLC | 2,442 | 0.49 | 0 | -100.00 | ||||
| 2025-08-13 | 13F | Portland Global Advisors LLC | 14,335 | 7.14 | 595 | 13.79 | ||||
| 2025-07-18 | 13F | Trilogy Capital Inc. | 27,676 | 1.62 | 1,149 | 7.89 | ||||
| 2025-07-25 | 13F | NorthRock Partners, LLC | 16,030 | 3.38 | 665 | 9.92 | ||||
| 2025-08-13 | 13F | Northwestern Mutual Wealth Management Co | 21,143 | 17.64 | 877 | 24.93 | ||||
| 2025-07-09 | 13F | Alesco Advisors Llc | 7,742 | 1.22 | 321 | 7.72 | ||||
| 2025-08-08 | 13F | Cetera Investment Advisers | 43,066 | 22.74 | 1,787 | 30.44 | ||||
| 2025-08-15 | 13F | Urban Financial Advisory Corp | 0 | -100.00 | 0 | |||||
| 2025-07-23 | 13F | Values Added Financial LLC | 14,217 | 590 | ||||||
| 2025-08-14 | 13F | Fmr Llc | 862 | 0.00 | 36 | 6.06 | ||||
| 2025-05-15 | 13F | Captrust Financial Advisors | 0 | -100.00 | 0 | |||||
| 2025-07-25 | 13F | Joel Adams & Associates, Inc. | 8,456 | 351 | ||||||
| 2025-07-24 | 13F | Us Bancorp \de\ | 867 | -26.90 | 36 | -23.91 | ||||
| 2025-07-24 | 13F | Robertson Stephens Wealth Management, LLC | 20,792 | 9.93 | 863 | 16.80 | ||||
| 2025-08-12 | 13F | Armor Investment Advisors, LLC | 2,226 | 0.00 | 92 | 6.98 | ||||
| 2025-08-04 | 13F | Spire Wealth Management | 84 | 0.00 | 3 | 0.00 | ||||
| 2025-08-12 | 13F | LPL Financial LLC | 214,676 | 13.71 | 8,909 | 20.80 | ||||
| 2025-08-14 | 13F | Integrated Wealth Concepts LLC | 11,339 | 26.47 | 471 | 34.29 | ||||
| 2025-08-07 | 13F | Topel & Distasi Wealth Management, LLC | 19,118 | 6.39 | 793 | 12.96 | ||||
| 2025-05-08 | 13F | Wrapmanager Inc | 0 | -100.00 | 0 | |||||
| 2025-08-05 | 13F | Gould Asset Management Llc /ca/ | 32,270 | -0.72 | 1,339 | 5.52 | ||||
| 2025-07-24 | 13F | Eastern Bank | 321,842 | -1.49 | 13,356 | 4.64 | ||||
| 2025-08-12 | 13F | Franklin Resources Inc | 95,824 | -3.38 | 3,977 | 2.63 | ||||
| 2025-07-22 | 13F | DAVENPORT & Co LLC | 11,104 | 5.52 | 461 | 11.92 | ||||
| 2025-07-22 | 13F | Miracle Mile Advisors, LLC | 136,719 | 5,674 |