Mga Batayang Estadistika
| Pemilik Institusional | 189 total, 186 long only, 1 short only, 2 long/short - change of 0.00% MRQ |
| Alokasi Portofolio Rata-rata | 0.2127 % - change of -13.44% MRQ |
| Saham Institusional (Jangka Panjang) | 49,034,093 (ex 13D/G) - change of 13.53MM shares 38.10% MRQ |
| Nilai Institusional (Jangka Panjang) | $ 398,403 USD ($1000) |
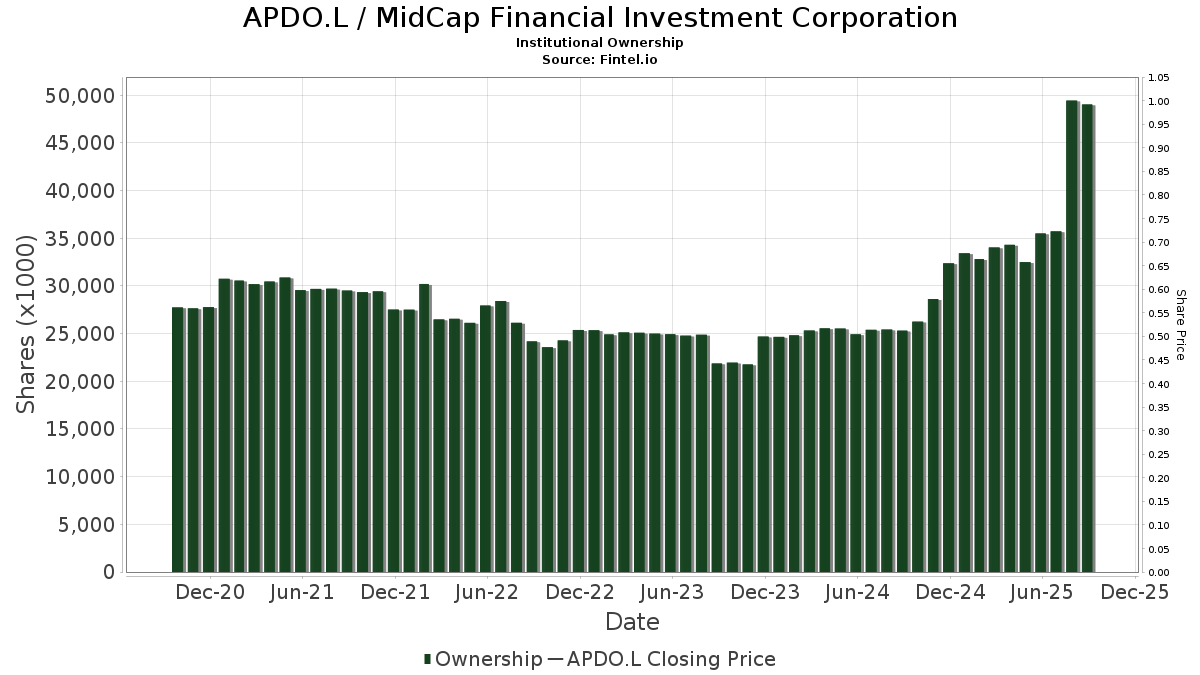
Kepemilikan Institusional dan Pemegang Saham
MidCap Financial Investment Corporation (US:APDO.L) memiliki 189 pemilik institusional dan pemegang saham yang telah mengajukan formulir 13D/G atau 13F kepada Komisi Bursa Efek (Securities Exchange Commission/SEC). Lembaga-lembaga ini memegang total 49,034,093 saham. Pemegang saham terbesar meliputi Kingstone Capital Partners Texas, LLC, Thornburg Investment Management Inc, TIBAX - Thornburg Investment Income Builder Fund - Class A, Van Eck Associates Corp, Apollo Management Holdings, L.P., BIZD - VanEck Vectors BDC Income ETF, Morgan Stanley, UBS Group AG, KBWD - Invesco KBW High Dividend Yield Financial ETF, and Franklin Resources Inc .
Struktur kepemilikan institusional MidCap Financial Investment Corporation (OTCPK:APDO.L) menunjukkan posisi terkini di perusahaan oleh institusi dan dana, serta perubahan terbaru dalam ukuran posisi. Pemegang saham utama dapat mencakup investor individu, reksa dana, dana lindung nilai, atau institusi. Jadwal 13D menunjukkan bahwa investor memegang (atau pernah memegang) lebih dari 5% saham perusahaan dan bermaksud (atau pernah bermaksud) untuk secara aktif mengejar perubahan strategi bisnis. Jadwal 13G menunjukkan investasi pasif lebih dari 5%.
Skor Sentimen Dana
Skor Sentimen Dana (sebelumnya dikenal sebagai Skor Akumulasi Kepemilikan) menemukan saham-saham yang paling banyak dibeli oleh dana. Ini adalah hasil dari model kuantitatif multi-faktor yang canggih yang mengidentifikasi perusahaan dengan tingkat akumulasi institusional tertinggi. Model penilaian menggunakan kombinasi dari total peningkatan pemilik yang diungkapkan, perubahan dalam alokasi portofolio pada pemilik tersebut, dan metrik lainnya. Angka berkisar dari 0 hingga 100, dengan angka yang lebih tinggi menunjukkan tingkat akumulasi yang lebih tinggi dibandingkan dengan perusahaan sejenisnya, dan 50 adalah rata-ratanya.
Frekuensi Pembaruan: Setiap Hari
Lihat Ownership Explorer, yang menyediakan daftar perusahaan dengan peringkat tertinggi.
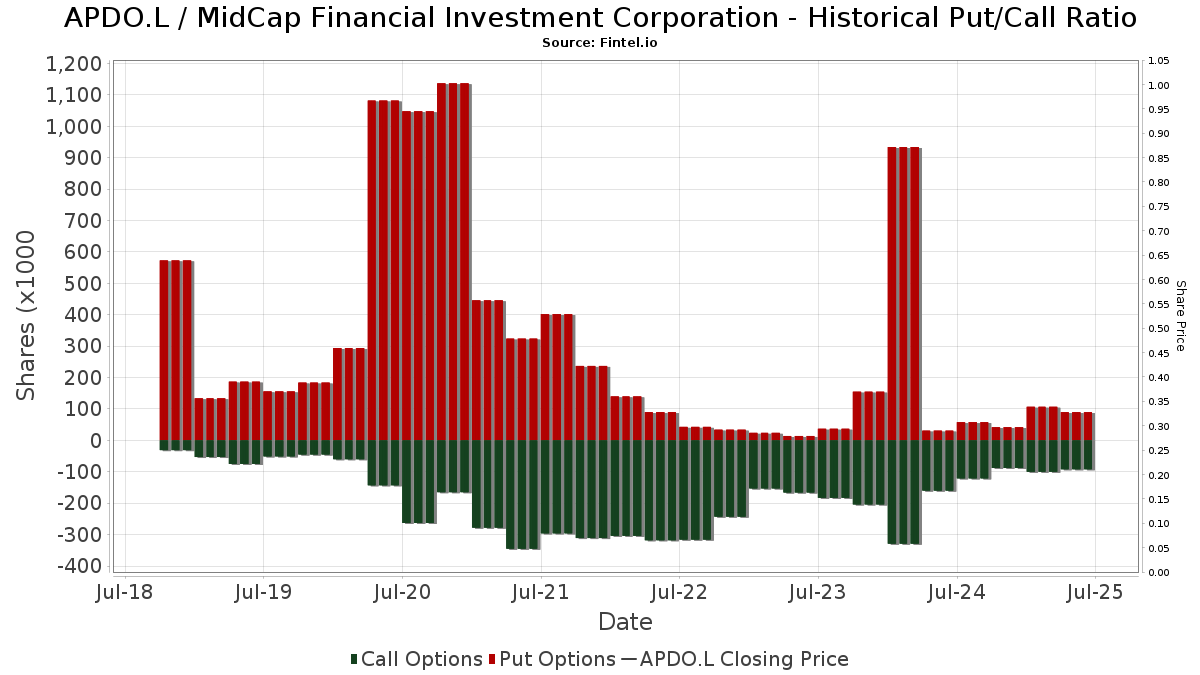
Rasio Put/Call Institusional
Selain melaporkan isu ekuitas dan utang standar, institusi dengan aset di bawah manajemen lebih dari 100 juta dolar AS juga harus mengungkapkan kepemilikan opsi put dan call mereka. Karena opsi put umumnya menunjukkan sentimen negatif, dan opsi call menunjukkan sentimen positif, kita dapat mengetahui sentimen institusional secara keseluruhan dengan memplot rasio put terhadap call. Grafik di sebelah kanan memplot rasio put/call historis untuk instrumen ini.
Menggunakan Rasio Put/Call sebagai indikator sentimen investor mengatasi salah satu kekurangan utama dari penggunaan total kepemilikan institusional, yaitu sejumlah besar aset yang dikelola diinvestasikan secara pasif untuk melacak indeks. Dana yang dikelola secara pasif biasanya tidak membeli opsi, sehingga indikator rasio put/call lebih akurat dalam melacak sentimen dana yang dikelola secara aktif.
Pengajuan 13F dan NPORT
Detail pada pengajuan 13F tersedia gratis. Detail pada pengajuan NP memerlukan keanggotaan premium. Baris berwarna hijau menunjukkan posisi baru. Baris berwarna merah menunjukkan posisi yang sudah ditutup. Klik tautan ini ikon untuk melihat riwayat transaksi selengkapnya.
Tingkatkan
untuk membuka data premium dan mengekspor ke Excel ![]() .
.
| Tanggal File | Sumber | Investor | Ketik | Presyo ng Avg (Silangan) |
Saham | Δ Saham (%) |
Dilaporkan Nilai ($1000) |
Nilai Δ (%) |
Alokasi Port (%) |
|
|---|---|---|---|---|---|---|---|---|---|---|
| 2025-08-14 | 13F | Group One Trading, L.p. | 699 | 9 | ||||||
| 2025-08-14 | 13F | Crawford Fund Management, LLC | Put | 62,400 | -23.81 | 787 | -25.26 | |||
| 2025-07-31 | 13F | Sumitomo Mitsui Trust Holdings, Inc. | 334,994 | 44.03 | 4,228 | 41.32 | ||||
| 2025-08-19 | 13F | Newbridge Financial Services Group, Inc. | 276 | 3 | ||||||
| 2025-07-16 | 13F | Essex Financial Services, Inc. | 10,621 | 0.18 | 134 | -1.47 | ||||
| 2025-08-25 | 13F/A | Neuberger Berman Group LLC | 472,254 | 0.10 | 5,960 | -1.78 | ||||
| 2025-07-29 | NP | SLPAX - Siit Small Cap Fund - Class A | 21,366 | 0.00 | 280 | -4.76 | ||||
| 2025-07-25 | 13F | Cwm, Llc | 1,050 | 0 | ||||||
| 2025-08-14 | 13F | Jane Street Group, Llc | 15,105 | 191 | ||||||
| 2025-08-18 | 13F | N.E.W. Advisory Services LLC | 48 | 0.00 | 1 | |||||
| 2025-08-06 | 13F | Ethos Financial Group, LLC | 421,901 | 1.43 | 5,324 | -0.69 | ||||
| 2025-08-14 | 13F | Kovitz Investment Group Partners, LLC | 109,666 | 0.00 | 1,384 | -1.91 | ||||
| 2025-06-18 | NP | Putnam ETF Trust - Putnam BDC ETF - | 709,025 | 28.11 | 8,409 | 8.53 | ||||
| 2025-08-14 | 13F | CF Capital LLC | 0 | -100.00 | 0 | |||||
| 2025-08-14 | 13F | Bnp Paribas Arbitrage, Sa | 0 | -100.00 | 0 | |||||
| 2025-08-14 | 13F | UBS Group AG | 1,667,288 | 32.19 | 21,041 | 29.72 | ||||
| 2025-08-04 | 13F | Muzinich & Co., Inc. | 401,393 | 68.35 | 5,066 | 65.20 | ||||
| 2025-08-14 | 13F | First Commonwealth Financial Corp /pa/ | 24,175 | 0.00 | 305 | -1.61 | ||||
| 2025-07-21 | 13F | Ameritas Advisory Services, LLC | 2,518 | 32 | ||||||
| 2025-07-29 | 13F | International Assets Investment Management, Llc | 25,996 | 1.57 | 328 | -0.30 | ||||
| 2025-08-12 | 13F | AlphaCore Capital LLC | 11,529 | -36.97 | 145 | -38.30 | ||||
| 2025-05-13 | 13F | Sterling Capital Management LLC | 0 | -100.00 | 0 | |||||
| 2025-05-15 | 13F | Tudor Investment Corp Et Al | 0 | -100.00 | 0 | |||||
| 2025-07-08 | 13F | Parallel Advisors, LLC | 7,680 | -8.08 | 97 | -10.28 | ||||
| 2025-08-01 | 13F | Bessemer Group Inc | 3,304 | 0.00 | 0 | |||||
| 2025-08-05 | 13F | Access Investment Management LLC | 4,000 | 0.00 | 50 | -5.66 | ||||
| 2025-08-14 | 13F | CoreCap Advisors, LLC | 1,132 | 0.00 | 14 | 0.00 | ||||
| 2025-07-10 | 13F | Security National Bank | 6,044 | 6.11 | 76 | 4.11 | ||||
| 2025-08-13 | 13F | Congress Wealth Management LLC / DE / | 76,278 | 158.23 | 963 | 153.83 | ||||
| 2025-08-15 | 13F | Tower Research Capital LLC (TRC) | 9,513 | 20,580.43 | 120 | |||||
| 2025-08-26 | NP | WCERX - WCM Alternatives: Event-Driven Fund - Investor Class Shares | 7,702 | 0.00 | 97 | -2.02 | ||||
| 2025-08-13 | 13F | Northwestern Mutual Wealth Management Co | 563 | -25.73 | 7 | -22.22 | ||||
| 2025-06-26 | NP | DVDN - Kingsbarn Dividend Opportunity ETF | 0 | -100.00 | 0 | -100.00 | ||||
| 2025-08-13 | 13F | Lansforsakringar Fondforvaltning AB (publ) | 0 | -100.00 | 0 | |||||
| 2025-07-29 | 13F | Stephens Inc /ar/ | 84,191 | 0.00 | 1,062 | -1.85 | ||||
| 2025-08-13 | 13F | Quantbot Technologies LP | 18,246 | 230 | ||||||
| 2025-08-14 | 13F | Lazard Asset Management Llc | 112,935 | 44.54 | 1 | 0.00 | ||||
| 2025-08-12 | 13F | Legal & General Group Plc | 616,852 | -1.30 | 7,791 | -3.11 | ||||
| 2025-05-14 | 13F | Virtus ETF Advisers LLC | 0 | -100.00 | 0 | |||||
| 2025-07-15 | 13F | Graypoint LLC | 186,797 | 3.06 | 2,357 | 1.16 | ||||
| 2025-07-18 | 13F | Generali Investments CEE, investicni spolecnost, a.s. | 24,139 | 6.25 | 305 | 4.11 | ||||
| 2025-08-12 | 13F | Private Management Group Inc | 10,317 | 130 | ||||||
| 2025-08-13 | 13F | Thornburg Investment Management Inc | 2,937,783 | 0.00 | 37,075 | -90.19 | ||||
| 2025-08-07 | 13F | ProShare Advisors LLC | 18,546 | -4.36 | 234 | -6.02 | ||||
| 2025-08-14 | 13F | Comerica Bank | 91,955 | 10.91 | 1,160 | 8.82 | ||||
| 2025-05-12 | 13F | Entropy Technologies, LP | 0 | -100.00 | 0 | |||||
| 2025-08-14 | 13F | Van Eck Associates Corp | 2,390,155 | 6.81 | 30 | 7.14 | ||||
| 2025-08-14 | 13F | Ameriprise Financial Inc | 402,636 | 16.63 | 5,081 | 14.44 | ||||
| 2025-07-10 | 13F | Capital Advisory Group Advisory Services, LLC | 34,677 | 0.00 | 438 | -1.80 | ||||
| 2025-08-07 | 13F | Allworth Financial LP | 3,224 | 26.04 | 41 | 33.33 | ||||
| 2025-07-28 | 13F | Frazier Financial Advisors, LLC | 0 | 0 | ||||||
| 2025-08-07 | 13F | Panoramic Investment Advisors, Llc | 53,630 | 0.00 | 677 | -1.89 | ||||
| 2025-05-14 | 13F | CIBC World Markets Inc. | 0 | -100.00 | 0 | |||||
| 2025-07-28 | 13F | Harbour Investments, Inc. | 6,409 | 0.00 | 81 | -2.44 | ||||
| 2025-08-08 | 13F | Creative Planning | 14,539 | 5.62 | 183 | 3.39 | ||||
| 2025-08-14 | 13F | Susquehanna International Group, Llp | 0 | -100.00 | 0 | |||||
| 2025-08-11 | 13F | United Advisor Group, LLC | 256,852 | 0.24 | 3,241 | -1.64 | ||||
| 2025-07-14 | 13F | GAMMA Investing LLC | 0 | -100.00 | 0 | |||||
| 2025-08-11 | 13F | Shufro Rose & Co Llc | 41,834 | -5.23 | 538 | -5.29 | ||||
| 2025-09-04 | 13F/A | Advisor Group Holdings, Inc. | 95,698 | 1.59 | 1,208 | -0.25 | ||||
| 2025-08-18 | 13F/A | Apollo Management Holdings, L.P. | 2,388,857 | 0.00 | 30,147 | -1.87 | ||||
| 2025-07-30 | 13F | Denali Advisors Llc | 87,681 | -2.58 | 1,107 | -4.41 | ||||
| 2025-08-05 | 13F | Key FInancial Inc | 150 | 0.00 | 2 | 0.00 | ||||
| 2025-04-11 | 13F | Stablepoint Partners, LLC | 0 | -100.00 | 0 | |||||
| 2025-08-13 | 13F | Virtus Investment Advisers, Inc. | 69,513 | -2.23 | 877 | -4.05 | ||||
| 2025-08-08 | 13F | Cetera Investment Advisers | 30,384 | 2.09 | 383 | 0.26 | ||||
| 2025-07-25 | NP | First Trust Specialty Finance & Financial Opportunities Fund This fund is a listed as child fund of First Trust Advisors Lp and if that institution has disclosed ownership in this security, then these positions will not be double counted when calculating total shares and total value | 140,000 | 115.38 | 1,838 | 105.25 | ||||
| 2025-07-30 | 13F | D.a. Davidson & Co. | 328,055 | 4.84 | 4,140 | 2.88 | ||||
| 2025-07-09 | 13F | Westbourne Investments, Inc. | 18,930 | -72.49 | 239 | -73.08 | ||||
| 2025-08-06 | 13F | Axim Planning & Wealth | 11,780 | 149 | ||||||
| 2025-08-05 | 13F | Castlekeep Investment Advisors Llc | 388,911 | 0.02 | 4,908 | -1.84 | ||||
| 2025-08-14 | 13F | Susquehanna International Group, Llp | Put | 10,500 | -40.68 | 133 | -41.85 | |||
| 2025-08-14 | 13F | Citadel Advisors Llc | Call | 52,000 | -19.25 | 656 | -20.77 | |||
| 2025-08-14 | 13F | Citadel Advisors Llc | 24,371 | 308 | ||||||
| 2025-08-14 | 13F | Susquehanna International Group, Llp | Call | 26,400 | -26.05 | 333 | -27.45 | |||
| 2025-08-14 | 13F | Citadel Advisors Llc | Put | 17,800 | 140.54 | 225 | 135.79 | |||
| 2025-08-08 | 13F | Pnc Financial Services Group, Inc. | 14,142 | 0.00 | 178 | -1.66 | ||||
| 2025-08-13 | 13F | Cheviot Value Management, LLC | 333 | 0.00 | 4 | 33.33 | ||||
| 2025-06-25 | NP | VPC - Virtus Private Credit Strategy ETF | 64,946 | -5.82 | 770 | -20.21 | ||||
| 2025-08-12 | 13F | CIBC Private Wealth Group, LLC | 3,675 | 0.00 | 46 | 21.05 | ||||
| 2025-08-14 | 13F | Stifel Financial Corp | 334,446 | -0.20 | 4,221 | -2.07 | ||||
| 2025-08-12 | 13F | Advisors Asset Management, Inc. | 362,391 | -23.53 | 4,573 | -24.96 | ||||
| 2025-08-12 | 13F | Jpmorgan Chase & Co | 58,763 | -49.81 | 742 | -50.76 | ||||
| 2025-08-14 | 13F | Ausdal Financial Partners, Inc. | 10,999 | -10.95 | 139 | -12.66 | ||||
| 2025-07-28 | NP | PEX - ProShares Global Listed Private Equity ETF | 19,829 | 1.22 | 260 | -3.35 | ||||
| 2025-08-11 | 13F | HighTower Advisors, LLC | 89,492 | 4.59 | 1,129 | 2.64 | ||||
| 2025-08-12 | 13F | Walled Lake Planning & Wealth Management, Llc | 22,271 | 0.00 | 281 | -1.75 | ||||
| 2025-08-14 | 13F | Bank Of America Corp /de/ | 194,265 | -48.38 | 2,452 | -49.35 | ||||
| 2025-08-14 | 13F | Two Sigma Advisers, Lp | 223,220 | -0.34 | 2,817 | -2.19 | ||||
| 2025-08-05 | 13F | Sigma Planning Corp | 73,046 | 3.08 | 922 | 1.10 | ||||
| 2025-08-14 | 13F | Arete Wealth Advisors, LLC | 15,938 | 3.24 | 0 | |||||
| 2025-04-28 | 13F | Redmont Wealth Advisors Llc | 13,054 | 0.00 | 168 | -5.11 | ||||
| 2025-08-13 | 13F | Everstar Asset Management, LLC | 20,850 | -12.58 | 263 | -14.05 | ||||
| 2025-07-31 | 13F | Oppenheimer & Co Inc | 15,743 | 1.94 | 199 | 0.00 | ||||
| 2025-08-12 | 13F | BlackRock, Inc. | 611,877 | 32.91 | 7,722 | 30.42 | ||||
| 2025-08-12 | 13F | SRS Capital Advisors, Inc. | 660 | 8 | ||||||
| 2025-05-27 | NP | Brighthouse Funds Trust I - Brighthouse Small Cap Value Portfolio Class A | 131,542 | 0.00 | 1,692 | -4.68 | ||||
| 2025-07-28 | 13F | Naviter Wealth, LLC | 203,259 | 2.92 | 2,565 | -0.39 | ||||
| 2025-08-07 | 13F | Parkside Financial Bank & Trust | 7,276 | 3.00 | 92 | 1.11 | ||||
| 2025-08-14 | 13F | Williams Jones Wealth Management, LLC. | 10,901 | 0.00 | 138 | -2.14 | ||||
| 2025-07-08 | 13F | Nbc Securities, Inc. | 300 | 0.00 | 0 | |||||
| 2025-07-18 | 13F | Founders Capital Management | 1,500 | 0.00 | 19 | -5.26 | ||||
| 2025-07-11 | 13F | Orrstown Financial Services Inc | 13,640 | 0.00 | 172 | -1.71 | ||||
| 2025-07-23 | 13F | Tcfg Wealth Management, Llc | 41,656 | 0.00 | 526 | -1.87 | ||||
| 2025-08-19 | 13F | National Asset Management, Inc. | 19,102 | 241 | ||||||
| 2025-07-24 | 13F | IFP Advisors, Inc | 1,514 | 0.93 | 19 | 0.00 | ||||
| 2025-08-14 | 13F | Westchester Capital Management, LLC | 7,702 | 0.00 | 97 | -2.02 | ||||
| 2025-08-13 | 13F | Jones Financial Companies Lllp | 6,614 | 26.85 | 83 | 22.39 | ||||
| 2025-08-11 | 13F | Principal Securities, Inc. | 36,999 | 37.40 | 467 | 28.37 | ||||
| 2025-07-15 | 13F | DKM Wealth Management, Inc. | 23,500 | 0.00 | 297 | -1.99 | ||||
| 2025-08-11 | 13F | Anfield Capital Management, LLC | 8,804 | 5.41 | 111 | 3.74 | ||||
| 2025-08-13 | 13F | StoneX Group Inc. | 13,956 | 4.42 | 176 | 2.92 | ||||
| 2025-08-05 | 13F | GPS Wealth Strategies Group, LLC | 1,079 | 0.00 | 14 | 0.00 | ||||
| 2025-08-14 | 13F | Millennium Management Llc | 246,923 | 1,100.93 | 3,116 | 1,080.30 | ||||
| 2025-07-08 | 13F | Ransom Advisory, Ltd | 0 | -100.00 | 0 | |||||
| 2025-08-19 | 13F | Asset Dedication, LLC | 0 | -100.00 | 0 | |||||
| 2025-08-12 | 13F | Steward Partners Investment Advisory, Llc | 35,291 | 1.13 | 445 | -0.67 | ||||
| 2025-08-04 | 13F | Arkadios Wealth Advisors | 103,954 | 4.97 | 1,312 | 2.99 | ||||
| 2025-08-06 | 13F | LeClair Wealth Partners LLC | 40,885 | 0.00 | 516 | -1.90 | ||||
| 2025-07-17 | 13F/A | Capital Investment Advisors, LLC | 70,434 | -4.03 | 889 | -5.83 | ||||
| 2025-08-27 | 13F/A | Squarepoint Ops LLC | 0 | -100.00 | 0 | -100.00 | ||||
| 2025-05-15 | 13F | Aquatic Capital Management LLC | 0 | -100.00 | 0 | |||||
| 2025-08-13 | 13F | Transce3nd, LLC | 5,439 | 269.75 | 69 | 277.78 | ||||
| 2025-07-11 | 13F | Farther Finance Advisors, LLC | 584 | -73.56 | 7 | -75.00 | ||||
| 2025-05-15 | 13F | Nebula Research & Development LLC | 0 | -100.00 | 0 | -100.00 | ||||
| 2025-08-07 | 13F | Acadian Asset Management Llc | 764 | -22.83 | 0 | |||||
| 2025-05-09 | 13F | TD Waterhouse Canada Inc. | 0 | -100.00 | 0 | |||||
| 2025-07-11 | 13F | Kingstone Capital Partners Texas, LLC | 13,812,738 | 189 | ||||||
| 2025-08-14 | 13F | Royal Bank Of Canada | 237,209 | 17.79 | 2,994 | 15.60 | ||||
| 2025-08-11 | 13F | Wealthspire Advisors, LLC | 10,018 | 126 | ||||||
| 2025-08-14 | 13F | Cura Wealth Advisors, Llc | 708,959 | 9.31 | 8,947 | 7.28 | ||||
| 2025-08-08 | 13F | Condor Capital Management | 412,875 | 3.98 | 5,210 | 2.04 | ||||
| 2025-08-14 | 13F | Two Sigma Investments, Lp | 222,459 | 5.80 | 2,807 | 3.81 | ||||
| 2025-08-06 | 13F | Wedbush Securities Inc | 36,643 | 0.97 | 0 | |||||
| 2025-08-15 | 13F | Morgan Stanley | 1,887,140 | 3.52 | 23,816 | 1.58 | ||||
| 2025-05-05 | 13F | Lindbrook Capital, Llc | 38 | 0.00 | 0 | |||||
| 2025-08-15 | 13F | Caxton Associates Llp | 12,886 | 0.00 | 163 | -1.82 | ||||
| 2025-07-25 | 13F | Allspring Global Investments Holdings, LLC | 0 | -100.00 | 0 | -100.00 | ||||
| 2025-08-15 | 13F | Great West Life Assurance Co /can/ | 93,857 | 5.07 | 1 | 0.00 | ||||
| 2025-08-07 | 13F | Connor, Clark & Lunn Investment Management Ltd. | 51,851 | -50.00 | 654 | -50.94 | ||||
| 2025-08-14 | 13F | Two Sigma Securities, Llc | 10,561 | 133 | ||||||
| 2025-08-13 | 13F | Northern Trust Corp | 33,081 | 417 | ||||||
| 2025-08-19 | 13F | Advisory Services Network, LLC | 23,530 | 12.00 | 296 | 9.63 | ||||
| 2025-08-28 | NP | Monachil Credit Income Fund | 10,000 | 126 | ||||||
| 2025-08-07 | 13F | Evoke Wealth, Llc | 36,800 | 0.00 | 464 | -1.90 | ||||
| 2025-08-14 | 13F/A | Rockefeller Capital Management L.P. | 77,277 | 1.46 | 975 | -0.41 | ||||
| 2025-07-18 | 13F | Truist Financial Corp | 25,850 | -6.51 | 326 | -8.17 | ||||
| 2025-08-04 | 13F | Assetmark, Inc | 500 | 6 | ||||||
| 2025-08-13 | 13F | M Holdings Securities, Inc. | 72,318 | -3.06 | 1 | |||||
| 2025-08-21 | NP | TIBAX - Thornburg Investment Income Builder Fund - Class A | 2,937,783 | 0.00 | 37,075 | -1.87 | ||||
| 2025-04-25 | NP | VSSVX - Small Cap Special Values Fund | 62,406 | -2.28 | 860 | -4.98 | ||||
| 2025-07-17 | 13F | HB Wealth Management, LLC | 12,819 | 3.00 | 162 | 0.63 | ||||
| 2025-08-14 | 13F | Wells Fargo & Company/mn | 584,965 | 0.12 | 7,382 | -1.74 | ||||
| 2025-08-14 | 13F | Brevan Howard Capital Management LP | 23,780 | 9.01 | 300 | 7.14 | ||||
| 2025-07-31 | 13F | MQS Management LLC | 0 | -100.00 | 0 | |||||
| 2025-08-12 | 13F | Proequities, Inc. | 0 | 0 | ||||||
| 2025-08-25 | 13F/A | Promus Capital, LLC | 5,300 | 0.00 | 67 | -2.94 | ||||
| 2025-08-15 | 13F | WFA of San Diego, LLC | 0 | -100.00 | 0 | |||||
| 2025-07-18 | 13F | Trust Co Of Vermont | 466 | 6 | ||||||
| 2025-08-14 | 13F | Verition Fund Management LLC | 47,589 | 601 | ||||||
| 2025-07-30 | 13F | Onyx Bridge Wealth Group LLC | 17,539 | 1.44 | 221 | -0.45 | ||||
| 2025-08-11 | 13F | Citigroup Inc | 0 | -100.00 | 0 | |||||
| 2025-08-21 | NP | BIZD - VanEck Vectors BDC Income ETF | 2,113,835 | 2.33 | 26,677 | 0.42 | ||||
| 2025-08-13 | 13F | Garner Asset Management Corp | 111,631 | -15.34 | 1,409 | -16.93 | ||||
| 2025-08-14 | 13F | NCP Inc. | 0 | -100.00 | 0 | |||||
| 2025-07-25 | 13F | Sovereign Financial Group, Inc. | 12,113 | 0.00 | 153 | -1.94 | ||||
| 2025-05-15 | 13F | WPG Advisers, LLC | 0 | -100.00 | 0 | -100.00 | ||||
| 2025-08-07 | 13F | Resources Investment Advisors, LLC. | 18,947 | -29.58 | 239 | -30.92 | ||||
| 2025-07-28 | NP | KBWD - Invesco KBW High Dividend Yield Financial ETF This fund is a listed as child fund of Invesco Ltd. and if that institution has disclosed ownership in this security, then these positions will not be double counted when calculating total shares and total value | 864,454 | 13.13 | 11,346 | 7.75 | ||||
| 2025-06-27 | NP | LBO - WHITEWOLF Publicly Listed Private Equity ETF | 6,075 | 14.28 | 72 | -2.70 | ||||
| 2025-07-24 | 13F | Us Bancorp \de\ | 23,359 | -7.59 | 295 | -9.54 | ||||
| 2025-08-14 | 13F | Peak6 Llc | Call | 13,900 | 175 | |||||
| 2025-07-16 | 13F | Signaturefd, Llc | 3,387 | 88.48 | 43 | 82.61 | ||||
| 2025-08-12 | 13F | Global Retirement Partners, LLC | 445 | 6 | ||||||
| 2025-08-15 | 13F | Provenance Wealth Advisors, LLC | 0 | -100.00 | 0 | |||||
| 2025-07-22 | 13F | Accel Wealth Management | 13,731 | 0.59 | 173 | -1.14 | ||||
| 2025-08-13 | 13F | Callodine Capital Management, LP | 500,000 | 22.00 | 6,310 | 19.73 | ||||
| 2025-08-12 | 13F | LPL Financial LLC | 538,467 | -4.21 | 6,795 | -6.00 | ||||
| 2025-08-06 | 13F | Fox Run Management, L.l.c. | 0 | -100.00 | 0 | |||||
| 2025-08-13 | 13F | 1832 Asset Management L.P. | 0 | -100.00 | 0 | |||||
| 2025-08-21 | NP | MOFTX - Mercer Opportunistic Fixed Income Fund Class I | 42,000 | 530 | ||||||
| 2025-05-15 | 13F | Barclays Plc | 0 | -100.00 | 0 | |||||
| 2025-04-30 | 13F | POM Investment Strategies, LLC | 0 | -100.00 | 0 | |||||
| 2025-08-11 | 13F | Sharpepoint Llc | 80,563 | 17.49 | 1,017 | 23.00 | ||||
| 2025-07-29 | 13F | Activest Wealth Management | 2,266 | 0.00 | 29 | -3.45 | ||||
| 2025-08-14 | 13F | Raymond James Financial Inc | 48,311 | -23.74 | 610 | -25.18 | ||||
| 2025-08-12 | 13F | DnB Asset Management AS | 164,114 | 0.00 | 2,071 | -1.85 | ||||
| 2025-08-14 | 13F | Almitas Capital LLC | 92,717 | -35.11 | 1,170 | -36.31 | ||||
| 2025-05-13 | 13F | Sei Investments Co | 49,089 | 0.00 | 662 | 0.00 | ||||
| 2025-08-11 | 13F | Lsv Asset Management | 104,866 | 0.00 | 1 | 0.00 | ||||
| 2025-08-07 | 13F | Hennion & Walsh Asset Management, Inc. | 223,557 | -27.97 | 2,821 | -29.32 | ||||
| 2025-08-13 | 13F | Invesco Ltd. | 770,438 | -12.31 | 9,723 | -13.95 | ||||
| 2025-08-08 | 13F | Foundations Investment Advisors, LLC | 371,828 | -13.00 | 4,692 | -14.63 | ||||
| 2025-05-12 | 13F | Virtu Financial LLC | 0 | -100.00 | 0 | |||||
| 2025-08-04 | 13F | Hantz Financial Services, Inc. | 500 | 0.00 | 0 | |||||
| 2025-07-23 | 13F | Tyche Wealth Partners LLC | 23,500 | 20.51 | 297 | 18.40 | ||||
| 2025-08-11 | 13F | Private Advisor Group, LLC | 0 | -100.00 | 0 | |||||
| 2025-08-07 | 13F | Global Wealth Management Investment Advisory, Inc. | 85,220 | 7.73 | 1,075 | 5.70 | ||||
| 2025-05-14 | 13F | Credit Agricole S A | 28,265 | 0.00 | 363 | -4.72 | ||||
| 2025-08-12 | 13F | J.w. Cole Advisors, Inc. | 119,168 | 12.80 | 1,504 | 10.68 | ||||
| 2025-08-01 | 13F | Envestnet Asset Management Inc | 48,838 | 8.96 | 616 | 6.94 | ||||
| 2025-08-12 | 13F | Trexquant Investment LP | 13,777 | 174 | ||||||
| 2025-04-28 | 13F | Strategic Financial Concepts, LLC | 0 | -100.00 | 0 | -100.00 | ||||
| 2025-08-11 | 13F | Nomura Asset Management Co Ltd | 6,706 | 20.63 | 85 | 18.31 | ||||
| 2025-08-13 | 13F | Lido Advisors, LLC | 69,158 | 13.65 | 873 | 11.51 | ||||
| 2025-07-17 | 13F | Janney Montgomery Scott LLC | 56,575 | -2.33 | 1 | |||||
| 2025-07-16 | 13F | Meridian Investment Counsel Inc. | 42,045 | -21.33 | 531 | -22.85 | ||||
| 2025-08-14 | 13F | Wealth Preservation Advisors, LLC | 0 | -100.00 | 0 | |||||
| 2025-07-14 | 13F | AdvisorNet Financial, Inc | 157,228 | -7.98 | 1,984 | -9.70 | ||||
| 2025-08-15 | 13F | Kestra Advisory Services, LLC | 19,263 | 43.28 | 243 | 41.28 | ||||
| 2025-08-14 | 13F | Ares Management Llc | 545,532 | 13.17 | 6,885 | 11.07 | ||||
| 2025-07-31 | 13F | Cambridge Investment Research Advisors, Inc. | 11,358 | -45.04 | 0 | |||||
| 2025-05-12 | 13F | National Bank Of Canada /fi/ | 0 | -100.00 | 0 | |||||
| 2025-08-06 | 13F | Commonwealth Equity Services, Llc | 466,028 | 33.05 | 6 | 25.00 | ||||
| 2025-08-19 | 13F | Anchor Investment Management, LLC | 2,577 | 0.00 | 33 | -3.03 | ||||
| 2025-05-02 | 13F | Transcendent Capital Group LLC | 0 | -100.00 | 0 | |||||
| 2025-05-30 | NP | ERNZ - TrueShares Active Yield ETF | 8,773 | 113 | ||||||
| 2025-08-19 | 13F | Cape Investment Advisory, Inc. | 1,784 | 0.00 | 23 | 0.00 | ||||
| 2025-04-25 | 13F | Smallwood Wealth Investment Management, LLC | 16 | 0 | ||||||
| 2025-08-12 | 13F | Franklin Resources Inc | 772,538 | 18.27 | 9,749 | 16.06 | ||||
| 2025-07-17 | 13F | Camelot Portfolios, LLC | 61,884 | -4.18 | 781 | -6.02 | ||||
| 2025-08-14 | 13F | GWM Advisors LLC | 24,430 | 4.27 | 308 | 2.33 | ||||
| 2025-08-14 | 13F | BI Asset Management Fondsmaeglerselskab A/S | 271,547 | 11.49 | 3 | 0.00 | ||||
| 2025-07-17 | 13F | Melfa Wealth Management, Llc | 13,718 | 0.00 | 173 | -1.70 | ||||
| 2025-08-05 | 13F | Next Capital Management LLC | 725,401 | 329.02 | 9,155 | 321.07 | ||||
| 2025-08-14 | 13F | Wiley Bros.-aintree Capital, Llc | 38,624 | 17.96 | 487 | 14.32 | ||||
| 2025-07-31 | 13F | Whipplewood Advisors, LLC | 63,341 | 2,111,266.67 | 799 | -16.34 | ||||
| 2025-08-14 | 13F | Qube Research & Technologies Ltd | 0 | -100.00 | 0 | |||||
| 2025-08-13 | 13F | Guggenheim Capital Llc | 10,443 | -1.15 | 132 | -2.96 | ||||
| 2025-07-01 | 13F | Confluence Investment Management Llc | 165,155 | 84.02 | 2,084 | 80.59 |