Mga Batayang Estadistika
| Pemilik Institusional | 138 total, 138 long only, 0 short only, 0 long/short - change of 6.98% MRQ |
| Alokasi Portofolio Rata-rata | 1.3079 % - change of -5.97% MRQ |
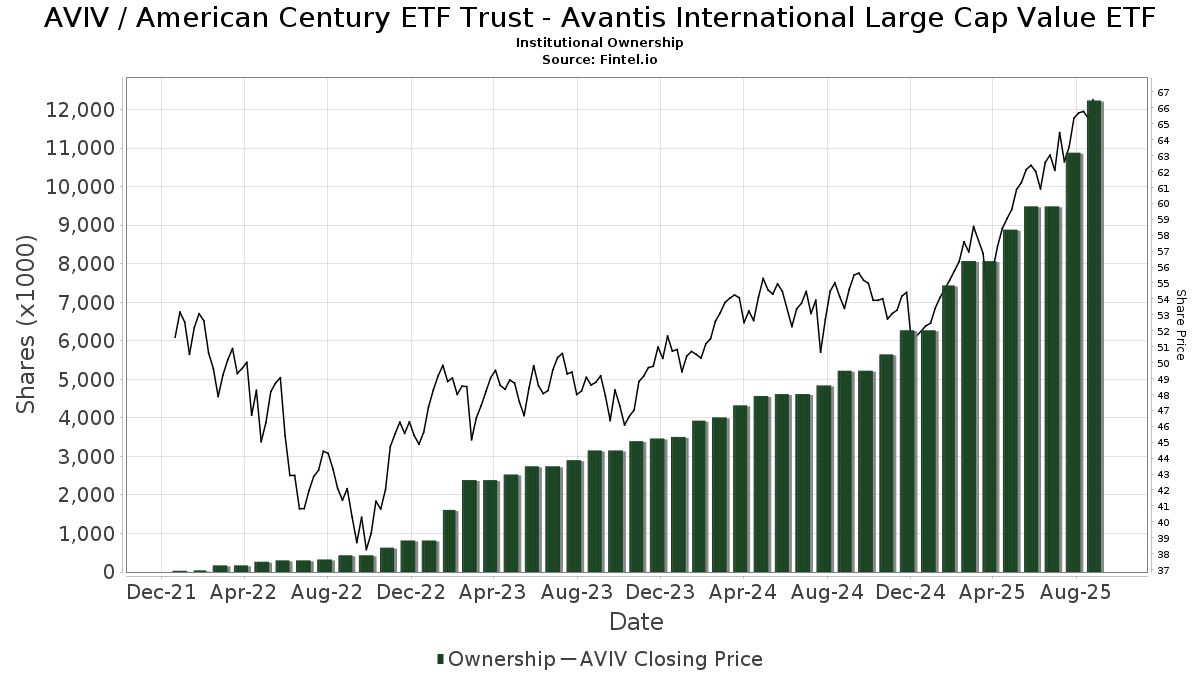
| Saham Institusional (Jangka Panjang) | 12,234,217 (ex 13D/G) - change of 2.75MM shares 28.95% MRQ |
| Nilai Institusional (Jangka Panjang) | $ 683,998 USD ($1000) |
Kepemilikan Institusional dan Pemegang Saham
American Century ETF Trust - Avantis International Large Cap Value ETF (US:AVIV) memiliki 138 pemilik institusional dan pemegang saham yang telah mengajukan formulir 13D/G atau 13F kepada Komisi Bursa Efek (Securities Exchange Commission/SEC). Lembaga-lembaga ini memegang total 12,234,217 saham. Pemegang saham terbesar meliputi American Century Companies Inc, PrairieView Partners, LLC, AVNM - Avantis All International Markets Equity ETF, IAG Wealth Partners, LLC, AVGE - Avantis All Equity Markets ETF, AVGV - Avantis All Equity Markets Value ETF, Atwood & Palmer Inc, Buckingham Strategic Partners, B&D White Capital Company, LLC, and Financial Advisory Service, Inc. .
Struktur kepemilikan institusional American Century ETF Trust - Avantis International Large Cap Value ETF (ARCA:AVIV) menunjukkan posisi terkini di perusahaan oleh institusi dan dana, serta perubahan terbaru dalam ukuran posisi. Pemegang saham utama dapat mencakup investor individu, reksa dana, dana lindung nilai, atau institusi. Jadwal 13D menunjukkan bahwa investor memegang (atau pernah memegang) lebih dari 5% saham perusahaan dan bermaksud (atau pernah bermaksud) untuk secara aktif mengejar perubahan strategi bisnis. Jadwal 13G menunjukkan investasi pasif lebih dari 5%.
The share price as of September 5, 2025 is 66.00 / share. Previously, on September 9, 2024, the share price was 53.65 / share. This represents an increase of 23.03% over that period.
Skor Sentimen Dana
Skor Sentimen Dana (sebelumnya dikenal sebagai Skor Akumulasi Kepemilikan) menemukan saham-saham yang paling banyak dibeli oleh dana. Ini adalah hasil dari model kuantitatif multi-faktor yang canggih yang mengidentifikasi perusahaan dengan tingkat akumulasi institusional tertinggi. Model penilaian menggunakan kombinasi dari total peningkatan pemilik yang diungkapkan, perubahan dalam alokasi portofolio pada pemilik tersebut, dan metrik lainnya. Angka berkisar dari 0 hingga 100, dengan angka yang lebih tinggi menunjukkan tingkat akumulasi yang lebih tinggi dibandingkan dengan perusahaan sejenisnya, dan 50 adalah rata-ratanya.
Frekuensi Pembaruan: Setiap Hari
Lihat Ownership Explorer, yang menyediakan daftar perusahaan dengan peringkat tertinggi.
Rasio Put/Call Institusional
Selain melaporkan isu ekuitas dan utang standar, institusi dengan aset di bawah manajemen lebih dari 100 juta dolar AS juga harus mengungkapkan kepemilikan opsi put dan call mereka. Karena opsi put umumnya menunjukkan sentimen negatif, dan opsi call menunjukkan sentimen positif, kita dapat mengetahui sentimen institusional secara keseluruhan dengan memplot rasio put terhadap call. Grafik di sebelah kanan memplot rasio put/call historis untuk instrumen ini.
Menggunakan Rasio Put/Call sebagai indikator sentimen investor mengatasi salah satu kekurangan utama dari penggunaan total kepemilikan institusional, yaitu sejumlah besar aset yang dikelola diinvestasikan secara pasif untuk melacak indeks. Dana yang dikelola secara pasif biasanya tidak membeli opsi, sehingga indikator rasio put/call lebih akurat dalam melacak sentimen dana yang dikelola secara aktif.
Pengajuan 13F dan NPORT
Detail pada pengajuan 13F tersedia gratis. Detail pada pengajuan NP memerlukan keanggotaan premium. Baris berwarna hijau menunjukkan posisi baru. Baris berwarna merah menunjukkan posisi yang sudah ditutup. Klik tautan ini ikon untuk melihat riwayat transaksi selengkapnya.
Tingkatkan
untuk membuka data premium dan mengekspor ke Excel ![]() .
.
| Tanggal File | Sumber | Investor | Ketik | Presyo ng Avg (Silangan) |
Saham | Δ Saham (%) |
Dilaporkan Nilai ($1000) |
Nilai Δ (%) |
Alokasi Port (%) |
|
|---|---|---|---|---|---|---|---|---|---|---|
| 2025-08-14 | 13F | Citadel Advisors Llc | 3,372 | -92.92 | 210 | -92.25 | ||||
| 2025-07-10 | 13F | Financial Management Network Inc | 95,950 | 13.88 | 6,008 | 40.64 | ||||
| 2025-07-28 | NP | AVGE - Avantis All Equity Markets ETF | 492,586 | 8.76 | 30,393 | 19.97 | ||||
| 2025-07-07 | 13F | Fox Hill Wealth Management | 7,069 | -1.05 | 440 | 8.66 | ||||
| 2025-08-14 | 13F | Beaird Harris Wealth Management, LLC | 123,963 | -1.10 | 7,715 | 8.59 | ||||
| 2025-07-10 | 13F | Websterrogers Financial Advisors, Llc | 207,757 | 1.75 | 12,930 | 11.73 | ||||
| 2025-08-13 | 13F | Greenwich Wealth Management LLC | 12,970 | 0.00 | 1 | |||||
| 2025-08-13 | 13F | Satovsky Asset Management Llc | 8,057 | 501 | ||||||
| 2025-08-13 | 13F | Cresset Asset Management, LLC | 0 | -100.00 | 0 | |||||
| 2025-08-12 | 13F | Pathstone Holdings, LLC | 15,947 | 1.83 | 992 | 11.84 | ||||
| 2025-07-21 | 13F | Life Planning Partners, Inc | 3,920 | 0.00 | 244 | 9.46 | ||||
| 2025-08-14 | 13F | Comerica Bank | 1,463 | 0.00 | 91 | 10.98 | ||||
| 2025-07-17 | 13F | Stone Point Wealth LLC | 9,518 | -9.94 | 592 | -1.00 | ||||
| 2025-07-14 | 13F | Harbor Group, Inc. | 23,877 | 147.79 | 1,486 | 171.98 | ||||
| 2025-08-11 | 13F | Ritter Daniher Financial Advisory LLC / DE | 23,597 | -10.91 | 1,469 | -2.20 | ||||
| 2025-07-28 | NP | AVNV - Avantis All International Markets Value ETF | 271,183 | 661.77 | 16,732 | 740.33 | ||||
| 2025-04-29 | 13F | Callan Capital, LLC | 26,949 | -1.70 | 1,527 | 7.38 | ||||
| 2025-08-13 | 13F | Jones Financial Companies Lllp | 141,107 | 122.77 | 8,761 | 142.08 | ||||
| 2025-08-15 | 13F | Keel Point, LLC | 6,669 | 0.59 | 415 | 10.67 | ||||
| 2025-08-01 | 13F | Zhang Financial LLC | 5,654 | 352 | ||||||
| 2025-07-24 | 13F | Etesian Wealth Advisors, Inc. | 6,268 | 0.00 | 390 | 9.86 | ||||
| 2025-08-04 | 13F | Haven Private, LLC | 57,275 | 18.16 | 3,565 | 29.74 | ||||
| 2025-08-04 | 13F | McMill Wealth Management | 37,249 | -7.21 | 2,318 | 1.85 | ||||
| 2025-08-04 | 13F | Linscomb & Williams, Inc. | 160,875 | 13.47 | 10,012 | 24.60 | ||||
| 2025-07-18 | 13F | TruNorth Capital Management, LLC | 1,202 | 0.00 | 75 | 8.82 | ||||
| 2025-07-28 | 13F | Harbour Investments, Inc. | 4,081 | 7.54 | 254 | 17.67 | ||||
| 2025-07-29 | 13F | Private Trust Co Na | 4,613 | 0.00 | 287 | 9.96 | ||||
| 2025-08-14 | 13F | Aqr Capital Management Llc | 29,127 | 0.00 | 1,813 | 9.82 | ||||
| 2025-08-14 | 13F | Susquehanna International Group, Llp | 8,734 | 544 | ||||||
| 2025-07-25 | 13F | Ruedi Wealth Management, Inc. | 0 | -100.00 | 0 | |||||
| 2025-08-14 | 13F | Navigoe, LLC | 60,780 | 7.41 | 4 | 0.00 | ||||
| 2025-08-08 | 13F | Tortoise Investment Management, LLC | 91,349 | 3.66 | 5,685 | 13.84 | ||||
| 2025-07-22 | 13F | Global Strategic Investment Solutions, LLC | 229,102 | -3.43 | 14,258 | 6.04 | ||||
| 2025-07-22 | 13F | SOL Capital Management CO | 9,120 | -1.62 | 1 | |||||
| 2025-07-15 | 13F | Financial Partners Group, Inc | 3,736 | 233 | ||||||
| 2025-07-14 | 13F | Northland Capital Management LLC | 98,318 | -7.45 | 6,119 | 1.61 | ||||
| 2025-07-16 | 13F | Plancorp, LLC | 48,325 | 1.98 | 3,008 | 11.99 | ||||
| 2025-08-13 | 13F | Flow Traders U.s. Llc | 0 | -100.00 | 0 | |||||
| 2025-08-12 | 13F | Pfc Capital Group, Inc. | 18,750 | 114.68 | 1 | |||||
| 2025-07-15 | 13F | Evanson Asset Management, LLC | 15,336 | 1.25 | 954 | 11.19 | ||||
| 2025-07-17 | 13F | Sterneck Capital Management, LLC | 3,674 | 229 | ||||||
| 2025-07-16 | 13F | TCI Wealth Advisors, Inc. | 4,028 | -1.13 | 251 | 8.70 | ||||
| 2025-05-13 | 13F | BlackDiamond Wealth Management Inc. | 0 | -100.00 | 0 | |||||
| 2025-07-17 | 13F | Porter White Investment Advisors, Inc. | 4,631 | 0.00 | 288 | 9.92 | ||||
| 2025-07-16 | 13F | Paragon Capital Management Ltd | 3,254 | 203 | ||||||
| 2025-08-05 | 13F | Cherry Tree Wealth Management, LLC | 1,130 | -5.36 | 70 | 4.48 | ||||
| 2025-08-08 | 13F | Pnc Financial Services Group, Inc. | 53 | 3 | ||||||
| 2025-08-13 | 13F | EverSource Wealth Advisors, LLC | 640 | 40 | ||||||
| 2025-07-30 | 13F | Canvas Wealth Advisors, LLC | 11,522 | 76.04 | 727 | 94.12 | ||||
| 2025-08-13 | 13F | Northwestern Mutual Wealth Management Co | 65,348 | -2.47 | 4,067 | 7.08 | ||||
| 2025-08-14 | 13F | UBS Group AG | 374 | 0.00 | 23 | 9.52 | ||||
| 2025-07-25 | 13F | PrairieView Partners, LLC | 1,064,106 | -1.75 | 66 | 8.20 | ||||
| 2025-07-10 | 13F | Wealth Enhancement Advisory Services, Llc | 13,633 | 95.85 | 854 | 116.50 | ||||
| 2025-07-31 | 13F | Buckingham Strategic Partners | 433,163 | 148.24 | 26,958 | 172.57 | ||||
| 2025-08-08 | 13F | Larson Financial Group LLC | 514 | 0.00 | 32 | 6.90 | ||||
| 2025-08-07 | 13F | Fonville Wealth Management LLC | 96,668 | 8.74 | 6,016 | 17.50 | ||||
| 2025-07-10 | 13F | Anderson Hoagland & Co | 54,351 | 11.38 | 3,383 | 37.87 | ||||
| 2025-07-10 | 13F | Fortress Wealth Management, Inc. | 5,069 | 35.53 | 316 | 49.29 | ||||
| 2025-07-17 | 13F | Symmetry Partners, LLC | 101,255 | 23.72 | 6,302 | 35.86 | ||||
| 2025-07-18 | 13F | Foundry Financial Group, Inc. | 234,500 | 28.33 | 14,594 | 40.91 | ||||
| 2025-07-03 | 13F | Collective Family Office Llc | 74,641 | 1.65 | 4,645 | 11.63 | ||||
| 2025-07-30 | 13F | TFB Advisors LLC | 5,920 | 0.00 | 368 | 9.85 | ||||
| 2025-07-28 | NP | AVMA - Avantis Moderate Allocation ETF | 18,330 | -7.15 | 1,131 | 2.36 | ||||
| 2025-07-28 | 13F | Dixon Fnancial Services, Inc. | 21,740 | 0.00 | 1,353 | 9.74 | ||||
| 2025-08-14 | 13F | Jane Street Group, Llc | 267,344 | 609.25 | 16,638 | 678.93 | ||||
| 2025-08-15 | 13F | Morgan Stanley | 3,369 | 248.40 | 210 | 287.04 | ||||
| 2025-08-13 | 13F | B&D White Capital Company, LLC | 283,748 | 105.70 | 17,659 | 125.88 | ||||
| 2025-07-28 | NP | AVGV - Avantis All Equity Markets Value ETF | 478,524 | 10.47 | 29,525 | 21.86 | ||||
| 2025-07-10 | 13F | Pacific Asset Management, LLC | 19,901 | 1.29 | 1,239 | 11.23 | ||||
| 2025-07-11 | 13F/A | Umb Bank N A/mo | 20,969 | 0.64 | 1,305 | 10.59 | ||||
| 2025-08-11 | 13F | Principal Securities, Inc. | 1,054 | -13.68 | 66 | 3.17 | ||||
| 2025-04-21 | 13F | Envestnet Portfolio Solutions, Inc. | 0 | -100.00 | 0 | |||||
| 2025-04-18 | 13F | Creative Capital Management Investments LLC | 0 | -100.00 | 0 | |||||
| 2025-07-03 | 13F | Lam Group, Inc. | 20,100 | 7.89 | 1,251 | 18.48 | ||||
| 2025-08-12 | 13F | LPL Financial LLC | 127,501 | 108.05 | 7,935 | 128.48 | ||||
| 2025-07-30 | 13F | Clune & Associates, Ltd. | 63,104 | 0.62 | 3,927 | 10.50 | ||||
| 2025-08-14 | 13F | Cardiff Park Advisors, Llc | 10,908 | 1.61 | 679 | 11.51 | ||||
| 2025-07-11 | 13F | Farther Finance Advisors, LLC | 227 | 0.00 | 14 | 16.67 | ||||
| 2025-07-29 | 13F | Chicago Partners Investment Group LLC | 95,044 | -0.46 | 6,125 | 8.64 | ||||
| 2025-07-24 | 13F | IFP Advisors, Inc | 100 | 0.00 | 6 | 20.00 | ||||
| 2025-08-12 | 13F | Burk Holdings LLC | 8,964 | 558 | ||||||
| 2025-08-08 | 13F | Creative Planning | 33,899 | 0.05 | 2,110 | 9.84 | ||||
| 2025-08-07 | 13F | Nwam Llc | 93,928 | -5.48 | 5,846 | 3.78 | ||||
| 2025-08-07 | 13F | CENTRAL TRUST Co | 1,890 | 118 | ||||||
| 2025-08-14 | 13F | Colony Group, LLC | 99,209 | 0.82 | 6,174 | 10.70 | ||||
| 2025-08-01 | 13F | Red Lighthouse Investment Management, Llc | 30 | 2 | ||||||
| 2025-07-29 | 13F | Werba Rubin Papier Wealth Management | 43,527 | -3.80 | 2,709 | 5.62 | ||||
| 2025-08-13 | 13F | Mayfair Advisory Group, LLC | 7,974 | 13.41 | 513 | 28.89 | ||||
| 2025-07-16 | 13F | Moisand Fitzgerald Tamayo, LLC | 10,208 | -10.70 | 635 | -1.85 | ||||
| 2025-08-12 | 13F | Proequities, Inc. | 0 | 0 | ||||||
| 2025-07-31 | 13F | Cambridge Investment Research Advisors, Inc. | 4,425 | 18.79 | 0 | |||||
| 2025-08-14 | 13F | Betterment LLC | 4,179 | 0 | ||||||
| 2025-08-05 | 13F | Astra Wealth Partners LLC | 14,900 | 0.00 | 927 | 9.83 | ||||
| 2025-07-11 | 13F | Prosperity Planning, Inc. | 51,656 | 12.08 | 3,215 | 23.05 | ||||
| 2025-08-12 | 13F | Jacobi Capital Management LLC | 23,121 | 11.36 | 1,439 | 22.28 | ||||
| 2025-05-15 | 13F | Gts Securities Llc | 0 | -100.00 | 0 | |||||
| 2025-08-08 | 13F | Austin Wealth Management, LLC | 189,173 | 35.47 | 11,774 | 45.48 | ||||
| 2025-08-06 | 13F | Entrewealth, Llc | 41,866 | 27.48 | 2,606 | 39.98 | ||||
| 2025-09-04 | 13F/A | Advisor Group Holdings, Inc. | 5,220 | 10.78 | 325 | 21.72 | ||||
| 2025-08-14 | 13F | Mml Investors Services, Llc | 6,703 | -4.79 | 0 | |||||
| 2025-07-25 | 13F | LRI Investments, LLC | 20,908 | 0.00 | 1,301 | 9.79 | ||||
| 2025-07-18 | 13F | PBMares Wealth Management LLC | 0 | -100.00 | 0 | |||||
| 2025-07-17 | 13F | Catalytic Wealth RIA, LLC | 13,184 | 45.28 | 821 | 59.53 | ||||
| 2025-07-31 | 13F | Brighton Jones Llc | 4,967 | 0.00 | 309 | 9.96 | ||||
| 2025-08-04 | 13F | Hantz Financial Services, Inc. | 469 | 0.00 | 0 | |||||
| 2025-07-16 | 13F | Meredith Wealth Planning | 18,151 | -11.56 | 1,130 | -2.92 | ||||
| 2025-08-14 | 13F | Raymond James Financial Inc | 13,669 | 851 | ||||||
| 2025-08-08 | 13F | Schwarz Dygos Wheeler Investment Advisors Llc | 6,984 | 9.38 | 435 | 20.22 | ||||
| 2025-07-09 | 13F | Emprise Bank | 4,765 | -6.24 | 297 | 2.78 | ||||
| 2025-08-12 | 13F | AlphaCore Capital LLC | 24,358 | 1,516 | ||||||
| 2025-07-31 | 13F | Oppenheimer & Co Inc | 8,176 | 22.36 | 509 | 34.39 | ||||
| 2025-07-17 | 13F | Oceanside Advisors LLC | 15,245 | 0.47 | 949 | 10.36 | ||||
| 2025-07-24 | 13F | Ronald Blue Trust, Inc. | 937 | 0.00 | 58 | 9.43 | ||||
| 2025-08-13 | 13F | IAG Wealth Partners, LLC | 539,447 | -0.62 | 33,572 | 9.12 | ||||
| 2025-08-14 | 13F | Royal Bank Of Canada | 741 | 46 | ||||||
| 2025-08-14 | 13F | Wells Fargo & Company/mn | 551 | 104.07 | 34 | 126.67 | ||||
| 2025-08-12 | 13F | Global Retirement Partners, LLC | 103 | 836.36 | 6 | |||||
| 2025-08-06 | 13F | Commonwealth Equity Services, Llc | 33,324 | 14.06 | 2 | 100.00 | ||||
| 2025-08-08 | 13F | Altiora Financial Group, LLC | 6,800 | 0.00 | 423 | 9.87 | ||||
| 2025-07-24 | 13F | WMG Financial Advisors, LLC | 4,600 | 0.00 | 286 | 10.00 | ||||
| 2025-05-16 | 13F/A | Kestra Investment Management, LLC | 0 | -100.00 | 0 | |||||
| 2025-08-12 | 13F | Prosperitas Financial LLC | 4,644 | 2.74 | 289 | 12.89 | ||||
| 2025-08-01 | 13F | Envestnet Asset Management Inc | 99,246 | 29.94 | 6,177 | 42.67 | ||||
| 2025-07-21 | 13F | Keb Asset Management, Llc | 9,736 | 606 | ||||||
| 2025-07-15 | 13F | Total Wealth Planning, Llc | 56,735 | -2.37 | 3,531 | 7.20 | ||||
| 2025-07-21 | 13F | Verus Financial Partners, Inc. | 13,825 | 1.81 | 871 | 15.06 | ||||
| 2025-08-12 | 13F | Nemes Rush Group LLC | 4,078 | 21.15 | 254 | 33.16 | ||||
| 2025-08-14 | 13F | Financial Advisory Service, Inc. | 280,322 | 2.58 | 17,446 | 12.64 | ||||
| 2025-07-10 | 13F | Cypress Point Wealth Management, LLC | 26,605 | -0.24 | 1,656 | 9.53 | ||||
| 2025-07-25 | 13F | Cwm, Llc | 11,734 | -1.80 | 1 | |||||
| 2025-08-15 | 13F | CI Private Wealth, LLC | 58,724 | 1,517.74 | 3,655 | 1,682.44 | ||||
| 2025-07-23 | 13F | Allegiance Financial Group Advisory Services LLC | 250,568 | 7.86 | 15,594 | 18.44 | ||||
| 2025-08-14 | 13F | Warren Averett Asset Management, LLC | 4,835 | 301 | ||||||
| 2025-08-07 | 13F | Tillman Hartley LLC | 24,584 | -0.52 | 1,530 | 9.21 | ||||
| 2025-08-21 | 13F | Aveo Capital Partners, LLC | 0 | -100.00 | 0 | |||||
| 2025-07-31 | 13F | Insight Wealth Partners, LLC | 11,713 | 8.42 | 729 | 18.95 | ||||
| 2025-08-06 | 13F | ORBA Wealth Advisors, L.L.C. | 34,071 | -19.90 | 2,120 | -12.03 | ||||
| 2025-08-07 | 13F | Addison Advisors LLC | 1,835 | -2.65 | 114 | 7.55 | ||||
| 2025-08-12 | 13F | Jpmorgan Chase & Co | 0 | -100.00 | 0 | |||||
| 2025-04-28 | 13F | Redmont Wealth Advisors Llc | 1,848 | -96.34 | 105 | -96.04 | ||||
| 2025-07-08 | 13F | Atwood & Palmer Inc | 468,898 | 2.78 | 29,182 | 12.86 | ||||
| 2025-07-30 | 13F | Forum Financial Management, LP | 4,789 | 0.00 | 298 | 9.96 | ||||
| 2025-08-12 | 13F | American Century Companies Inc | 2,126,943 | 54.81 | 132,370 | 69.98 | ||||
| 2025-07-23 | 13F | Wealth Management Nebraska | 80,463 | -0.06 | 4,996 | 9.47 | ||||
| 2025-07-10 | 13F | Wedmont Private Capital | 40,669 | 47.48 | 2,563 | 70.41 | ||||
| 2025-07-15 | 13F | Vestment Financial LLC | 45,390 | 4.69 | 2,838 | 15.23 | ||||
| 2025-08-05 | 13F | Golden Bell Financial Planning LLC | 114,272 | -6.88 | 7,112 | 2.24 | ||||
| 2025-05-06 | 13F | Venturi Wealth Management, LLC | 0 | -100.00 | 0 | |||||
| 2025-07-28 | NP | AVNM - Avantis All International Markets Equity ETF | 1,000,479 | 170.61 | 61,730 | 198.53 | ||||
| 2025-07-30 | 13F | Bayshore Asset Management, Llc | 119,335 | 2.33 | 7,427 | 12.36 | ||||
| 2025-08-07 | 13F | Atala Financial Inc | 3,340 | 0.00 | 208 | 9.52 |