Mga Batayang Estadistika
| Pemilik Institusional | 219 total, 219 long only, 0 short only, 0 long/short - change of -2.22% MRQ |
| Alokasi Portofolio Rata-rata | 0.0805 % - change of -3.14% MRQ |
| Saham Institusional (Jangka Panjang) | 32,561,276 (ex 13D/G) - change of -0.35MM shares -1.08% MRQ |
| Nilai Institusional (Jangka Panjang) | $ 271,105 USD ($1000) |
Kepemilikan Institusional dan Pemegang Saham
BlackRock Enhanced Equity Dividend Trust (US:BDJ) memiliki 219 pemilik institusional dan pemegang saham yang telah mengajukan formulir 13D/G atau 13F kepada Komisi Bursa Efek (Securities Exchange Commission/SEC). Lembaga-lembaga ini memegang total 32,561,276 saham. Pemegang saham terbesar meliputi Raymond James Financial Inc, Morgan Stanley, Wells Fargo & Company/mn, Invesco Ltd., PCEF - Invesco CEF Income Composite ETF, Guggenheim Capital Llc, LPL Financial LLC, Stifel Financial Corp, Advisors Asset Management, Inc., and Royal Bank Of Canada .
Struktur kepemilikan institusional BlackRock Enhanced Equity Dividend Trust (NYSE:BDJ) menunjukkan posisi terkini di perusahaan oleh institusi dan dana, serta perubahan terbaru dalam ukuran posisi. Pemegang saham utama dapat mencakup investor individu, reksa dana, dana lindung nilai, atau institusi. Jadwal 13D menunjukkan bahwa investor memegang (atau pernah memegang) lebih dari 5% saham perusahaan dan bermaksud (atau pernah bermaksud) untuk secara aktif mengejar perubahan strategi bisnis. Jadwal 13G menunjukkan investasi pasif lebih dari 5%.
The share price as of September 5, 2025 is 9.03 / share. Previously, on September 9, 2024, the share price was 8.43 / share. This represents an increase of 7.12% over that period.

Skor Sentimen Dana
Skor Sentimen Dana (sebelumnya dikenal sebagai Skor Akumulasi Kepemilikan) menemukan saham-saham yang paling banyak dibeli oleh dana. Ini adalah hasil dari model kuantitatif multi-faktor yang canggih yang mengidentifikasi perusahaan dengan tingkat akumulasi institusional tertinggi. Model penilaian menggunakan kombinasi dari total peningkatan pemilik yang diungkapkan, perubahan dalam alokasi portofolio pada pemilik tersebut, dan metrik lainnya. Angka berkisar dari 0 hingga 100, dengan angka yang lebih tinggi menunjukkan tingkat akumulasi yang lebih tinggi dibandingkan dengan perusahaan sejenisnya, dan 50 adalah rata-ratanya.
Frekuensi Pembaruan: Setiap Hari
Lihat Ownership Explorer, yang menyediakan daftar perusahaan dengan peringkat tertinggi.
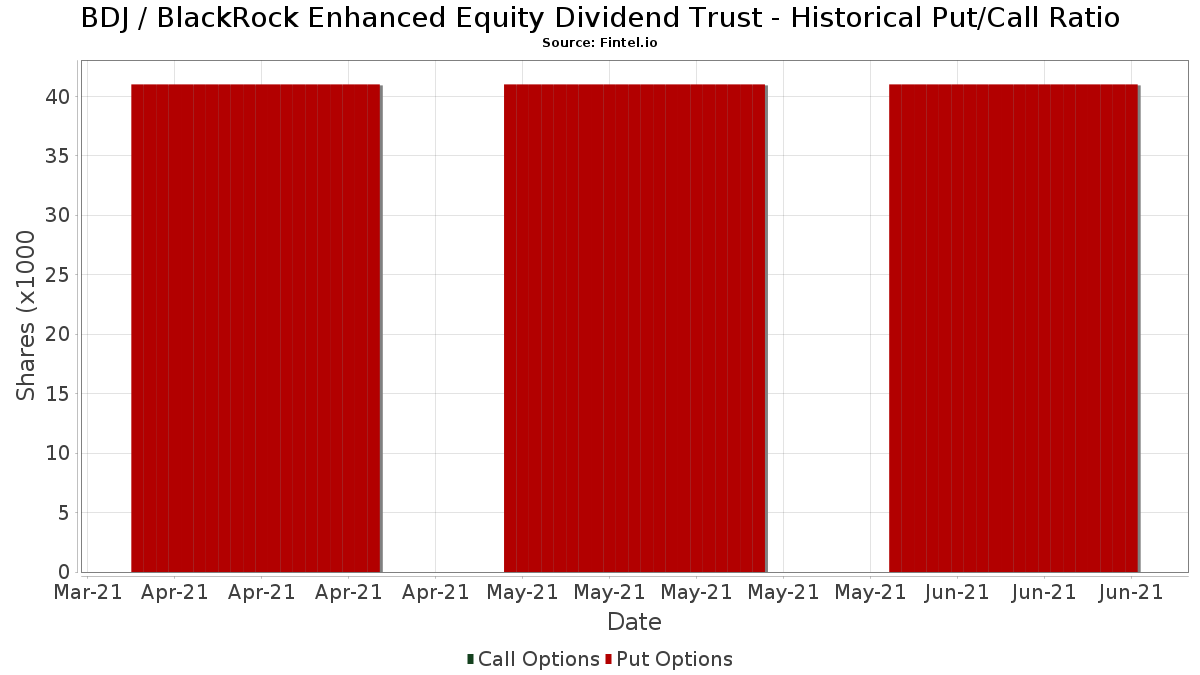
Rasio Put/Call Institusional
Selain melaporkan isu ekuitas dan utang standar, institusi dengan aset di bawah manajemen lebih dari 100 juta dolar AS juga harus mengungkapkan kepemilikan opsi put dan call mereka. Karena opsi put umumnya menunjukkan sentimen negatif, dan opsi call menunjukkan sentimen positif, kita dapat mengetahui sentimen institusional secara keseluruhan dengan memplot rasio put terhadap call. Grafik di sebelah kanan memplot rasio put/call historis untuk instrumen ini.
Menggunakan Rasio Put/Call sebagai indikator sentimen investor mengatasi salah satu kekurangan utama dari penggunaan total kepemilikan institusional, yaitu sejumlah besar aset yang dikelola diinvestasikan secara pasif untuk melacak indeks. Dana yang dikelola secara pasif biasanya tidak membeli opsi, sehingga indikator rasio put/call lebih akurat dalam melacak sentimen dana yang dikelola secara aktif.
Pengajuan 13F dan NPORT
Detail pada pengajuan 13F tersedia gratis. Detail pada pengajuan NP memerlukan keanggotaan premium. Baris berwarna hijau menunjukkan posisi baru. Baris berwarna merah menunjukkan posisi yang sudah ditutup. Klik tautan ini ikon untuk melihat riwayat transaksi selengkapnya.
Tingkatkan
untuk membuka data premium dan mengekspor ke Excel ![]() .
.
| Tanggal File | Sumber | Investor | Ketik | Presyo ng Avg (Silangan) |
Saham | Δ Saham (%) |
Dilaporkan Nilai ($1000) |
Nilai Δ (%) |
Alokasi Port (%) |
|
|---|---|---|---|---|---|---|---|---|---|---|
| 2025-08-12 | 13F | Franklin Resources Inc | 12,493 | 11.43 | 111 | 15.63 | ||||
| 2025-07-11 | 13F | Farther Finance Advisors, LLC | 63,168 | 0.00 | 562 | 2.94 | ||||
| 2025-08-05 | 13F | Fourth Dimension Wealth, LLC | 18 | 0.00 | 0 | |||||
| 2025-08-13 | 13F | Dana Investment Advisors, Inc. | 10,330 | 0.00 | 92 | 3.41 | ||||
| 2025-05-15 | 13F | Cohen & Steers, Inc. | 0 | -100.00 | 0 | |||||
| 2025-08-07 | 13F | Hennion & Walsh Asset Management, Inc. | 316,690 | 9.22 | 2,815 | 12.92 | ||||
| 2025-08-14 | 13F | IHT Wealth Management, LLC | 127,615 | -1.21 | 1,134 | 2.16 | ||||
| 2025-07-22 | 13F | DAVENPORT & Co LLC | 34,146 | 0.00 | 304 | 3.41 | ||||
| 2025-08-07 | 13F | Commerce Bank | 13,846 | 0.00 | 123 | 3.36 | ||||
| 2025-08-27 | NP | THRIVENT SERIES FUND INC - Thrivent Balanced Income Plus Portfolio Class A | 1,042 | 0.00 | 9 | 12.50 | ||||
| 2025-08-15 | 13F | Prevail Innovative Wealth Advisors, Llc | 161,257 | 8.20 | 1,434 | 11.87 | ||||
| 2025-05-22 | NP | ADANX - AQR Diversified Arbitrage Fund Class N | 58,944 | -61.84 | 507 | -60.44 | ||||
| 2025-08-14 | 13F | Mariner, LLC | 30,320 | 108.44 | 270 | 115.20 | ||||
| 2025-07-21 | 13F | Hilltop National Bank | 0 | -100.00 | 0 | |||||
| 2025-04-08 | 13F | Parallel Advisors, LLC | 0 | -100.00 | 0 | |||||
| 2025-09-04 | 13F/A | Advisor Group Holdings, Inc. | 401,644 | 15.64 | 3,571 | 19.56 | ||||
| 2025-07-14 | 13F | AdvisorNet Financial, Inc | 1,466 | 0.00 | 13 | 8.33 | ||||
| 2025-08-07 | 13F | Montag A & Associates Inc | 466 | 0.00 | 4 | 0.00 | ||||
| 2025-08-12 | 13F | BlackRock, Inc. | 14,000 | 0.00 | 124 | 3.33 | ||||
| 2025-08-13 | 13F | Transce3nd, LLC | 3 | 0 | ||||||
| 2025-08-13 | 13F | Northern Trust Corp | 22,101 | 0.71 | 196 | 4.26 | ||||
| 2025-07-25 | 13F | Atria Wealth Solutions, Inc. | 20,818 | -67.34 | 185 | -66.24 | ||||
| 2025-08-13 | 13F | WCG Wealth Advisors LLC | 55,600 | 65.07 | 494 | 70.93 | ||||
| 2025-08-13 | 13F | Jones Financial Companies Lllp | 0 | -100.00 | 0 | |||||
| 2025-07-10 | 13F | Wealth Enhancement Advisory Services, Llc | 104,528 | -9.46 | 940 | -5.34 | ||||
| 2025-08-01 | 13F | Transcend Wealth Collective, Llc | 11,473 | 102 | ||||||
| 2025-07-21 | 13F | Ameritas Advisory Services, LLC | 20,919 | -30.00 | 186 | -25.10 | ||||
| 2025-08-05 | 13F | Plante Moran Financial Advisors, LLC | 346 | 14.95 | 3 | 50.00 | ||||
| 2025-05-14 | 13F | Jane Street Group, Llc | 0 | -100.00 | 0 | |||||
| 2025-07-28 | 13F | Sterling Financial Planning, Inc. | 13,831 | 0.00 | 123 | 3.39 | ||||
| 2025-07-17 | 13F | City Holding Co | 1,462 | -73.48 | 13 | -74.47 | ||||
| 2025-08-04 | 13F | Wolverine Asset Management Llc | 30,766 | 274 | ||||||
| 2025-08-18 | 13F | Tyler-Stone Wealth Management | 68,125 | 3.09 | 606 | 6.51 | ||||
| 2025-07-10 | 13F | Stolper Co | 63,671 | 2.87 | 1 | |||||
| 2025-08-13 | 13F | Walleye Capital LLC | 25,440 | 226 | ||||||
| 2025-07-31 | 13F | Gill Capital Partners, Llc | 15,383 | 0.00 | 137 | 3.03 | ||||
| 2025-07-31 | 13F | Optimum Investment Advisors | 1,198 | 0.00 | 11 | 0.00 | ||||
| 2025-08-14 | 13F | Royal Bank Of Canada | 838,645 | -1.96 | 7,455 | 1.35 | ||||
| 2025-08-05 | 13F | Shaker Financial Services, LLC | 627,929 | 128.08 | 5,582 | 135.83 | ||||
| 2025-08-11 | 13F | Mosaic Family Wealth Partners, Llc | 12,236 | 0.00 | 109 | 2.86 | ||||
| 2025-08-14 | 13F | Monograph Wealth Advisors, Llc | 37,925 | 337 | ||||||
| 2025-07-15 | 13F | North Star Investment Management Corp. | 7,266 | 0.00 | 65 | 3.23 | ||||
| 2025-08-04 | 13F | ELCO Management Co., LLC | 27,663 | -6.27 | 246 | -3.16 | ||||
| 2025-08-13 | 13F | Baird Financial Group, Inc. | 265,090 | 0.23 | 2,357 | 3.61 | ||||
| 2025-08-14 | 13F | Integrated Wealth Concepts LLC | 27,570 | 2.56 | 245 | 6.06 | ||||
| 2025-08-14 | 13F | Wharton Business Group, LLC | 19,004 | 0.00 | 0 | |||||
| 2025-07-17 | 13F | Janney Montgomery Scott LLC | 352,754 | 16.52 | 3 | 50.00 | ||||
| 2025-08-04 | 13F | Keybank National Association/oh | 11,000 | 0.00 | 98 | 3.19 | ||||
| 2025-08-18 | 13F | Brick & Kyle, Associates | 44,174 | -1.02 | 0 | |||||
| 2025-06-27 | NP | Calamos ETF Trust - Calamos CEF Income & Arbitrage ETF | 27,227 | 27.06 | 225 | 19.15 | ||||
| 2025-08-14 | 13F | Becker Capital Management Inc | 18,811 | 0.00 | 167 | 3.73 | ||||
| 2025-08-12 | 13F | NWF Advisory Services Inc. | 44,084 | 379 | ||||||
| 2025-05-21 | 13F/A | Geneos Wealth Management Inc. | 0 | -100.00 | 0 | -100.00 | ||||
| 2025-07-29 | 13F | Regions Financial Corp | 49,454 | 7.98 | 440 | 11.70 | ||||
| 2025-07-29 | 13F | International Assets Investment Management, Llc | 39,766 | 3.44 | 354 | 6.97 | ||||
| 2025-07-31 | 13F | Boothe Investment Group, Inc. | 480,964 | 1.25 | 4,276 | 4.65 | ||||
| 2025-08-12 | 13F | South Plains Financial, Inc. | 0 | -100.00 | 0 | |||||
| 2025-08-14 | 13F | Icon Wealth Advisors, LLC | 14,521 | 2.17 | 129 | 5.74 | ||||
| 2025-08-15 | 13F | Morgan Stanley | 3,418,226 | -1.34 | 30,388 | 1.99 | ||||
| 2025-07-17 | 13F | Eagle Wealth Strategies Llc | 15,090 | 0.00 | 134 | 3.88 | ||||
| 2025-08-04 | 13F | Saxony Capital Management, LLC | 43,531 | -4.97 | 387 | -1.78 | ||||
| 2025-08-12 | 13F | Virtu Financial LLC | 0 | -100.00 | 0 | |||||
| 2025-07-11 | 13F | Quad-Cities Investment Group, LLC | 0 | -100.00 | 0 | |||||
| 2025-07-14 | 13F | Armstrong Advisory Group, Inc | 1,208 | 11 | ||||||
| 2025-07-24 | 13F | Endeavor Private Wealth, Inc. | 12,210 | 0.00 | 109 | 2.86 | ||||
| 2025-07-31 | 13F | Cambridge Investment Research Advisors, Inc. | 124,285 | -29.71 | 1 | 0.00 | ||||
| 2025-08-14 | 13F | EP Wealth Advisors, Inc. | 0 | -100.00 | 0 | |||||
| 2025-08-04 | 13F | Bay Colony Advisory Group, Inc d/b/a Bay Colony Advisors | 35,040 | -1.46 | 312 | 1.30 | ||||
| 2025-07-29 | 13F | Mezzasalma Advisors, LLC | 43,144 | -3.26 | 384 | 0.00 | ||||
| 2025-08-11 | 13F | Shufro Rose & Co Llc | 41,862 | -1.88 | 360 | -1.64 | ||||
| 2025-04-22 | 13F | Atticus Wealth Management, Llc | 0 | 0 | ||||||
| 2025-07-14 | 13F | Park Avenue Securities Llc | 51,734 | 17.00 | 0 | |||||
| 2025-08-14 | 13F | Heritage Wealth Management, Inc. | 16,250 | -9.72 | 144 | -6.49 | ||||
| 2025-07-28 | NP | PCEF - Invesco CEF Income Composite ETF This fund is a listed as child fund of Invesco Ltd. and if that institution has disclosed ownership in this security, then these positions will not be double counted when calculating total shares and total value | 2,181,304 | -2.22 | 18,672 | -6.38 | ||||
| 2025-08-13 | 13F | Invesco Ltd. | 2,312,750 | 5.61 | 20,560 | 9.18 | ||||
| 2025-08-25 | 13F | Silverlake Wealth Management Llc | 11,931 | -15.90 | 106 | -13.11 | ||||
| 2025-08-13 | 13F | Level Four Advisory Services, Llc | 13,538 | 0.59 | 120 | 4.35 | ||||
| 2025-05-14 | 13F | Landscape Capital Management, L.l.c. | 0 | -100.00 | 0 | |||||
| 2025-08-06 | 13F | Moors & Cabot, Inc. | 17,000 | -0.96 | 151 | 2.72 | ||||
| 2025-07-17 | 13F | Sound Income Strategies, LLC | 1,629 | 0.00 | 14 | 0.00 | ||||
| 2025-08-11 | 13F | HighTower Advisors, LLC | 35,925 | -4.83 | 319 | -1.54 | ||||
| 2025-08-14 | 13F | Karpus Management, Inc. | 125,304 | -79.48 | 1,114 | -78.80 | ||||
| 2025-07-28 | 13F | Harbour Investments, Inc. | 3,010 | 49.75 | 27 | 52.94 | ||||
| 2025-08-04 | 13F | Live Oak Private Wealth LLC | 10,525 | 0.00 | 94 | 3.33 | ||||
| 2025-08-14 | 13F | UBS Group AG | 667,399 | -14.36 | 5,933 | -11.47 | ||||
| 2025-08-11 | 13F | Elequin Capital Lp | 0 | -100.00 | 0 | |||||
| 2025-07-24 | 13F | Aurora Private Wealth, Inc. | 19,657 | 1.70 | 0 | |||||
| 2025-07-30 | 13F | OMC Financial Services LTD | 66,980 | -1.33 | 595 | 2.06 | ||||
| 2025-07-08 | 13F | Allen Mooney & Barnes Investment Advisors LLC | 13,419 | 0.55 | 119 | 4.39 | ||||
| 2025-07-25 | 13F | Concurrent Investment Advisors, LLC | 11,768 | 0.44 | 105 | 4.00 | ||||
| 2025-08-14 | 13F | Warren Averett Asset Management, LLC | 110,799 | -2.03 | 985 | 1.34 | ||||
| 2025-08-12 | 13F | Wood Tarver Financial Group, LLC | 1,087 | 0.00 | 0 | -100.00 | ||||
| 2025-08-07 | 13F | Vista Investment Partners Ii, Llc | 23,756 | 37.25 | 211 | 42.57 | ||||
| 2025-08-15 | 13F | Tower Research Capital LLC (TRC) | 21 | 0 | ||||||
| 2025-04-24 | 13F | Bartlett & Co. Wealth Management Llc | 0 | -100.00 | 0 | |||||
| 2025-08-14 | 13F | Diversify Advisory Services, LLC | 10,301 | 0.00 | 92 | 7.06 | ||||
| 2025-07-29 | 13F | Stephens Inc /ar/ | 16,076 | -10.51 | 143 | -7.79 | ||||
| 2025-07-25 | 13F | Northwest Capital Management Inc | 0 | -100.00 | 0 | |||||
| 2025-08-12 | 13F | CIBC Private Wealth Group, LLC | 14,944 | 0.56 | 133 | 16.81 | ||||
| 2025-08-14 | 13F | Widmann Financial Services, Inc. | 22,767 | 0.03 | 202 | 3.59 | ||||
| 2025-08-14 | 13F | Ameriprise Financial Inc | 293,705 | -5.73 | 2,611 | -2.57 | ||||
| 2025-08-12 | 13F | MAI Capital Management | 6,997 | 50.28 | 62 | 55.00 | ||||
| 2025-04-21 | 13F | Institute for Wealth Management, LLC. | 0 | -100.00 | 0 | |||||
| 2025-06-30 | 13F/A | Deutsche Bank Ag\ | 0 | -100.00 | 0 | |||||
| 2025-08-12 | 13F | Jpmorgan Chase & Co | 1,242 | 123.78 | 11 | 175.00 | ||||
| 2025-08-14 | 13F | Bank Of America Corp /de/ | 632,952 | 14.95 | 5,627 | 18.82 | ||||
| 2025-08-14 | 13F | MGB Wealth Management, LLC | 50,369 | -47.39 | 448 | -44.68 | ||||
| 2025-05-02 | 13F | Capital A Wealth Management, LLC | 559 | -11.13 | 5 | -20.00 | ||||
| 2025-07-24 | 13F | Costello Asset Management, INC | 1,520 | 2.22 | 14 | 8.33 | ||||
| 2025-08-04 | 13F | Creekmur Asset Management LLC | 12,502 | 66.47 | 111 | 73.44 | ||||
| 2025-07-17 | 13F | XML Financial, LLC | 17,872 | -12.27 | 159 | -9.71 | ||||
| 2025-08-14 | 13F | Two Sigma Investments, Lp | 76,025 | 676 | ||||||
| 2025-08-12 | 13F | Financial Advocates Investment Management | 0 | -100.00 | 0 | |||||
| 2025-04-29 | 13F | CoreFirst Bank & Trust | 0 | -100.00 | 0 | |||||
| 2025-07-15 | 13F | Fortitude Family Office, LLC | 7,619 | 318.86 | 68 | 346.67 | ||||
| 2025-08-08 | 13F | CFO4Life Group, LLC | 24,614 | 2.19 | 219 | 5.31 | ||||
| 2025-08-06 | 13F | Commonwealth Equity Services, Llc | 602,737 | 2.98 | 5 | 0.00 | ||||
| 2025-07-11 | 13F | Kapstone Financial Advisors LLC | 24,961 | 37.44 | 222 | 41.67 | ||||
| 2025-08-01 | 13F | Corrado Advisors, Llc | 28,305 | 0.00 | 252 | 3.29 | ||||
| 2025-07-07 | 13F | Centurion Wealth Management LLC | 113,615 | 2.26 | 1,010 | 9.90 | ||||
| 2025-08-13 | 13F | StoneX Group Inc. | 58,458 | -2.83 | 520 | 0.39 | ||||
| 2025-07-17 | 13F | Venture Visionary Partners LLC | 36,830 | -4.86 | 327 | -1.51 | ||||
| 2025-08-04 | 13F | Roble, Belko & Company, Inc | 27,278 | 0.00 | 0 | |||||
| 2025-08-27 | NP | AAHYX - Thrivent Diversified Income Plus Fund Class A | 4,227 | 0.00 | 38 | 2.78 | ||||
| 2025-08-14 | 13F | Two Sigma Securities, Llc | 0 | -100.00 | 0 | |||||
| 2025-07-11 | 13F | Seacrest Wealth Management, Llc | 21,911 | 1.35 | 195 | 4.86 | ||||
| 2025-08-11 | 13F | Avantax Planning Partners, Inc. | 49,635 | 0.00 | 441 | 3.52 | ||||
| 2025-08-13 | 13F | Guggenheim Capital Llc | 2,093,323 | 2.40 | 18,610 | 5.86 | ||||
| 2025-07-28 | 13F | Axxcess Wealth Management, Llc | 38,953 | 0.23 | 346 | 3.59 | ||||
| 2025-07-07 | 13F | Trust Co | 0 | -100.00 | 0 | |||||
| 2025-08-06 | 13F | Penserra Capital Management LLC | 614,307 | 3.05 | 5 | 0.00 | ||||
| 2025-08-13 | 13F | Cerity Partners LLC | 388,646 | 3,451 | ||||||
| 2025-08-15 | 13F | Captrust Financial Advisors | 35,814 | 1.20 | 318 | 4.61 | ||||
| 2025-08-12 | 13F | Bokf, Na | 0 | -100.00 | 0 | |||||
| 2025-08-27 | NP | THRIVENT SERIES FUND INC - Thrivent Opportunity Income Plus Portfolio Class A | 2,551 | 0.00 | 23 | 4.76 | ||||
| 2025-08-12 | 13F | Advisors Asset Management, Inc. | 1,045,061 | -2.72 | 9,291 | 0.56 | ||||
| 2025-08-08 | 13F | Hartland & Co., LLC | 750 | 0.00 | 7 | 0.00 | ||||
| 2025-07-25 | 13F | Allspring Global Investments Holdings, LLC | 163,153 | -42.31 | 1,450 | -40.38 | ||||
| 2025-05-09 | 13F | Goldman Sachs Group Inc | 0 | -100.00 | 0 | |||||
| 2025-05-14 | 13F | Van Hulzen Asset Management, LLC | 0 | -100.00 | 0 | |||||
| 2025-07-31 | 13F | Oak Harbor Wealth Partners, Llc | 21,139 | 0.00 | 188 | 3.31 | ||||
| 2025-08-07 | 13F | Readystate Asset Management Lp | 14,015 | 125 | ||||||
| 2025-08-05 | 13F | Palogic Value Management, L.P. | 57,000 | 0.00 | 507 | 3.27 | ||||
| 2025-08-13 | 13F | Cresset Asset Management, LLC | 16,060 | 0.00 | 143 | 2.90 | ||||
| 2025-07-21 | 13F | Crews Bank & Trust | 0 | -100.00 | 0 | |||||
| 2025-08-01 | 13F | Envestnet Asset Management Inc | 40,978 | 6.09 | 364 | 9.64 | ||||
| 2025-08-14 | 13F | CoreCap Advisors, LLC | 0 | -100.00 | 0 | |||||
| 2025-07-25 | 13F | We Are One Seven, LLC | 32,763 | -70.64 | 291 | -69.66 | ||||
| 2025-08-14 | 13F | GWM Advisors LLC | 44,694 | 11.30 | 397 | 15.07 | ||||
| 2025-08-14 | 13F | Smartleaf Asset Management LLC | 2,200 | 0.00 | 19 | 0.00 | ||||
| 2025-08-08 | 13F | Calamos Advisors LLC | 45,724 | 121.92 | 406 | 129.38 | ||||
| 2025-05-02 | 13F | Transcendent Capital Group LLC | 0 | -100.00 | 0 | |||||
| 2025-07-30 | 13F | Cullen/frost Bankers, Inc. | 7,415 | 0.00 | 66 | 3.17 | ||||
| 2025-08-07 | 13F | Kestra Private Wealth Services, Llc | 18,309 | 7.46 | 163 | 10.96 | ||||
| 2025-08-14 | 13F | Cnh Partners Llc | 0 | -100.00 | 0 | |||||
| 2025-07-09 | 13F | Pallas Capital Advisors LLC | 13,458 | 0.00 | 120 | 3.48 | ||||
| 2025-08-04 | 13F | Assetmark, Inc | 46 | 0.00 | 0 | |||||
| 2025-08-14 | 13F | Wells Fargo & Company/mn | 2,549,218 | -22.75 | 22,663 | -20.14 | ||||
| 2025-08-15 | 13F | First Heartland Consultants, Inc. | 11,883 | 106 | ||||||
| 2025-08-13 | 13F | WealthTrust Axiom LLC | 97,206 | -7.31 | 864 | -4.11 | ||||
| 2025-08-11 | 13F | Blue Bell Private Wealth Management, Llc | 1,200 | 11 | ||||||
| 2025-07-28 | 13F | Wealthspan Partners, Llc | 26,155 | 1.16 | 233 | 4.50 | ||||
| 2025-08-26 | 13F/A | Thrivent Financial For Lutherans | 48,389 | 35.13 | 0 | |||||
| 2025-08-14 | 13F | Mml Investors Services, Llc | 10,521 | 0 | ||||||
| 2025-07-21 | 13F | Ameriflex Group, Inc. | 0 | -100.00 | 0 | |||||
| 2025-08-07 | 13F | Parkside Financial Bank & Trust | 1,000 | 9 | ||||||
| 2025-08-12 | 13F | Cook Wealth Management Group Llc | 0 | -100.00 | 0 | |||||
| 2025-04-09 | 13F | 180 Wealth Advisors, Llc | 0 | -100.00 | 0 | -100.00 | ||||
| 2025-08-19 | 13F | National Asset Management, Inc. | 0 | -100.00 | 0 | |||||
| 2025-08-04 | 13F | Kovack Advisors, Inc. | 10,200 | 91 | ||||||
| 2025-08-05 | 13F | GPS Wealth Strategies Group, LLC | 3,200 | 0.00 | 28 | 3.70 | ||||
| 2025-08-11 | 13F | Principal Securities, Inc. | 22,352 | -22.26 | 199 | -16.81 | ||||
| 2025-07-07 | 13F | Capital Asset Advisory Services LLC | 20,106 | 0.00 | 179 | 3.47 | ||||
| 2025-07-16 | 13F | Perigon Wealth Management, LLC | 11,767 | 0.00 | 105 | 2.97 | ||||
| 2025-08-13 | 13F | Rsm Us Wealth Management Llc | 13,044 | -6.07 | 116 | -3.36 | ||||
| 2025-08-14 | 13F | K2 Principal Fund, L.p. | 32,984 | 0.00 | 293 | 3.53 | ||||
| 2025-08-14 | 13F | Susquehanna International Group, Llp | 66,764 | 564.32 | 594 | 589.53 | ||||
| 2025-07-08 | 13F | Nbc Securities, Inc. | 34,509 | 0.79 | 0 | |||||
| 2025-07-16 | 13F | Investment Partners Asset Management, Inc. | 46,079 | -0.40 | 410 | 3.02 | ||||
| 2025-05-15 | 13F | Hrt Financial Lp | 0 | -100.00 | 0 | |||||
| 2025-07-23 | 13F | Kingswood Wealth Advisors, Llc | 117,791 | 0.00 | 1,047 | 3.36 | ||||
| 2025-08-15 | 13F | Kestra Advisory Services, LLC | 64,942 | 4.20 | 577 | 7.85 | ||||
| 2025-08-08 | 13F | Creative Planning | 15,520 | -60.30 | 138 | -59.23 | ||||
| 2025-08-11 | 13F | Wealthspire Advisors, LLC | 48,787 | 0.00 | 434 | 3.34 | ||||
| 2025-08-08 | 13F | Pnc Financial Services Group, Inc. | 18,142 | -59.07 | 161 | -57.74 | ||||
| 2025-05-12 | 13F | Independent Advisor Alliance | 0 | -100.00 | 0 | |||||
| 2025-07-21 | 13F | Ashton Thomas Securities, Llc | 74,426 | -2.10 | 662 | 1.23 | ||||
| 2025-08-13 | 13F | Northwestern Mutual Wealth Management Co | 1,497 | -88.70 | 13 | -88.50 | ||||
| 2025-08-01 | 13F | Ashton Thomas Private Wealth, LLC | 13,099 | 2.20 | 116 | 5.45 | ||||
| 2025-08-13 | 13F | Summit Financial, LLC | 35,714 | 317 | ||||||
| 2025-07-17 | 13F | Jackson, Grant Investment Advisers, Inc. | 49,313 | 1.55 | 438 | 5.04 | ||||
| 2025-08-05 | 13F | Claro Advisors LLC | 49,011 | 100.80 | 436 | 108.13 | ||||
| 2025-08-13 | 13F | Brown Advisory Inc | 33,757 | -3.92 | 300 | -0.66 | ||||
| 2025-08-14 | 13F | Sunbelt Securities, Inc. | 22,134 | 153.25 | 183 | 144.00 | ||||
| 2025-08-14 | 13F | Comerica Bank | 32,620 | 8.21 | 290 | 11.58 | ||||
| 2025-07-18 | 13F | Truist Financial Corp | 57,934 | 1.89 | 515 | 5.53 | ||||
| 2025-05-08 | 13F | Private Advisory Group LLC | 0 | -100.00 | 0 | -100.00 | ||||
| 2025-07-15 | 13F | Shulman DeMeo Asset Management LLC | 137,062 | -3.20 | 1,218 | 0.08 | ||||
| 2025-08-06 | 13F | Wedbush Securities Inc | 17,827 | 9.73 | 0 | |||||
| 2025-08-14 | 13F | Stifel Financial Corp | 1,103,771 | -0.88 | 9,813 | 2.46 | ||||
| 2025-08-12 | 13F | SRS Capital Advisors, Inc. | 183 | 0.00 | 2 | 0.00 | ||||
| 2025-05-15 | 13F | Gwn Securities Inc. | 0 | -100.00 | 0 | |||||
| 2025-07-24 | 13F | Eastern Bank | 0 | -100.00 | 0 | |||||
| 2025-08-27 | NP | THRIVENT SERIES FUND INC - Thrivent Diversified Income Plus Portfolio Class A | 2,666 | 0.00 | 24 | 4.55 | ||||
| 2025-08-07 | 13F | Allworth Financial LP | 45,276 | 3,319.64 | 403 | 3,920.00 | ||||
| 2025-07-16 | 13F | Plancorp, LLC | 22,000 | 0.00 | 196 | 3.17 | ||||
| 2025-08-11 | 13F | Private Advisor Group, LLC | 46,507 | 0.79 | 413 | 4.29 | ||||
| 2025-08-27 | NP | RYMSX - Guggenheim Multi-Hedge Strategies Fund Class P | 215 | 194.52 | 2 | |||||
| 2025-07-16 | 13F | Dakota Wealth Management | 31,786 | -6.53 | 283 | -3.42 | ||||
| 2025-08-18 | 13F | Hollencrest Capital Management | 1,013 | 0.00 | 9 | 12.50 | ||||
| 2025-05-15 | 13F | Parvin Asset Management, LLC | 0 | -100.00 | 0 | |||||
| 2025-07-24 | 13F | Comprehensive Money Management Services LLC | 18,664 | -5.25 | 166 | -2.37 | ||||
| 2025-08-28 | NP | YYY - Amplify High Income ETF | 608,047 | 2.00 | 5,406 | 5.44 | ||||
| 2025-05-07 | 13F | Sheaff Brock Investment Advisors, LLC | 18,234 | -0.07 | 157 | 3.31 | ||||
| 2025-08-19 | 13F | Cape Investment Advisory, Inc. | 9,293 | 0.00 | 83 | 3.80 | ||||
| 2025-08-14 | 13F | Mercer Global Advisors Inc /adv | 39,021 | -23.18 | 347 | -20.64 | ||||
| 2025-07-14 | 13F | Sowell Financial Services LLC | 10,694 | -21.15 | 95 | -18.10 | ||||
| 2025-07-16 | 13F | Cove Private Wealth, LLC | 45,237 | 0.00 | 402 | 3.34 | ||||
| 2025-07-15 | 13F | Fifth Third Bancorp | 0 | -100.00 | 0 | |||||
| 2025-08-14 | 13F | Citadel Advisors Llc | 0 | -100.00 | 0 | |||||
| 2025-07-29 | 13F | Stratos Wealth Partners, LTD. | 61,212 | 238.81 | 544 | 250.97 | ||||
| 2025-06-26 | NP | AABFX - Thrivent Balanced Income Plus Fund Class A | 1,075 | 0.00 | 9 | -11.11 | ||||
| 2025-07-16 | 13F | Spirepoint Private Client, Llc | 10,939 | 0.00 | 97 | 3.19 | ||||
| 2025-08-12 | 13F | Proequities, Inc. | 0 | 0 | ||||||
| 2025-08-27 | NP | RYDEX VARIABLE TRUST - Multi-Hedge Strategies Fund Variable Annuity | 362 | 277.08 | 3 | |||||
| 2025-08-12 | 13F | Steward Partners Investment Advisory, Llc | 274,704 | 8.11 | 2,442 | 11.76 | ||||
| 2025-08-14 | 13F/A | Rockefeller Capital Management L.P. | 94,515 | 6.37 | 840 | 9.95 | ||||
| 2025-08-11 | 13F | Nations Financial Group Inc, /ia/ /adv | 18,946 | -17.81 | 168 | -15.15 | ||||
| 2025-07-17 | 13F | Saxon Interests, Inc. | 40,245 | 0.00 | 346 | 0.00 | ||||
| 2025-08-14 | 13F | Benjamin Edwards Inc | 20,484 | 182 | ||||||
| 2025-07-25 | 13F | Community Bank, N.A. | 1,167 | 10 | ||||||
| 2025-08-04 | 13F | Waterfront Wealth Inc. | 690,657 | 7.16 | 6,140 | 10.77 | ||||
| 2025-05-15 | 13F | WPG Advisers, LLC | 0 | -100.00 | 0 | -100.00 | ||||
| 2025-07-24 | 13F | IFP Advisors, Inc | 906 | -52.47 | 8 | -50.00 | ||||
| 2025-08-11 | 13F | Brown Brothers Harriman & Co | 7,147 | 64 | ||||||
| 2025-04-08 | 13F | Investors Research Corp | 0 | -100.00 | 0 | |||||
| 2025-07-11 | 13F | Pinnacle Bancorp, Inc. | 3,400 | 30 | ||||||
| 2025-08-11 | 13F | Hexagon Capital Partners LLC | 0 | -100.00 | 0 | |||||
| 2025-08-12 | 13F | LPL Financial LLC | 1,634,779 | 18.14 | 14,533 | 22.13 | ||||
| 2025-08-19 | 13F | Advisory Services Network, LLC | 34,093 | 7.13 | 301 | 10.26 | ||||
| 2025-05-13 | 13F | Clear Street Markets Llc | 0 | -100.00 | 0 | |||||
| 2025-08-04 | 13F | Wealth Management Associates, Inc. | 17,973 | -2.70 | 160 | 0.63 | ||||
| 2025-08-14 | 13F | Kovitz Investment Group Partners, LLC | 437,874 | 0.09 | 3,892 | 3.46 | ||||
| 2025-07-11 | 13F | Kaydan Wealth Management, Inc. | 21,513 | 0.00 | 191 | 3.24 | ||||
| 2025-08-14 | 13F | Wetherby Asset Management Inc | 20,853 | 0.00 | 185 | 7.56 | ||||
| 2025-08-08 | 13F | Cetera Investment Advisers | 202,400 | -0.48 | 1,799 | 2.86 | ||||
| 2025-07-17 | 13F | Western Financial Corp/CA | 22,962 | 12.17 | 204 | 15.91 | ||||
| 2025-06-26 | NP | AAINX - Thrivent Opportunity Income Plus Fund Class A | 10,263 | 0.00 | 85 | -6.67 | ||||
| 2025-07-09 | 13F | David J Yvars Group | 93,601 | 1.05 | 830 | 3.88 | ||||
| 2025-04-22 | 13F | Castleview Partners, Llc | 0 | -100.00 | 0 | |||||
| 2025-07-22 | 13F | Iowa State Bank | 16,946 | 0.00 | 151 | 3.45 | ||||
| 2025-08-04 | 13F | Daymark Wealth Partners, Llc | 11,600 | 0.00 | 103 | 4.04 | ||||
| 2025-05-15 | 13F | Concorde Asset Management, LLC | 48,404 | 36.30 | 396 | 34.35 | ||||
| 2025-08-04 | 13F | Prairie Wealth Advisors, Inc. | 16,300 | 0.00 | 145 | 2.86 | ||||
| 2025-07-25 | 13F | Cwm, Llc | 7,433 | 0.00 | 0 | |||||
| 2025-07-30 | 13F | D.a. Davidson & Co. | 40,919 | 18.01 | 364 | 21.81 | ||||
| 2025-08-13 | 13F | Thomas J. Herzfeld Advisors, Inc. | 664 | 2.15 | 6 | 0.00 | ||||
| 2025-08-14 | 13F | Wiley Bros.-aintree Capital, Llc | 90,157 | 170.51 | 801 | 179.09 | ||||
| 2025-07-24 | 13F | Us Bancorp \de\ | 0 | -100.00 | 0 | |||||
| 2025-07-14 | 13F | Masso Torrence Wealth Management Inc. | 20,413 | 0.00 | 181 | 3.43 | ||||
| 2025-08-11 | 13F | Oder Investment Management, LLC | 29,120 | 0.52 | 259 | 3.61 | ||||
| 2025-07-22 | 13F | Chung Wu Investment Group, LLC | 3,607 | 32 | ||||||
| 2025-07-24 | 13F | Capital Advisors, Ltd. LLC | 2,279 | 2.20 | 0 | |||||
| 2025-08-14 | 13F | Raymond James Financial Inc | 3,980,743 | 9.30 | 35,389 | 12.98 | ||||
| 2025-07-14 | 13F | Pacifica Partners Inc. | 600 | 5 | ||||||
| 2025-07-22 | 13F | Wealthcare Advisory Partners LLC | 18,611 | -14.14 | 165 | -11.29 |