Mga Batayang Estadistika
| Pemilik Institusional | 86 total, 86 long only, 0 short only, 0 long/short - change of -6.52% MRQ |
| Alokasi Portofolio Rata-rata | 0.1589 % - change of 12.47% MRQ |
| Saham Institusional (Jangka Panjang) | 9,948,141 (ex 13D/G) - change of 0.27MM shares 2.80% MRQ |
| Nilai Institusional (Jangka Panjang) | $ 100,409 USD ($1000) |
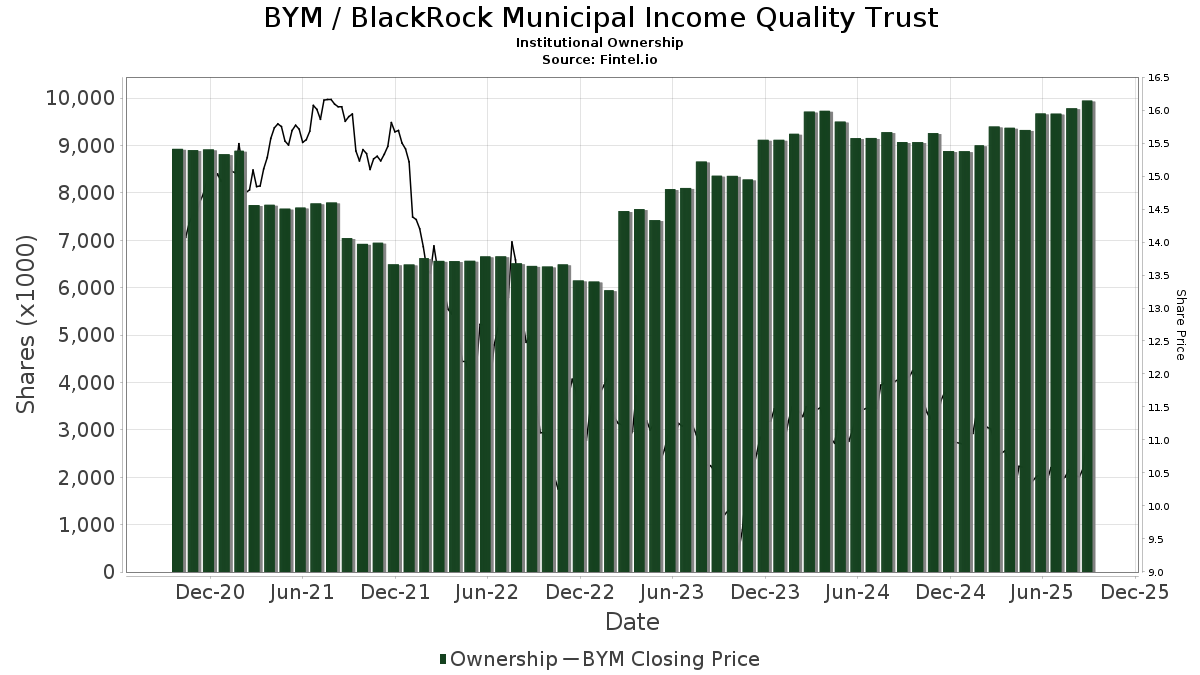
Kepemilikan Institusional dan Pemegang Saham
BlackRock Municipal Income Quality Trust (US:BYM) memiliki 86 pemilik institusional dan pemegang saham yang telah mengajukan formulir 13D/G atau 13F kepada Komisi Bursa Efek (Securities Exchange Commission/SEC). Lembaga-lembaga ini memegang total 9,948,141 saham. Pemegang saham terbesar meliputi Morgan Stanley, Rivernorth Capital Management, Llc, Americana Partners, LLC, Pathstone Holdings, LLC, Mackay Shields Llc, ROBAX - Robinson Tax Advantaged Income Fund Class A Shares, Robinson Capital Management, Llc, Stifel Financial Corp, Hennion & Walsh Asset Management, Inc., and Wells Fargo & Company/mn .
Struktur kepemilikan institusional BlackRock Municipal Income Quality Trust (NYSE:BYM) menunjukkan posisi terkini di perusahaan oleh institusi dan dana, serta perubahan terbaru dalam ukuran posisi. Pemegang saham utama dapat mencakup investor individu, reksa dana, dana lindung nilai, atau institusi. Jadwal 13D menunjukkan bahwa investor memegang (atau pernah memegang) lebih dari 5% saham perusahaan dan bermaksud (atau pernah bermaksud) untuk secara aktif mengejar perubahan strategi bisnis. Jadwal 13G menunjukkan investasi pasif lebih dari 5%.
The share price as of September 5, 2025 is 10.66 / share. Previously, on September 9, 2024, the share price was 11.92 / share. This represents a decline of 10.57% over that period.
Skor Sentimen Dana
Skor Sentimen Dana (sebelumnya dikenal sebagai Skor Akumulasi Kepemilikan) menemukan saham-saham yang paling banyak dibeli oleh dana. Ini adalah hasil dari model kuantitatif multi-faktor yang canggih yang mengidentifikasi perusahaan dengan tingkat akumulasi institusional tertinggi. Model penilaian menggunakan kombinasi dari total peningkatan pemilik yang diungkapkan, perubahan dalam alokasi portofolio pada pemilik tersebut, dan metrik lainnya. Angka berkisar dari 0 hingga 100, dengan angka yang lebih tinggi menunjukkan tingkat akumulasi yang lebih tinggi dibandingkan dengan perusahaan sejenisnya, dan 50 adalah rata-ratanya.
Frekuensi Pembaruan: Setiap Hari
Lihat Ownership Explorer, yang menyediakan daftar perusahaan dengan peringkat tertinggi.
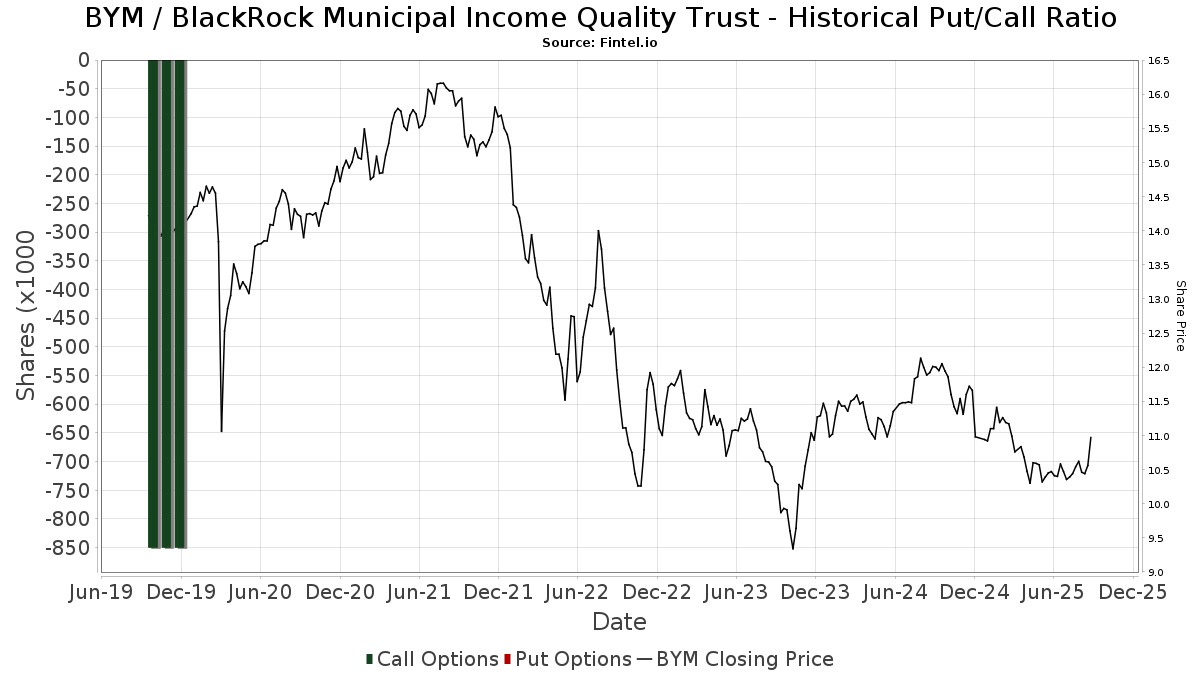
Rasio Put/Call Institusional
Selain melaporkan isu ekuitas dan utang standar, institusi dengan aset di bawah manajemen lebih dari 100 juta dolar AS juga harus mengungkapkan kepemilikan opsi put dan call mereka. Karena opsi put umumnya menunjukkan sentimen negatif, dan opsi call menunjukkan sentimen positif, kita dapat mengetahui sentimen institusional secara keseluruhan dengan memplot rasio put terhadap call. Grafik di sebelah kanan memplot rasio put/call historis untuk instrumen ini.
Menggunakan Rasio Put/Call sebagai indikator sentimen investor mengatasi salah satu kekurangan utama dari penggunaan total kepemilikan institusional, yaitu sejumlah besar aset yang dikelola diinvestasikan secara pasif untuk melacak indeks. Dana yang dikelola secara pasif biasanya tidak membeli opsi, sehingga indikator rasio put/call lebih akurat dalam melacak sentimen dana yang dikelola secara aktif.
Pengajuan 13F dan NPORT
Detail pada pengajuan 13F tersedia gratis. Detail pada pengajuan NP memerlukan keanggotaan premium. Baris berwarna hijau menunjukkan posisi baru. Baris berwarna merah menunjukkan posisi yang sudah ditutup. Klik tautan ini ikon untuk melihat riwayat transaksi selengkapnya.
Tingkatkan
untuk membuka data premium dan mengekspor ke Excel ![]() .
.
| Tanggal File | Sumber | Investor | Ketik | Presyo ng Avg (Silangan) |
Saham | Δ Saham (%) |
Dilaporkan Nilai ($1000) |
Nilai Δ (%) |
Alokasi Port (%) |
|
|---|---|---|---|---|---|---|---|---|---|---|
| 2025-07-17 | 13F | Covenant Asset Management, LLC | 11,875 | 0.00 | 125 | -2.34 | ||||
| 2025-04-30 | 13F | Sofos Investments, Inc. | 3,325 | 36 | ||||||
| 2025-08-14 | 13F | LM Advisors LLC | 164,844 | 0.00 | 2 | 0.00 | ||||
| 2025-08-14 | 13F | Toronto Dominion Bank | 122,492 | 1,294 | ||||||
| 2025-07-30 | 13F | Cullen/frost Bankers, Inc. | 0 | -100.00 | 0 | |||||
| 2025-08-14 | 13F | Comerica Bank | 53,462 | 0.08 | 565 | -1.91 | ||||
| 2025-04-15 | 13F | Noble Wealth Management PBC | 1,750 | 19 | ||||||
| 2025-08-11 | 13F | Aptus Capital Advisors, LLC | 13,673 | -3.53 | 144 | -5.26 | ||||
| 2025-08-28 | NP | RiverNorth Opportunistic Municipal Income Fund, Inc. | 39,925 | 0.00 | 422 | -2.09 | ||||
| 2025-07-24 | 13F | Us Bancorp \de\ | 0 | -100.00 | 0 | |||||
| 2025-08-28 | NP | RiverNorth Managed Duration Municipal Income Fund, Inc. | 238,193 | 0.00 | 2,515 | -2.03 | ||||
| 2025-08-14 | 13F | Goldman Sachs Group Inc | 47,341 | 25.10 | 500 | 22.60 | ||||
| 2025-08-18 | 13F/A | Nomura Holdings Inc | 10,000 | 106 | ||||||
| 2025-08-11 | 13F | Hexagon Capital Partners LLC | 0 | -100.00 | 0 | |||||
| 2025-09-04 | 13F/A | Advisor Group Holdings, Inc. | 23,728 | -16.24 | 251 | -18.03 | ||||
| 2025-08-05 | 13F | Bank Of Montreal /can/ | 21,266 | 6.77 | 225 | 4.67 | ||||
| 2025-08-12 | 13F | LPL Financial LLC | 112,144 | 0.56 | 1,184 | -1.50 | ||||
| 2025-08-14 | 13F | GWM Advisors LLC | 13,981 | -11.41 | 148 | -13.53 | ||||
| 2025-08-05 | 13F | Bank of New York Mellon Corp | 13,533 | 143 | ||||||
| 2025-08-11 | 13F | TD Waterhouse Canada Inc. | 133 | 0.00 | 1 | 0.00 | ||||
| 2025-08-14 | 13F | Wells Fargo & Company/mn | 322,337 | -5.56 | 3,404 | -7.50 | ||||
| 2025-07-17 | 13F/A | Capital Investment Advisors, LLC | 16,390 | -7.87 | 173 | -9.42 | ||||
| 2025-07-08 | 13F | Melone Private Wealth, LLC | 124,558 | -8.03 | 1,295 | -11.30 | ||||
| 2025-08-15 | 13F | Morgan Stanley | 1,309,034 | 5.36 | 13,823 | 3.22 | ||||
| 2025-07-15 | 13F | Fortitude Family Office, LLC | 0 | -100.00 | 0 | |||||
| 2025-08-14 | 13F | Hrt Financial Lp | 0 | -100.00 | 0 | |||||
| 2025-08-13 | 13F | Guggenheim Capital Llc | 235,406 | -50.02 | 2,486 | -51.05 | ||||
| 2025-08-12 | 13F | Advisors Asset Management, Inc. | 0 | -100.00 | 0 | |||||
| 2025-08-13 | 13F | Allegheny Financial Group LTD | 168,283 | -12.70 | 1,777 | -14.44 | ||||
| 2025-08-11 | 13F | Elequin Capital Lp | 1,096 | -81.28 | 12 | -82.54 | ||||
| 2025-07-25 | NP | MFLX - First Trust Municipal CEF Income Opportunity ETF This fund is a listed as child fund of First Trust Advisors Lp and if that institution has disclosed ownership in this security, then these positions will not be double counted when calculating total shares and total value | 1,619 | 0.00 | 17 | -11.11 | ||||
| 2025-08-28 | NP | RiverNorth Managed Duration Municipal Income Fund II, Inc. | 55,788 | 0.00 | 589 | -2.00 | ||||
| 2025-08-08 | 13F | Pnc Financial Services Group, Inc. | 8,869 | 4.51 | 94 | 2.20 | ||||
| 2025-08-07 | 13F | Allworth Financial LP | 9,759 | 103 | ||||||
| 2025-08-27 | NP | ROBAX - Robinson Tax Advantaged Income Fund Class A Shares | 407,198 | 29.78 | 4,300 | 27.14 | ||||
| 2025-08-18 | 13F | Geneos Wealth Management Inc. | 700 | 0.00 | 7 | 0.00 | ||||
| 2025-08-07 | 13F | Americana Partners, LLC | 839,962 | -27.04 | 8,870 | -28.53 | ||||
| 2025-08-14 | 13F | Westchester Capital Management, LLC | 132,996 | 36.70 | 1,404 | 33.97 | ||||
| 2025-08-13 | 13F | Rinkey Investments | 44,500 | 0.00 | 470 | -2.09 | ||||
| 2025-08-14 | 13F | Susquehanna International Group, Llp | 19,106 | 202 | ||||||
| 2025-06-24 | NP | MMHVX - MainStay MacKay High Yield Municipal Bond Fund Investor Class | 18,136 | 0.00 | 192 | -5.42 | ||||
| 2025-08-08 | 13F | Financial Gravity Companies, Inc. | 3,325 | 0.00 | 35 | -2.78 | ||||
| 2025-08-12 | 13F | Landscape Capital Management, L.l.c. | 41,629 | -1.67 | 440 | -3.73 | ||||
| 2025-08-14 | 13F | Jane Street Group, Llc | 12,283 | 130 | ||||||
| 2025-08-14 | 13F | Stifel Financial Corp | 372,751 | 93.53 | 3,936 | 89.60 | ||||
| 2025-08-12 | 13F | BlackRock, Inc. | 0 | -100.00 | 0 | |||||
| 2025-08-13 | 13F | Northwestern Mutual Wealth Management Co | 20,049 | -1.23 | 212 | -3.21 | ||||
| 2025-07-24 | 13F | Mackay Shields Llc | 481,061 | 50.83 | 5,080 | 47.76 | ||||
| 2025-08-07 | 13F | Readystate Asset Management Lp | 12,479 | -57.57 | 132 | -58.68 | ||||
| 2025-08-04 | 13F | Wolverine Asset Management Llc | 24,809 | 47.65 | 262 | 44.20 | ||||
| 2025-08-07 | 13F | Hennion & Walsh Asset Management, Inc. | 332,817 | -5.93 | 3,515 | -7.87 | ||||
| 2025-08-06 | 13F | Wedbush Securities Inc | 14,708 | -16.17 | 0 | |||||
| 2025-07-10 | 13F | Perkins Coie Trust Co | 938 | 0.00 | 10 | -10.00 | ||||
| 2025-07-23 | 13F | Tyche Wealth Partners LLC | 24,625 | 0.00 | 260 | -1.89 | ||||
| 2025-07-25 | NP | PMSAX - Global Multi-Strategy Fund Class A | 25,921 | 0.00 | 272 | -6.87 | ||||
| 2025-08-11 | 13F | Rothschild Investment Llc | 3,800 | 0.00 | 40 | 0.00 | ||||
| 2025-08-14 | 13F | Sit Investment Associates Inc | 62,823 | -2.63 | 1 | |||||
| 2025-07-28 | 13F | Harbour Investments, Inc. | 1,199 | 0.00 | 13 | 0.00 | ||||
| 2025-08-14 | 13F | Logan Stone Capital, LLC | 138,567 | -8.15 | 1,463 | -10.02 | ||||
| 2025-08-04 | 13F | Simon Quick Advisors, Llc | 10,905 | 4.23 | 115 | 2.68 | ||||
| 2025-07-23 | 13F | Indiana Trust & Investment Management CO | 97,655 | 0.51 | 1,031 | -1.53 | ||||
| 2025-08-14 | 13F | BTG Pactual Asset Management US LLC | 38,860 | 0.00 | 410 | -1.91 | ||||
| 2025-08-14 | 13F | Raymond James Financial Inc | 57,933 | 3.07 | 612 | 0.99 | ||||
| 2025-08-14 | 13F | Rivernorth Capital Management, Llc | 880,192 | 7.27 | 9,295 | 5.08 | ||||
| 2025-08-27 | NP | JNL SERIES TRUST - JNL/Westchester Capital Event Driven Fund (A) | 21,004 | 135.89 | 222 | 132.63 | ||||
| 2025-08-14 | 13F | Karpus Management, Inc. | 107,191 | 39.74 | 1,132 | 36.92 | ||||
| 2025-05-09 | 13F | Pathway Financial Advisers, LLC | 0 | -100.00 | 0 | |||||
| 2025-08-14 | 13F | Ameriprise Financial Inc | 35,143 | 0.51 | 371 | -1.33 | ||||
| 2025-08-14 | 13F | Royal Bank Of Canada | 42,112 | -3.45 | 445 | -5.32 | ||||
| 2025-08-14 | 13F | Robinson Capital Management, Llc | 407,198 | 29.78 | 4,300 | 27.14 | ||||
| 2025-08-12 | 13F | MAI Capital Management | 600 | 0.00 | 6 | 0.00 | ||||
| 2025-08-08 | 13F | Fiera Capital Corp | 268,042 | -0.36 | 2,831 | -2.38 | ||||
| 2025-08-28 | NP | RiverNorth Flexible Municipal Income Fund II, Inc. | 236,852 | 0.00 | 2,501 | -2.04 | ||||
| 2025-08-25 | NP | QWVQX - Clearwater Tax-Exempt Bond Fund | 14,751 | 0.00 | 156 | -2.52 | ||||
| 2025-08-28 | NP | Rivernorth Opportunities Fund, Inc. | 152,466 | 0.00 | 1,610 | -2.01 | ||||
| 2025-08-12 | 13F | Steward Partners Investment Advisory, Llc | 2,804 | 1.56 | 30 | 0.00 | ||||
| 2025-08-14 | 13F | UBS Group AG | 80,581 | -22.12 | 851 | -23.77 | ||||
| 2025-08-27 | NP | RYMSX - Guggenheim Multi-Hedge Strategies Fund Class P | 177 | -34.20 | 2 | -50.00 | ||||
| 2025-07-22 | 13F | Merit Financial Group, LLC | 22,307 | 0.93 | 236 | -1.26 | ||||
| 2025-08-14 | 13F | Mariner, LLC | 0 | -100.00 | 0 | |||||
| 2025-05-15 | 13F | Cnh Partners Llc | 0 | -100.00 | 0 | -100.00 | ||||
| 2025-08-14 | 13F | Van Eck Associates Corp | 178,377 | 11.09 | 2 | 0.00 | ||||
| 2025-04-21 | 13F | Nelson, Van Denburg & Campbell Wealth Management Group, LLC | 0 | -100.00 | 0 | |||||
| 2025-08-12 | 13F | Proequities, Inc. | 0 | 0 | ||||||
| 2025-08-06 | 13F | Commonwealth Equity Services, Llc | 13,232 | 0 | ||||||
| 2025-07-11 | 13F | Pinnacle Bancorp, Inc. | 3,495 | 0.00 | 37 | -2.70 | ||||
| 2025-08-14 | 13F | Bank Of America Corp /de/ | 74,941 | -7.18 | 791 | -9.08 | ||||
| 2025-08-13 | 13F | StoneX Group Inc. | 12,740 | 12.42 | 135 | 9.84 | ||||
| 2025-07-30 | 13F | FNY Investment Advisers, LLC | 900 | 0.00 | 0 | |||||
| 2025-08-07 | 13F | Atala Financial Inc | 54,088 | 213.35 | 571 | 206.99 | ||||
| 2025-08-26 | NP | WCERX - WCM Alternatives: Event-Driven Fund - Investor Class Shares | 52,916 | 0.00 | 559 | -2.11 | ||||
| 2025-08-12 | 13F | Virtu Financial LLC | 0 | -100.00 | 0 | |||||
| 2025-08-27 | NP | RYDEX VARIABLE TRUST - Multi-Hedge Strategies Fund Variable Annuity | 298 | -15.10 | 3 | 0.00 | ||||
| 2025-06-25 | NP | XMPT - VanEck Vectors CEF Municipal Income ETF | 161,560 | 0.15 | 1,713 | -5.20 | ||||
| 2025-08-28 | NP | RiverNorth Flexible Municipal Income Fund, Inc. | 52,501 | 0.00 | 554 | -1.95 | ||||
| 2025-08-11 | 13F | HighTower Advisors, LLC | 18,445 | -2.22 | 195 | -4.43 | ||||
| 2025-08-12 | 13F | Pathstone Holdings, LLC | 604,652 | 26.69 | 6,385 | 21.64 | ||||
| 2025-08-13 | 13F | Continuum Advisory, LLC | 0 | -100.00 | 0 | |||||
| 2025-08-13 | 13F | Invesco Ltd. | 51,088 | -0.65 | 539 | -2.71 | ||||
| 2025-07-25 | 13F | Ackerman Capital Advisors, LLC | 10,949 | -64.37 | 116 | -65.26 |