Mga Batayang Estadistika
| Pemilik Institusional | 128 total, 128 long only, 0 short only, 0 long/short - change of -2.29% MRQ |
| Alokasi Portofolio Rata-rata | 0.2973 % - change of 23.64% MRQ |
| Saham Institusional (Jangka Panjang) | 41,336,195 (ex 13D/G) - change of 12.81MM shares 44.92% MRQ |
| Nilai Institusional (Jangka Panjang) | $ 275,548 USD ($1000) |
Kepemilikan Institusional dan Pemegang Saham
Cornerstone Strategic Investment Fund, Inc. (US:CLM) memiliki 128 pemilik institusional dan pemegang saham yang telah mengajukan formulir 13D/G atau 13F kepada Komisi Bursa Efek (Securities Exchange Commission/SEC). Lembaga-lembaga ini memegang total 41,336,195 saham. Pemegang saham terbesar meliputi Alpine Global Management, LLC, Boothbay Fund Management, Llc, Sit Investment Associates Inc, Advisor Group Holdings, Inc., Sculptor Capital LP, Rivernorth Capital Management, Llc, LPL Financial LLC, Absolute Investment Advisers Llc, Yakira Capital Management, Inc., and Thomas J. Herzfeld Advisors, Inc. .
Struktur kepemilikan institusional Cornerstone Strategic Investment Fund, Inc. (NYSEAM:CLM) menunjukkan posisi terkini di perusahaan oleh institusi dan dana, serta perubahan terbaru dalam ukuran posisi. Pemegang saham utama dapat mencakup investor individu, reksa dana, dana lindung nilai, atau institusi. Jadwal 13D menunjukkan bahwa investor memegang (atau pernah memegang) lebih dari 5% saham perusahaan dan bermaksud (atau pernah bermaksud) untuk secara aktif mengejar perubahan strategi bisnis. Jadwal 13G menunjukkan investasi pasif lebih dari 5%.
The share price as of September 5, 2025 is 8.21 / share. Previously, on September 6, 2024, the share price was 7.46 / share. This represents an increase of 10.05% over that period.

Skor Sentimen Dana
Skor Sentimen Dana (sebelumnya dikenal sebagai Skor Akumulasi Kepemilikan) menemukan saham-saham yang paling banyak dibeli oleh dana. Ini adalah hasil dari model kuantitatif multi-faktor yang canggih yang mengidentifikasi perusahaan dengan tingkat akumulasi institusional tertinggi. Model penilaian menggunakan kombinasi dari total peningkatan pemilik yang diungkapkan, perubahan dalam alokasi portofolio pada pemilik tersebut, dan metrik lainnya. Angka berkisar dari 0 hingga 100, dengan angka yang lebih tinggi menunjukkan tingkat akumulasi yang lebih tinggi dibandingkan dengan perusahaan sejenisnya, dan 50 adalah rata-ratanya.
Frekuensi Pembaruan: Setiap Hari
Lihat Ownership Explorer, yang menyediakan daftar perusahaan dengan peringkat tertinggi.
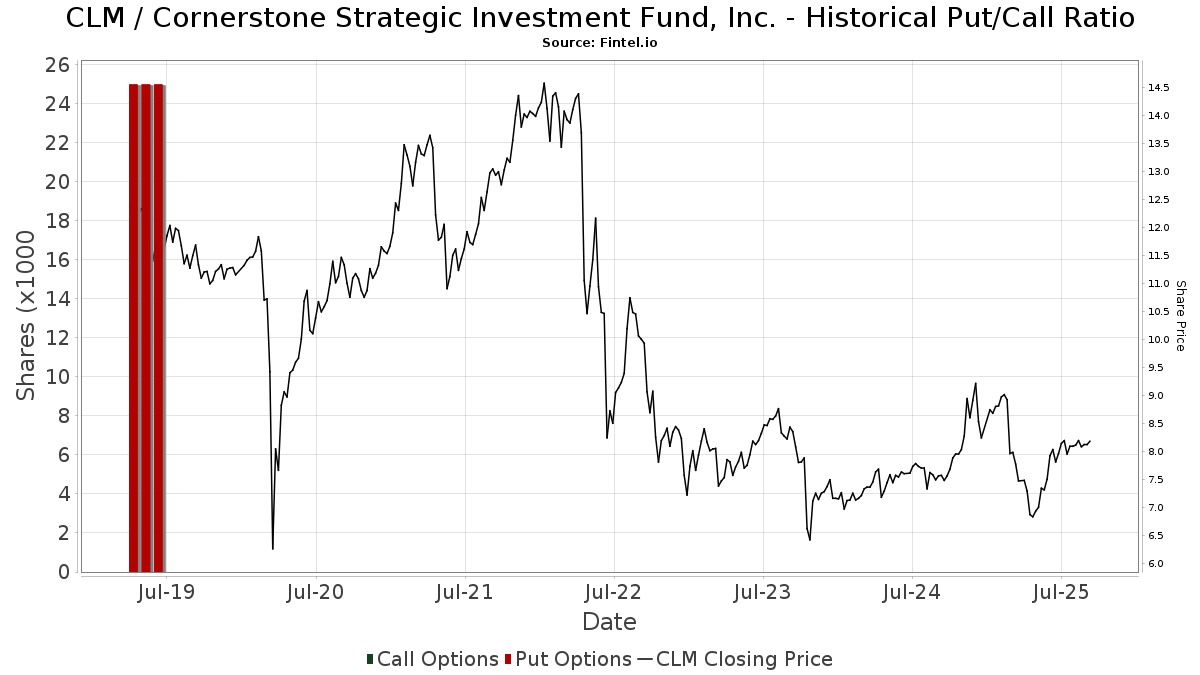
Rasio Put/Call Institusional
Selain melaporkan isu ekuitas dan utang standar, institusi dengan aset di bawah manajemen lebih dari 100 juta dolar AS juga harus mengungkapkan kepemilikan opsi put dan call mereka. Karena opsi put umumnya menunjukkan sentimen negatif, dan opsi call menunjukkan sentimen positif, kita dapat mengetahui sentimen institusional secara keseluruhan dengan memplot rasio put terhadap call. Grafik di sebelah kanan memplot rasio put/call historis untuk instrumen ini.
Menggunakan Rasio Put/Call sebagai indikator sentimen investor mengatasi salah satu kekurangan utama dari penggunaan total kepemilikan institusional, yaitu sejumlah besar aset yang dikelola diinvestasikan secara pasif untuk melacak indeks. Dana yang dikelola secara pasif biasanya tidak membeli opsi, sehingga indikator rasio put/call lebih akurat dalam melacak sentimen dana yang dikelola secara aktif.
Pengajuan 13F dan NPORT
Detail pada pengajuan 13F tersedia gratis. Detail pada pengajuan NP memerlukan keanggotaan premium. Baris berwarna hijau menunjukkan posisi baru. Baris berwarna merah menunjukkan posisi yang sudah ditutup. Klik tautan ini ikon untuk melihat riwayat transaksi selengkapnya.
Tingkatkan
untuk membuka data premium dan mengekspor ke Excel ![]() .
.
| Tanggal File | Sumber | Investor | Ketik | Presyo ng Avg (Silangan) |
Saham | Δ Saham (%) |
Dilaporkan Nilai ($1000) |
Nilai Δ (%) |
Alokasi Port (%) |
|
|---|---|---|---|---|---|---|---|---|---|---|
| 2025-08-14 | 13F | Garden State Investment Advisory Services LLC | 61,706 | 21.56 | 501 | 32.89 | ||||
| 2025-08-14 | 13F | Sunbelt Securities, Inc. | 1,181 | -4.83 | 10 | 11.11 | ||||
| 2025-08-14 | 13F/A | Rockefeller Capital Management L.P. | 25,702 | -5.17 | 209 | 3.48 | ||||
| 2025-08-14 | 13F | Boothbay Fund Management, Llc | 6,135,929 | 3.99 | 49,824 | 13.64 | ||||
| 2025-07-21 | 13F | Clarity Capital Partners LLC | 14,089 | -78.71 | 114 | -76.78 | ||||
| 2025-07-08 | 13F | Nbc Securities, Inc. | 18,455 | 0.00 | 0 | |||||
| 2025-08-14 | 13F | Ursa Fund Management, LLC | 275,000 | 1,000.00 | 2,233 | 1,107.03 | ||||
| 2025-08-12 | 13F | RPG Investment Advisory, LLC | 0 | -100.00 | 0 | |||||
| 2025-05-15 | 13F | Tower Research Capital LLC (TRC) | 0 | -100.00 | 0 | |||||
| 2025-08-14 | 13F | Banque Transatlantique SA | 0 | -100.00 | 0 | |||||
| 2025-07-10 | 13F | Marshall Financial Group LLC | 10,000 | 0.00 | 82 | 9.46 | ||||
| 2025-08-14 | 13F | UBS Group AG | 23,194 | -56.53 | 188 | -52.53 | ||||
| 2025-08-26 | 13F/A | Thrivent Financial For Lutherans | 145,939 | 45.28 | 1 | |||||
| 2025-07-01 | 13F | Harbor Investment Advisory, Llc | 11,204 | 0.00 | 91 | 8.43 | ||||
| 2025-08-19 | 13F | Newbridge Financial Services Group, Inc. | 10,000 | 81 | ||||||
| 2025-07-25 | 13F | Sequoia Financial Advisors, LLC | 21,400 | -2.73 | 174 | 6.13 | ||||
| 2025-08-12 | 13F | Global Retirement Partners, LLC | 0 | -100.00 | 0 | |||||
| 2025-08-29 | 13F | Evolution Wealth Management Inc. | 19,425 | 158 | ||||||
| 2025-07-14 | 13F | Buska Wealth Management, LLC | 18,017 | 9.07 | 146 | 19.67 | ||||
| 2025-07-29 | 13F | Stratos Wealth Partners, LTD. | 548,477 | 49.72 | 4,454 | 63.65 | ||||
| 2025-08-04 | 13F | Assetmark, Inc | 1,971 | -68.38 | 16 | -65.22 | ||||
| 2025-08-11 | 13F | Anfield Capital Management, LLC | 6,528 | 0.00 | 53 | 10.42 | ||||
| 2025-07-08 | 13F/A | Salem Investment Counselors Inc | 700 | 0.00 | 6 | 0.00 | ||||
| 2025-05-12 | 13F | Independent Advisor Alliance | 0 | -100.00 | 0 | |||||
| 2025-08-14 | 13F | Benjamin Edwards Inc | 109,511 | -10.65 | 889 | -2.31 | ||||
| 2025-08-13 | 13F | Yakira Capital Management, Inc. | 1,197,769 | 80.72 | 9,726 | 97.50 | ||||
| 2025-08-14 | 13F | Ameriprise Financial Inc | 15,916 | 0.00 | 129 | 9.32 | ||||
| 2025-08-01 | 13F | Envestnet Asset Management Inc | 45,212 | -12.29 | 367 | -4.18 | ||||
| 2025-08-05 | 13F | GPS Wealth Strategies Group, LLC | 8,010 | 17.62 | 65 | 30.00 | ||||
| 2025-08-14 | 13F | Alpine Global Management, LLC | 6,612,795 | 5.36 | 53,696 | 15.15 | ||||
| 2025-08-14 | 13F | Cohen & Steers, Inc. | 734,931 | 21.04 | 6 | 25.00 | ||||
| 2025-07-10 | 13F | HF Advisory Group, LLC | 21,939 | 3.96 | 178 | 14.10 | ||||
| 2025-08-11 | 13F | Perennial Investment Advisors, LLC | 451,228 | 3.27 | 3,664 | 12.85 | ||||
| 2025-08-06 | 13F | Vantage Financial Partners, LLC | 21,437 | -14.28 | 174 | -5.95 | ||||
| 2025-08-15 | 13F | Morgan Stanley | 508,044 | 12.11 | 4,125 | 22.51 | ||||
| 2025-07-11 | 13F | Seacrest Wealth Management, Llc | 23,938 | 26.61 | 194 | 38.57 | ||||
| 2025-07-10 | 13F | Redhawk Wealth Advisors, Inc. | 23,678 | 4.94 | 192 | 14.97 | ||||
| 2025-08-13 | 13F | Northwestern Mutual Wealth Management Co | 9,755 | -30.90 | 79 | -24.04 | ||||
| 2025-08-05 | 13F | Dunhill Financial, LLC | 856 | 7 | ||||||
| 2025-07-21 | 13F | Ameritas Advisory Services, LLC | 1,191 | 10 | ||||||
| 2025-07-22 | 13F | Firethorn Wealth Partners, Llc | 17,146 | 4.94 | 139 | 14.88 | ||||
| 2025-08-11 | 13F | United Capital Financial Advisers, Llc | 0 | -100.00 | 0 | |||||
| 2025-08-12 | 13F | Park Square Financial Group, LLC | 5,695 | 0.00 | 46 | 9.52 | ||||
| 2025-07-14 | 13F | Capital CS Group, LLC | 22,568 | 28.56 | 183 | 40.77 | ||||
| 2025-08-14 | 13F | Millennium Management Llc | 26,574 | 216 | ||||||
| 2025-08-27 | NP | ACEFX - Absolute Strategies Fund Institutional Shares | 41,440 | 336 | ||||||
| 2025-08-11 | 13F | HighTower Advisors, LLC | 59,496 | -43.94 | 483 | -38.71 | ||||
| 2025-08-14 | 13F | Fmr Llc | 39,673 | 90,065.91 | 322 | |||||
| 2025-08-07 | 13F | Allworth Financial LP | 14,463 | 2,228.99 | 117 | 2,825.00 | ||||
| 2025-07-15 | 13F | Absolute Investment Advisers Llc | 1,229,119 | 9,980 | ||||||
| 2025-08-11 | 13F | Mosaic Family Wealth Partners, Llc | 11,448 | 7.85 | 93 | 17.95 | ||||
| 2025-03-12 | 13F | Centaurus Financial, Inc. | 0 | -100.00 | 0 | -100.00 | ||||
| 2025-09-04 | 13F/A | Advisor Group Holdings, Inc. | 3,493,550 | 29.30 | 28,367 | 41.31 | ||||
| 2025-08-28 | NP | Rivernorth Opportunities Fund, Inc. | 287,123 | 70.61 | 2,331 | 94.41 | ||||
| 2025-08-01 | 13F | First Command Advisory Services, Inc. | 0 | 0 | ||||||
| 2025-08-15 | 13F/A | Cable Car Capital LLC | 661,825 | -0.11 | 5,374 | 9.18 | ||||
| 2025-07-21 | 13F | Ameriflex Group, Inc. | 0 | -100.00 | 0 | |||||
| 2025-07-31 | 13F | BIP Wealth, LLC | 0 | -100.00 | 0 | |||||
| 2025-07-17 | 13F | Sound Income Strategies, LLC | 4,864 | 0.00 | 39 | 8.33 | ||||
| 2025-08-14 | 13F | Raymond James Financial Inc | 351,430 | 13.12 | 2,854 | 23.61 | ||||
| 2025-07-31 | 13F | Cambridge Investment Research Advisors, Inc. | 498,849 | -4.43 | 4 | 33.33 | ||||
| 2025-08-14 | 13F | Rivernorth Capital Management, Llc | 1,803,392 | 14,644 | ||||||
| 2025-08-27 | NP | AAHYX - Thrivent Diversified Income Plus Fund Class A | 21,815 | 41.12 | 177 | 55.26 | ||||
| 2025-04-10 | 13F | Charles Schwab Trust Co | 0 | -100.00 | 0 | |||||
| 2025-08-27 | NP | THRIVENT SERIES FUND INC - Thrivent Balanced Income Plus Portfolio Class A | 5,094 | 33.35 | 41 | 46.43 | ||||
| 2025-08-07 | 13F | Resources Investment Advisors, LLC. | 10,260 | 83 | ||||||
| 2025-05-02 | 13F | Dakota Wealth Management | 0 | -100.00 | 0 | |||||
| 2025-08-12 | 13F | Proequities, Inc. | 0 | 0 | ||||||
| 2025-07-30 | 13F | BlueChip Wealth Advisors LLC | 13,497 | 3.12 | 110 | 12.37 | ||||
| 2025-08-06 | 13F | Tabor Asset Management, LP | 0 | -100.00 | 0 | -100.00 | ||||
| 2025-07-09 | 13F | Dynamic Advisor Solutions LLC | 41,545 | 5.33 | 337 | 15.02 | ||||
| 2025-08-08 | 13F | Cetera Investment Advisers | 610,585 | 20.88 | 4,958 | 32.08 | ||||
| 2025-05-13 | 13F | Soltis Investment Advisors LLC | 0 | -100.00 | 0 | |||||
| 2025-08-06 | 13F | Commonwealth Equity Services, Llc | 251,740 | 0.51 | 2 | 100.00 | ||||
| 2025-07-29 | 13F | Chicago Partners Investment Group LLC | 26,351 | -15.44 | 213 | -2.29 | ||||
| 2025-08-13 | 13F | Baird Financial Group, Inc. | 91,397 | -1.35 | 742 | 7.85 | ||||
| 2025-08-14 | 13F | Toronto Dominion Bank | 50,000 | 406 | ||||||
| 2025-08-08 | 13F | Avantax Advisory Services, Inc. | 83,899 | 681 | ||||||
| 2025-05-16 | 13F | Jones Financial Companies Lllp | 0 | -100.00 | 0 | |||||
| 2025-08-12 | 13F | BlackRock, Inc. | 83,144 | 79.03 | 675 | 95.65 | ||||
| 2025-07-18 | 13F | PFG Investments, LLC | 37,318 | -26.30 | 303 | -19.41 | ||||
| 2025-08-14 | 13F | Ieq Capital, Llc | 0 | -100.00 | 0 | |||||
| 2025-08-14 | 13F | Stifel Financial Corp | 47,215 | 12.64 | 383 | 23.15 | ||||
| 2025-05-16 | 13F | Coppell Advisory Solutions LLC | 0 | -100.00 | 0 | |||||
| 2025-07-23 | 13F | Valmark Advisers, Inc. | 10,000 | 0.00 | 81 | 9.46 | ||||
| 2025-07-22 | 13F | DAVENPORT & Co LLC | 12,773 | 0.00 | 104 | 9.57 | ||||
| 2025-08-06 | 13F | Wedbush Securities Inc | 13,850 | -30.49 | 0 | |||||
| 2025-08-14 | 13F | GWM Advisors LLC | 29,865 | 29.85 | 243 | 42.35 | ||||
| 2025-07-11 | 13F | Farther Finance Advisors, LLC | 4,804 | 55.52 | 39 | 77.27 | ||||
| 2025-07-17 | 13F | Janney Montgomery Scott LLC | 0 | -100.00 | 0 | |||||
| 2025-08-08 | 13F | Larson Financial Group LLC | 10,122 | 52.42 | 82 | 67.35 | ||||
| 2025-08-14 | 13F | Citadel Advisors Llc | 37,929 | -23.98 | 308 | -17.03 | ||||
| 2025-08-14 | 13F | Sit Investment Associates Inc | 5,730,776 | 16,273.65 | 47 | |||||
| 2025-07-25 | 13F | We Are One Seven, LLC | 35,300 | 42.82 | 287 | 56.28 | ||||
| 2025-08-28 | NP | Cohen & Steers Closed-end Opportunity Fund, Inc. | 734,931 | 21.04 | 5,968 | 32.28 | ||||
| 2025-08-12 | 13F | Pathstone Holdings, LLC | 21,012 | 0.00 | 171 | 8.97 | ||||
| 2025-08-06 | 13F | AE Wealth Management LLC | 50,164 | 407 | ||||||
| 2025-08-13 | 13F | StoneX Group Inc. | 133,949 | 45.52 | 1,088 | 59.15 | ||||
| 2025-07-25 | 13F | Atria Wealth Solutions, Inc. | 32,531 | -84.04 | 268 | -82.33 | ||||
| 2025-08-11 | 13F | Principal Securities, Inc. | 700 | 0.00 | 6 | -16.67 | ||||
| 2025-08-14 | 13F | CoreCap Advisors, LLC | 51,956 | 23.66 | 422 | 34.94 | ||||
| 2025-05-02 | 13F | Signaturefd, Llc | 0 | -100.00 | 0 | |||||
| 2025-04-22 | 13F | TrueMark Investments, LLC | 0 | -100.00 | 0 | |||||
| 2025-08-14 | 13F | Royal Bank Of Canada | 2,594 | 130.37 | 21 | 162.50 | ||||
| 2025-05-13 | 13F | Bokf, Na | 0 | -100.00 | 0 | |||||
| 2025-05-14 | 13F | Karpus Management, Inc. | 0 | -100.00 | 0 | |||||
| 2025-08-14 | 13F | Jane Street Group, Llc | 65,005 | 82.02 | 528 | 98.87 | ||||
| 2025-08-07 | 13F | Kestra Private Wealth Services, Llc | 24,297 | 19.81 | 197 | 31.33 | ||||
| 2025-06-26 | NP | AABFX - Thrivent Balanced Income Plus Fund Class A | 4,131 | 0.00 | 29 | -22.22 | ||||
| 2025-08-12 | 13F | AlphaCore Capital LLC | 0 | -100.00 | 0 | |||||
| 2025-06-26 | NP | AAINX - Thrivent Opportunity Income Plus Fund Class A | 33,107 | 0.00 | 229 | -22.37 | ||||
| 2025-07-17 | 13F | Sonora Investment Management Group, LLC | 10,135 | 0.00 | 82 | 9.33 | ||||
| 2025-08-08 | 13F | Kingsview Wealth Management, LLC | 10,000 | 0.00 | 81 | 9.46 | ||||
| 2025-08-13 | 13F | Townsquare Capital Llc | 0 | -100.00 | 0 | |||||
| 2025-08-11 | 13F | Aptus Capital Advisors, LLC | 217,910 | 1.33 | 1,769 | 10.77 | ||||
| 2025-05-07 | 13F | Sheaff Brock Investment Advisors, LLC | 13,830 | 0.00 | 103 | -13.56 | ||||
| 2025-05-15 | 13F | Mercer Global Advisors Inc /adv | 0 | -100.00 | 0 | |||||
| 2025-08-12 | 13F | Jpmorgan Chase & Co | 0 | -100.00 | 0 | |||||
| 2025-07-23 | 13F | Godsey & Gibb Associates | 1,000 | 0.00 | 8 | 14.29 | ||||
| 2025-05-13 | 13F | SHEPHERD WEALTH MANAGEMENT Ltd LIABILITY Co | 0 | -100.00 | 0 | |||||
| 2025-08-11 | 13F | Private Advisor Group, LLC | 51,681 | 1.27 | 420 | 10.55 | ||||
| 2025-08-04 | 13F | Creative Financial Designs Inc /adv | 81,742 | 15.17 | 664 | 25.81 | ||||
| 2025-07-11 | 13F | Adirondack Trust Co | 0 | -100.00 | 0 | |||||
| 2025-08-14 | 13F | Wells Fargo & Company/mn | 3 | -25.00 | 0 | |||||
| 2025-08-05 | 13F | Strategic Financial Concepts, LLC | 64,700 | -10.26 | 525 | -1.87 | ||||
| 2025-08-15 | 13F | Kestra Advisory Services, LLC | 34,447 | 119.88 | 280 | 140.52 | ||||
| 2025-05-12 | 13F | Evernest Financial Advisors, LLC | 0 | -100.00 | 0 | -100.00 | ||||
| 2025-07-24 | 13F | Us Bancorp \de\ | 256,505 | 0.00 | 2,083 | 9.29 | ||||
| 2025-08-12 | 13F | MAI Capital Management | 19,865 | 6.75 | 161 | 16.67 | ||||
| 2025-08-08 | 13F | Avalon Trust Co | 1,000 | -50.00 | 8 | -42.86 | ||||
| 2025-08-14 | 13F | Goldman Sachs Group Inc | 20,000 | 162 | ||||||
| 2025-08-01 | 13F | Pasadena Private Wealth, LLC | 13,945 | 20.18 | 113 | 31.40 | ||||
| 2025-08-11 | 13F | TD Waterhouse Canada Inc. | 0 | -100.00 | 0 | |||||
| 2025-08-14 | 13F | Sculptor Capital LP | 2,666,574 | 21,653 | ||||||
| 2025-07-28 | 13F | Harbour Investments, Inc. | 38 | 0.00 | 0 | |||||
| 2025-07-31 | 13F | Oppenheimer & Co Inc | 15,966 | -0.03 | 130 | 9.32 | ||||
| 2025-08-14 | 13F | Susquehanna International Group, Llp | 28,161 | -72.03 | 229 | -69.52 | ||||
| 2025-05-08 | 13F | Armis Advisers, LLC | 0 | -100.00 | 0 | |||||
| 2025-07-10 | 13F | Wealth Enhancement Advisory Services, Llc | 31,100 | 73.68 | 256 | 92.48 | ||||
| 2025-05-15 | 13F | Hrt Financial Lp | 0 | -100.00 | 0 | |||||
| 2025-08-12 | 13F | Steward Partners Investment Advisory, Llc | 1 | -99.99 | 0 | -100.00 | ||||
| 2025-08-08 | 13F | Capital Investment Advisory Services, LLC | 12,137 | 99 | ||||||
| 2025-08-12 | 13F | Virtu Financial LLC | 0 | -100.00 | 0 | |||||
| 2025-08-08 | 13F | Pnc Financial Services Group, Inc. | 1,200 | 0.00 | 10 | 12.50 | ||||
| 2025-08-12 | 13F | J.w. Cole Advisors, Inc. | 205,931 | 24.12 | 1,672 | 35.71 | ||||
| 2025-08-05 | 13F | Tsfg, Llc | 2,351 | 13,729.41 | 0 | |||||
| 2025-08-08 | 13F | Creative Planning | 120,974 | 26.88 | 982 | 38.70 | ||||
| 2025-08-08 | 13F | Meridian Wealth Management, LLC | 19,126 | 91.26 | 155 | 109.46 | ||||
| 2025-08-12 | 13F | Change Path, LLC | 39,112 | 318 | ||||||
| 2025-08-13 | 13F | Rsm Us Wealth Management Llc | 14,969 | 122 | ||||||
| 2025-08-14 | 13F | Bank Of America Corp /de/ | 3,904 | -99.79 | 32 | -99.78 | ||||
| 2025-08-13 | 13F | Summit Financial, LLC | 21,627 | 176 | ||||||
| 2025-07-24 | 13F | IFP Advisors, Inc | 0 | -100.00 | 0 | |||||
| 2025-08-14 | 13F | Quarry LP | 506,996 | 4,118.64 | 4,117 | 4,524.72 | ||||
| 2025-08-12 | 13F | LPL Financial LLC | 1,362,299 | 22.37 | 11,062 | 33.73 | ||||
| 2025-07-25 | 13F | Cwm, Llc | 31 | 0.00 | 0 | |||||
| 2025-08-07 | 13F | Encompass More Asset Management | 80,317 | 4.89 | 652 | 14.79 | ||||
| 2025-08-01 | 13F | Winebrenner Capital Management Llc | 108,426 | 0.00 | 880 | 9.32 | ||||
| 2025-08-13 | 13F | Thomas J. Herzfeld Advisors, Inc. | 1,074,966 | 1,109.29 | 8,729 | 1,222.42 | ||||
| 2025-08-04 | 13F | Integrity Alliance, Llc. | 0 | -100.00 | 0 | |||||
| 2025-08-06 | 13F | Prospera Financial Services Inc | 70,726 | 11.27 | 574 | 21.61 | ||||
| 2025-08-14 | 13F | Almitas Capital LLC | 0 | -100.00 | 0 | |||||
| 2025-08-27 | NP | THRIVENT SERIES FUND INC - Thrivent Diversified Income Plus Portfolio Class A | 12,946 | 33.34 | 105 | 45.83 | ||||
| 2025-05-12 | 13F | Kane Investment Management, Inc. | 0 | -100.00 | 0 | |||||
| 2025-08-14 | 13F | Integrated Wealth Concepts LLC | 12,210 | -1.47 | 99 | 7.61 | ||||
| 2025-07-22 | 13F | Grimes & Company, Inc. | 0 | -100.00 | 0 | |||||
| 2025-08-27 | NP | THRIVENT SERIES FUND INC - Thrivent Opportunity Income Plus Portfolio Class A | 9,906 | 33.34 | 80 | 45.45 |