Mga Batayang Estadistika
| Pemilik Institusional | 125 total, 125 long only, 0 short only, 0 long/short - change of 1.63% MRQ |
| Alokasi Portofolio Rata-rata | 0.0072 % - change of -50.61% MRQ |
| Saham Institusional (Jangka Panjang) | 2,578,654 (ex 13D/G) - change of 0.01MM shares 0.24% MRQ |
| Nilai Institusional (Jangka Panjang) | $ 55,324 USD ($1000) |
Kepemilikan Institusional dan Pemegang Saham
Global X Funds - Global X Autonomous & Electric Vehicles ETF (US:DRIV) memiliki 125 pemilik institusional dan pemegang saham yang telah mengajukan formulir 13D/G atau 13F kepada Komisi Bursa Efek (Securities Exchange Commission/SEC). Lembaga-lembaga ini memegang total 2,578,654 saham. Pemegang saham terbesar meliputi Bank Of America Corp /de/, LPL Financial LLC, Jane Street Group, Llc, Hancock Prospecting Pty Ltd, Envestnet Asset Management Inc, Northwestern Mutual Wealth Management Co, Flow Traders U.s. Llc, Advisor Group Holdings, Inc., Cetera Investment Advisers, and Raymond James Financial Inc .
Struktur kepemilikan institusional Global X Funds - Global X Autonomous & Electric Vehicles ETF (NasdaqGM:DRIV) menunjukkan posisi terkini di perusahaan oleh institusi dan dana, serta perubahan terbaru dalam ukuran posisi. Pemegang saham utama dapat mencakup investor individu, reksa dana, dana lindung nilai, atau institusi. Jadwal 13D menunjukkan bahwa investor memegang (atau pernah memegang) lebih dari 5% saham perusahaan dan bermaksud (atau pernah bermaksud) untuk secara aktif mengejar perubahan strategi bisnis. Jadwal 13G menunjukkan investasi pasif lebih dari 5%.
The share price as of September 5, 2025 is 25.94 / share. Previously, on September 6, 2024, the share price was 20.97 / share. This represents an increase of 23.70% over that period.

Skor Sentimen Dana
Skor Sentimen Dana (sebelumnya dikenal sebagai Skor Akumulasi Kepemilikan) menemukan saham-saham yang paling banyak dibeli oleh dana. Ini adalah hasil dari model kuantitatif multi-faktor yang canggih yang mengidentifikasi perusahaan dengan tingkat akumulasi institusional tertinggi. Model penilaian menggunakan kombinasi dari total peningkatan pemilik yang diungkapkan, perubahan dalam alokasi portofolio pada pemilik tersebut, dan metrik lainnya. Angka berkisar dari 0 hingga 100, dengan angka yang lebih tinggi menunjukkan tingkat akumulasi yang lebih tinggi dibandingkan dengan perusahaan sejenisnya, dan 50 adalah rata-ratanya.
Frekuensi Pembaruan: Setiap Hari
Lihat Ownership Explorer, yang menyediakan daftar perusahaan dengan peringkat tertinggi.
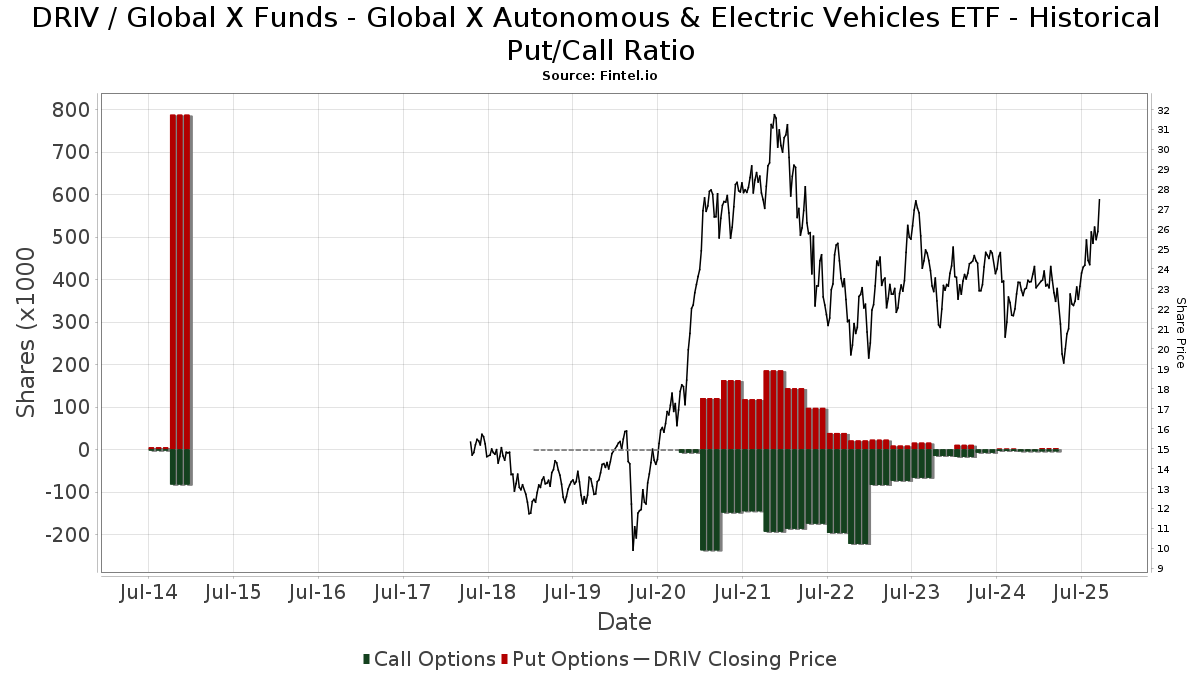
Rasio Put/Call Institusional
Selain melaporkan isu ekuitas dan utang standar, institusi dengan aset di bawah manajemen lebih dari 100 juta dolar AS juga harus mengungkapkan kepemilikan opsi put dan call mereka. Karena opsi put umumnya menunjukkan sentimen negatif, dan opsi call menunjukkan sentimen positif, kita dapat mengetahui sentimen institusional secara keseluruhan dengan memplot rasio put terhadap call. Grafik di sebelah kanan memplot rasio put/call historis untuk instrumen ini.
Menggunakan Rasio Put/Call sebagai indikator sentimen investor mengatasi salah satu kekurangan utama dari penggunaan total kepemilikan institusional, yaitu sejumlah besar aset yang dikelola diinvestasikan secara pasif untuk melacak indeks. Dana yang dikelola secara pasif biasanya tidak membeli opsi, sehingga indikator rasio put/call lebih akurat dalam melacak sentimen dana yang dikelola secara aktif.
Pengajuan 13F dan NPORT
Detail pada pengajuan 13F tersedia gratis. Detail pada pengajuan NP memerlukan keanggotaan premium. Baris berwarna hijau menunjukkan posisi baru. Baris berwarna merah menunjukkan posisi yang sudah ditutup. Klik tautan ini ikon untuk melihat riwayat transaksi selengkapnya.
Tingkatkan
untuk membuka data premium dan mengekspor ke Excel ![]() .
.
| Tanggal File | Sumber | Investor | Ketik | Presyo ng Avg (Silangan) |
Saham | Δ Saham (%) |
Dilaporkan Nilai ($1000) |
Nilai Δ (%) |
Alokasi Port (%) |
|
|---|---|---|---|---|---|---|---|---|---|---|
| 2025-08-05 | 13F | GPS Wealth Strategies Group, LLC | 2,619 | -21.47 | 61 | -12.86 | ||||
| 2025-07-21 | 13F | Crews Bank & Trust | 1,750 | 0.00 | 41 | 11.11 | ||||
| 2025-08-12 | 13F | Jpmorgan Chase & Co | 362 | 0.00 | 8 | 14.29 | ||||
| 2025-08-14 | 13F | Citadel Advisors Llc | Put | 0 | -100.00 | 0 | ||||
| 2025-08-14 | 13F | Citadel Advisors Llc | 28,898 | -12.97 | 673 | -3.99 | ||||
| 2025-07-25 | 13F | Cwm, Llc | 9,334 | -2.47 | 0 | |||||
| 2025-07-15 | 13F | SJS Investment Consulting Inc. | 80 | 0.00 | 2 | 0.00 | ||||
| 2025-08-12 | 13F | Global Retirement Partners, LLC | 607 | -85.40 | 14 | -85.26 | ||||
| 2025-08-14 | 13F | D. E. Shaw & Co., Inc. | 21,037 | 0.00 | 490 | 10.36 | ||||
| 2025-08-08 | 13F | New England Capital Financial Advisors LLC | 19 | 0.00 | 0 | |||||
| 2025-07-31 | 13F | Brinker Capital Investments, LLC | 0 | -100.00 | 0 | -100.00 | ||||
| 2025-08-06 | 13F | Legacy Investment Solutions, LLC | 5 | 0.00 | 0 | |||||
| 2025-08-12 | 13F | Solano Wealth Investment Advisors LLC | 13,500 | -2.70 | 315 | 7.17 | ||||
| 2025-05-14 | 13F | Ameriprise Financial Inc | 0 | -100.00 | 0 | |||||
| 2025-07-23 | 13F | Hager Investment Management Services, Llc | 475 | -15.93 | 11 | 0.00 | ||||
| 2025-08-14 | 13F/A | Barclays Plc | 3,000 | 0.00 | 0 | |||||
| 2025-08-07 | 13F | Kestra Private Wealth Services, Llc | 9,985 | -3.34 | 233 | 6.42 | ||||
| 2025-08-14 | 13F | Qube Research & Technologies Ltd | 217 | 0.00 | 5 | 25.00 | ||||
| 2025-08-05 | 13F | Key FInancial Inc | 1,021 | 0.00 | 24 | 9.52 | ||||
| 2025-07-11 | 13F | First PREMIER Bank | 740 | 0.00 | 0 | |||||
| 2025-07-29 | 13F | Stratos Wealth Partners, LTD. | 10,602 | -16.85 | 247 | -8.18 | ||||
| 2025-07-10 | 13F | Atticus Wealth Management, Llc | 2,210 | 0.00 | 52 | 10.87 | ||||
| 2025-07-14 | 13F | Armstrong Advisory Group, Inc | 1,140 | -56.44 | 27 | -56.67 | ||||
| 2025-08-22 | 13F | Carter Financial Group, INC. | 0 | -100.00 | 0 | |||||
| 2025-08-13 | 13F | Summit Financial, LLC | 10,677 | -87.02 | 251 | -85.62 | ||||
| 2025-08-14 | 13F | Citadel Advisors Llc | Call | 0 | -100.00 | 0 | ||||
| 2025-08-06 | 13F | Legacy Wealth Managment, LLC/ID | 5 | 0.00 | 0 | |||||
| 2025-08-11 | 13F | Strategic Wealth Partners, Ltd. | 625 | 15 | ||||||
| 2025-08-14 | 13F | McIlrath & Eck, LLC | 41 | 0.00 | 1 | |||||
| 2025-07-22 | 13F | Powell Investment Advisors, LLC | 1,100 | 26 | ||||||
| 2025-07-16 | 13F/A | CX Institutional | 25,226 | -72.35 | 1 | -100.00 | ||||
| 2025-08-12 | 13F | Pathstone Holdings, LLC | 0 | -100.00 | 0 | |||||
| 2025-08-12 | 13F | SRS Capital Advisors, Inc. | 610 | 0.00 | 14 | 16.67 | ||||
| 2025-08-07 | 13F | Flagship Wealth Advisors, Llc | 174 | 0.00 | 4 | 33.33 | ||||
| 2025-07-21 | 13F | Ameriflex Group, Inc. | 500 | 0.00 | 12 | 10.00 | ||||
| 2025-07-21 | 13F | DHJJ Financial Advisors, Ltd. | 947 | 22 | ||||||
| 2025-07-31 | 13F | Oppenheimer & Co Inc | 9,075 | 211 | ||||||
| 2025-07-31 | 13F | Cambridge Investment Research Advisors, Inc. | 24,433 | -28.02 | 1 | |||||
| 2025-08-11 | 13F | Principal Securities, Inc. | 165 | 43.48 | 4 | 50.00 | ||||
| 2025-07-22 | 13F | Cedar Mountain Advisors, LLC | 79 | 0.00 | 2 | 0.00 | ||||
| 2025-07-29 | 13F | Stephens Inc /ar/ | 12,545 | 0.00 | 292 | 10.19 | ||||
| 2025-08-14 | 13F | Mml Investors Services, Llc | 23,398 | -5.65 | 1 | |||||
| 2025-04-28 | 13F | D.a. Davidson & Co. | 0 | -100.00 | 0 | |||||
| 2025-05-16 | 13F | Coppell Advisory Solutions LLC | 0 | -100.00 | 0 | |||||
| 2025-08-04 | 13F | Creekmur Asset Management LLC | 379 | 0.00 | 9 | 0.00 | ||||
| 2025-07-08 | 13F | Parallel Advisors, LLC | 1,250 | 2.46 | 29 | 16.00 | ||||
| 2025-08-11 | 13F | TD Waterhouse Canada Inc. | 7,600 | -0.05 | 177 | 10.63 | ||||
| 2025-08-12 | 13F | MAI Capital Management | 163 | -18.91 | 4 | -25.00 | ||||
| 2025-07-11 | 13F | Global X Japan Co., Ltd. | 3,934 | -2.72 | 92 | 7.06 | ||||
| 2025-04-22 | 13F | PFG Investments, LLC | 0 | -100.00 | 0 | |||||
| 2025-08-01 | 13F | First Command Advisory Services, Inc. | 1,000 | 0.00 | 23 | 9.52 | ||||
| 2025-08-08 | 13F | SBI Securities Co., Ltd. | 1,241 | -18.89 | 29 | -12.50 | ||||
| 2025-08-05 | 13F | Bank Of Montreal /can/ | 1,442 | -29.38 | 34 | -23.26 | ||||
| 2025-08-06 | 13F | Golden State Wealth Management, LLC | 591 | 0.00 | 14 | 8.33 | ||||
| 2025-07-10 | 13F | Wealth Enhancement Advisory Services, Llc | 14,373 | -17.29 | 346 | -5.99 | ||||
| 2025-08-14 | 13F | Ancora Advisors, LLC | 539 | 65.85 | 13 | 100.00 | ||||
| 2025-08-13 | 13F | Flow Traders U.s. Llc | 71,444 | 2 | ||||||
| 2025-08-12 | 13F | Proequities, Inc. | 0 | 0 | ||||||
| 2025-08-14 | 13F | Jane Street Group, Llc | 253,976 | 5,918 | ||||||
| 2025-07-21 | 13F | Ameritas Advisory Services, LLC | 72 | 2 | ||||||
| 2025-08-06 | 13F | Commonwealth Equity Services, Llc | 40,199 | -12.35 | 1 | |||||
| 2025-08-18 | 13F | Hollencrest Capital Management | 505 | 0.00 | 12 | 10.00 | ||||
| 2025-05-15 | 13F | Mariner, LLC | 0 | -100.00 | 0 | |||||
| 2025-05-15 | 13F | Prospera Financial Services Inc | 0 | -100.00 | 0 | |||||
| 2025-08-18 | 13F | Geneos Wealth Management Inc. | 143 | -86.87 | 3 | -86.96 | ||||
| 2025-04-01 | 13F | Modus Advisors, LLC | 0 | -100.00 | 0 | |||||
| 2025-07-02 | 13F | HBW Advisory Services LLC | 0 | -100.00 | 0 | |||||
| 2025-08-14 | 13F | Stifel Financial Corp | 28,269 | -13.07 | 659 | -4.22 | ||||
| 2025-07-16 | 13F | Signaturefd, Llc | 0 | -100.00 | 0 | |||||
| 2025-07-28 | 13F | CGC Financial Services, LLC | 173 | -12.63 | 4 | 0.00 | ||||
| 2025-08-08 | 13F | Creative Planning | 12,355 | 0.14 | 288 | 10.38 | ||||
| 2025-07-24 | 13F | Us Bancorp \de\ | 177 | 4 | ||||||
| 2025-08-14 | 13F | UBS Group AG | 34,739 | 105.98 | 809 | 127.25 | ||||
| 2025-07-11 | 13F | Adirondack Trust Co | 1,260 | 0.00 | 29 | 11.54 | ||||
| 2025-07-16 | 13F | Signature Resources Capital Management, LLC | 225 | 0.00 | 5 | 25.00 | ||||
| 2025-08-06 | 13F | AE Wealth Management LLC | 862 | 116.58 | 20 | 150.00 | ||||
| 2025-07-14 | 13F | Painted Porch Advisors LLC | 0 | -100.00 | 0 | -100.00 | ||||
| 2025-08-14 | 13F | Glenmede Investment Management, LP | 610 | 14 | ||||||
| 2025-07-18 | 13F | Trust Co Of Vermont | 5 | 0.00 | 0 | |||||
| 2025-08-14 | 13F | CoreCap Advisors, LLC | 0 | -100.00 | 0 | |||||
| 2025-05-15 | 13F | Hrt Financial Lp | 0 | -100.00 | 0 | |||||
| 2025-08-14 | 13F | Bank Of America Corp /de/ | 732,440 | -7.92 | 17,066 | 1.49 | ||||
| 2025-07-24 | 13F | IFP Advisors, Inc | 217 | 4.83 | 5 | 25.00 | ||||
| 2025-08-08 | 13F | Pnc Financial Services Group, Inc. | 11,647 | -21.06 | 271 | -12.86 | ||||
| 2025-08-08 | 13F | Cetera Investment Advisers | 56,043 | 0.54 | 1,306 | 10.78 | ||||
| 2025-08-12 | 13F | Stelac Advisory Services LLC | 7,782 | 0.00 | 183 | 10.98 | ||||
| 2025-07-30 | 13F | Advantage Trust Co | 1,880 | 44 | ||||||
| 2025-04-28 | 13F | Strategic Financial Concepts, LLC | 0 | -100.00 | 0 | -100.00 | ||||
| 2025-07-07 | 13F | General Partner, Inc. | 2,000 | 0.00 | 47 | 9.52 | ||||
| 2025-08-05 | 13F | Simplex Trading, Llc | 0 | -100.00 | 0 | |||||
| 2025-08-07 | 13F | Allworth Financial LP | 11,441 | 4.28 | 267 | 17.18 | ||||
| 2025-07-18 | 13F | SOA Wealth Advisors, LLC. | 2,148 | 0.00 | 50 | 11.11 | ||||
| 2025-05-13 | 13F | HighTower Advisors, LLC | 0 | -100.00 | 0 | |||||
| 2025-05-13 | 13F | Measured Risk Portfolios, Inc. | 0 | -100.00 | 0 | |||||
| 2025-08-12 | 13F | Change Path, LLC | 21,747 | 9.83 | 507 | 21.05 | ||||
| 2025-08-13 | 13F | Northwestern Mutual Wealth Management Co | 81,977 | -6.51 | 1,910 | 3.08 | ||||
| 2025-08-13 | 13F | Congress Wealth Management LLC / DE / | 33,686 | 785 | ||||||
| 2025-08-14 | 13F | Murphy & Mullick Capital Management Corp | 375 | 0.00 | 9 | 14.29 | ||||
| 2025-09-04 | 13F/A | Advisor Group Holdings, Inc. | 61,425 | 1.42 | 1,432 | 11.80 | ||||
| 2025-08-01 | 13F | Envestnet Asset Management Inc | 85,573 | 8.72 | 1,994 | 19.84 | ||||
| 2025-08-12 | 13F | LPL Financial LLC | 315,471 | 11.92 | 7,350 | 23.36 | ||||
| 2025-07-11 | 13F | Farther Finance Advisors, LLC | 228 | 111.11 | 5 | 150.00 | ||||
| 2025-07-17 | 13F | Wolff Wiese Magana Llc | 127 | 0.00 | 3 | 0.00 | ||||
| 2025-08-08 | 13F | Larson Financial Group LLC | 4,348 | -12.13 | 101 | -2.88 | ||||
| 2025-08-14 | 13F | Sei Investments Co | 9,230 | 215 | ||||||
| 2025-04-18 | 13F | Wolf Group Capital Advisors | 19,506 | -17.08 | 412 | -32.68 | ||||
| 2025-05-14 | 13F | Caitlin John, LLC | 0 | -100.00 | 0 | |||||
| 2025-08-14 | 13F | Raymond James Financial Inc | 54,028 | -17.28 | 1,259 | -8.84 | ||||
| 2025-07-21 | 13F | Future Financial Wealth Managment LLC | 20 | 0.00 | 0 | |||||
| 2025-08-11 | 13F | Aptus Capital Advisors, LLC | 216 | 0.00 | 5 | 25.00 | ||||
| 2025-08-08 | 13F | Capital Investment Advisory Services, LLC | 354 | 0.00 | 8 | 14.29 | ||||
| 2025-08-14 | 13F | Hancock Prospecting Pty Ltd | 161,901 | 0.00 | 3,772 | 10.23 | ||||
| 2025-08-14 | 13F | Comerica Bank | 2,388 | 0.00 | 56 | 10.00 | ||||
| 2025-08-04 | 13F | Creative Financial Designs Inc /adv | 5,845 | -23.83 | 136 | -16.05 | ||||
| 2025-07-28 | 13F | Harbour Investments, Inc. | 1,746 | -36.74 | 41 | -31.03 | ||||
| 2025-08-12 | 13F | CIBC Private Wealth Group, LLC | 229 | 0.00 | 5 | 25.00 | ||||
| 2025-08-12 | 13F | Steward Partners Investment Advisory, Llc | 412 | 4.30 | 10 | 12.50 | ||||
| 2025-07-17 | 13F | Archford Capital Strategies, LLC | 0 | -100.00 | 0 | |||||
| 2025-04-21 | 13F | Friedenthal Financial | 0 | -100.00 | 0 | |||||
| 2025-08-13 | 13F | Financial Freedom, LLC | 20,019 | -25.60 | 466 | -17.96 | ||||
| 2025-05-28 | 13F | Intrua Financial, LLC | 0 | -100.00 | 0 | -100.00 | ||||
| 2025-05-09 | 13F | Pathway Financial Advisers, LLC | 0 | -100.00 | 0 | |||||
| 2025-05-15 | 13F | Glenmede Trust Co Na | 610 | 0.00 | 13 | -14.29 | ||||
| 2025-07-01 | 13F | Harbor Investment Advisory, Llc | 0 | -100.00 | 0 | |||||
| 2025-07-31 | 13F | Moment Partners, LLC | 13,775 | -3.64 | 321 | 5.96 | ||||
| 2025-08-29 | 13F | Total Investment Management Inc | 686 | 16 | ||||||
| 2025-08-14 | 13F | Destination Wealth Management | 23,909 | -3.30 | 557 | 6.70 | ||||
| 2025-08-14 | 13F | Fmr Llc | 1,209 | -30.84 | 28 | -22.22 | ||||
| 2025-05-02 | 13F | Whittier Trust Co | 0 | -100.00 | 0 | |||||
| 2025-07-24 | 13F | JNBA Financial Advisors | 0 | -100.00 | 0 | |||||
| 2025-07-28 | 13F | Duncker Streett & Co Inc | 101 | 2 | ||||||
| 2025-08-05 | 13F | Cherry Tree Wealth Management, LLC | 1,685 | 0.00 | 39 | 11.43 | ||||
| 2025-08-04 | 13F | Spire Wealth Management | 300 | 50.00 | 7 | 50.00 | ||||
| 2025-07-29 | 13F | Tradewinds Capital Management, LLC | 21 | 0.00 | 0 | |||||
| 2025-05-13 | 13F | EverSource Wealth Advisors, LLC | 0 | -100.00 | 0 | |||||
| 2025-07-17 | 13F | Jackson, Grant Investment Advisers, Inc. | 295 | 0.00 | 7 | 0.00 | ||||
| 2025-08-01 | 13F | Bessemer Group Inc | 1,350 | 1,250.00 | 0 | |||||
| 2025-05-15 | 13F | Tower Research Capital LLC (TRC) | 0 | -100.00 | 0 | |||||
| 2025-05-09 | 13F | GeoWealth Management, LLC | 0 | -100.00 | 0 | |||||
| 2025-08-05 | 13F | NewSquare Capital LLC | 37 | 1 | ||||||
| 2025-08-15 | 13F | Morgan Stanley | 19,195 | -37.47 | 447 | -31.02 | ||||
| 2025-08-18 | 13F | N.E.W. Advisory Services LLC | 271 | 0.00 | 6 | 20.00 | ||||
| 2025-04-25 | 13F | Red Tortoise LLC | 0 | -100.00 | 0 | |||||
| 2025-07-21 | 13F | Mirae Asset Global Investments Co., Ltd. | 7,000 | 0.00 | 163 | 9.40 | ||||
| 2025-08-14 | 13F | Dagco, Inc. | 848 | 0.00 | 20 | 11.76 | ||||
| 2025-07-25 | 13F | NorthRock Partners, LLC | 88 | 0.00 | 2 | 100.00 | ||||
| 2025-07-16 | 13F | PFS Partners, LLC | 97 | 0.00 | 2 | 0.00 | ||||
| 2025-07-17 | 13F | Beacon Capital Management, LLC | 0 | -100.00 | 0 | |||||
| 2025-08-14 | 13F | Susquehanna International Group, Llp | 35,560 | -13.67 | 829 | -4.83 | ||||
| 2025-04-10 | 13F | Grassi Investment Management | 0 | -100.00 | 0 | |||||
| 2025-08-13 | 13F | Capital Analysts, Inc. | 1,570 | 0.00 | 0 | |||||
| 2025-08-08 | 13F | Emerald Investment Partners, Llc | 686 | 16 | ||||||
| 2025-05-14 | 13F | WCG Wealth Advisors LLC | 0 | -100.00 | 0 | |||||
| 2025-08-12 | 13F | Cook Wealth Management Group Llc | 0 | -100.00 | 0 | |||||
| 2025-08-14 | 13F | GWM Advisors LLC | 2,420 | 4.54 | 56 | 16.67 | ||||
| 2025-08-14 | 13F | Federation des caisses Desjardins du Quebec | 4,422 | -2.96 | 103 | 7.29 | ||||
| 2025-07-28 | 13F | BRYN MAWR TRUST Co | 360 | 0.00 | 8 | 14.29 | ||||
| 2025-08-05 | 13F | Westside Investment Management, Inc. | 200 | 0.00 | 5 | 0.00 | ||||
| 2025-08-14 | 13F | Wells Fargo & Company/mn | 19,427 | -10.13 | 453 | -0.88 | ||||
| 2025-06-10 | 13F | Birchbrook, Inc. | 0 | -100.00 | 0 | -100.00 | ||||
| 2025-08-05 | 13F | Fourth Dimension Wealth, LLC | 100 | 0.00 | 2 | 0.00 | ||||
| 2025-08-13 | 13F | Jones Financial Companies Lllp | 5,439 | 24.92 | 127 | 35.48 | ||||
| 2025-08-14 | 13F | Group One Trading, L.p. | 100 | 0.00 | 2 | 0.00 | ||||
| 2025-05-02 | 13F | Capital A Wealth Management, LLC | 0 | -100.00 | 0 | |||||
| 2025-08-11 | 13F | Elite Financial, Inc. | 0 | -100.00 | 0 | |||||
| 2025-08-14 | 13F | Royal Bank Of Canada | 35,717 | -11.48 | 832 | -2.58 |
Other Listings
| MX:DRIV |