Mga Batayang Estadistika
| Pemilik Institusional | 192 total, 192 long only, 0 short only, 0 long/short - change of 3.78% MRQ |
| Alokasi Portofolio Rata-rata | 0.1848 % - change of -31.36% MRQ |
| Saham Institusional (Jangka Panjang) | 6,418,265 (ex 13D/G) - change of -0.27MM shares -4.03% MRQ |
| Nilai Institusional (Jangka Panjang) | $ 706,727 USD ($1000) |
Kepemilikan Institusional dan Pemegang Saham
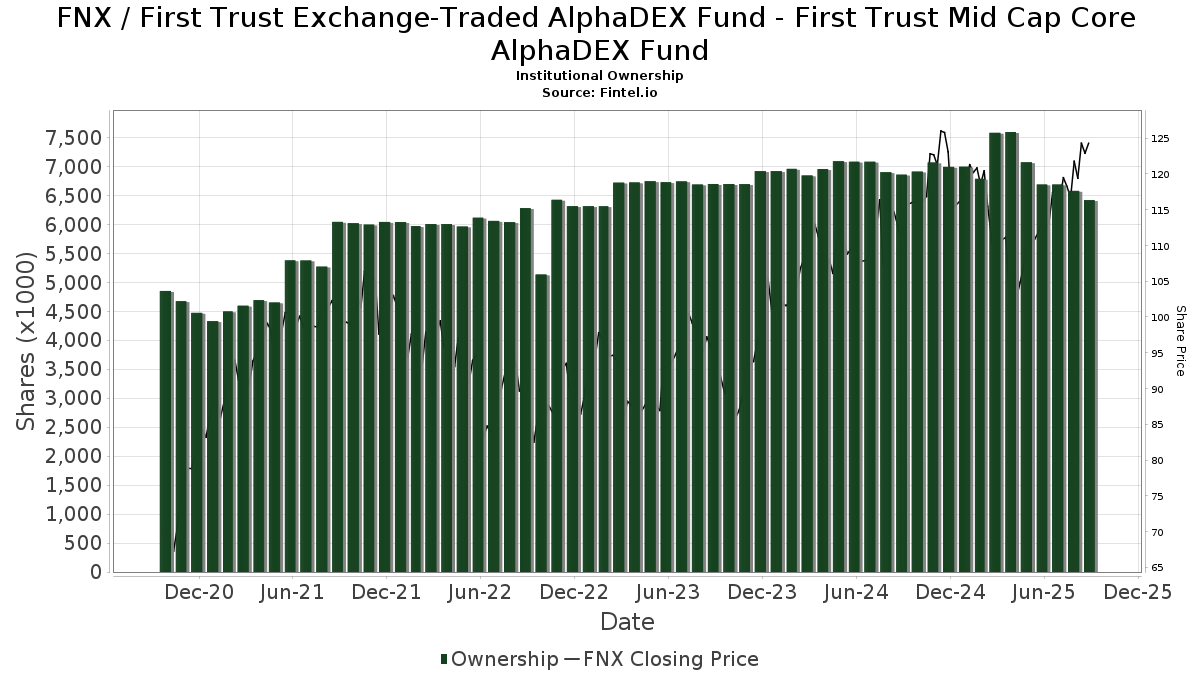
First Trust Exchange-Traded AlphaDEX Fund - First Trust Mid Cap Core AlphaDEX Fund (US:FNX) memiliki 192 pemilik institusional dan pemegang saham yang telah mengajukan formulir 13D/G atau 13F kepada Komisi Bursa Efek (Securities Exchange Commission/SEC). Lembaga-lembaga ini memegang total 6,418,265 saham. Pemegang saham terbesar meliputi Morgan Stanley, LPL Financial LLC, Wells Fargo & Company/mn, Raymond James Financial Inc, Royal Bank Of Canada, UBS Group AG, Baird Financial Group, Inc., Cetera Investment Advisers, HighTower Advisors, LLC, and Three Cord True Wealth Management, LLC .
Struktur kepemilikan institusional First Trust Exchange-Traded AlphaDEX Fund - First Trust Mid Cap Core AlphaDEX Fund (NasdaqGM:FNX) menunjukkan posisi terkini di perusahaan oleh institusi dan dana, serta perubahan terbaru dalam ukuran posisi. Pemegang saham utama dapat mencakup investor individu, reksa dana, dana lindung nilai, atau institusi. Jadwal 13D menunjukkan bahwa investor memegang (atau pernah memegang) lebih dari 5% saham perusahaan dan bermaksud (atau pernah bermaksud) untuk secara aktif mengejar perubahan strategi bisnis. Jadwal 13G menunjukkan investasi pasif lebih dari 5%.
The share price as of September 5, 2025 is 125.03 / share. Previously, on September 9, 2024, the share price was 110.52 / share. This represents an increase of 13.13% over that period.
Skor Sentimen Dana
Skor Sentimen Dana (sebelumnya dikenal sebagai Skor Akumulasi Kepemilikan) menemukan saham-saham yang paling banyak dibeli oleh dana. Ini adalah hasil dari model kuantitatif multi-faktor yang canggih yang mengidentifikasi perusahaan dengan tingkat akumulasi institusional tertinggi. Model penilaian menggunakan kombinasi dari total peningkatan pemilik yang diungkapkan, perubahan dalam alokasi portofolio pada pemilik tersebut, dan metrik lainnya. Angka berkisar dari 0 hingga 100, dengan angka yang lebih tinggi menunjukkan tingkat akumulasi yang lebih tinggi dibandingkan dengan perusahaan sejenisnya, dan 50 adalah rata-ratanya.
Frekuensi Pembaruan: Setiap Hari
Lihat Ownership Explorer, yang menyediakan daftar perusahaan dengan peringkat tertinggi.
Rasio Put/Call Institusional
Selain melaporkan isu ekuitas dan utang standar, institusi dengan aset di bawah manajemen lebih dari 100 juta dolar AS juga harus mengungkapkan kepemilikan opsi put dan call mereka. Karena opsi put umumnya menunjukkan sentimen negatif, dan opsi call menunjukkan sentimen positif, kita dapat mengetahui sentimen institusional secara keseluruhan dengan memplot rasio put terhadap call. Grafik di sebelah kanan memplot rasio put/call historis untuk instrumen ini.
Menggunakan Rasio Put/Call sebagai indikator sentimen investor mengatasi salah satu kekurangan utama dari penggunaan total kepemilikan institusional, yaitu sejumlah besar aset yang dikelola diinvestasikan secara pasif untuk melacak indeks. Dana yang dikelola secara pasif biasanya tidak membeli opsi, sehingga indikator rasio put/call lebih akurat dalam melacak sentimen dana yang dikelola secara aktif.

Pengajuan 13F dan NPORT
Detail pada pengajuan 13F tersedia gratis. Detail pada pengajuan NP memerlukan keanggotaan premium. Baris berwarna hijau menunjukkan posisi baru. Baris berwarna merah menunjukkan posisi yang sudah ditutup. Klik tautan ini ikon untuk melihat riwayat transaksi selengkapnya.
Tingkatkan
untuk membuka data premium dan mengekspor ke Excel ![]() .
.
| Tanggal File | Sumber | Investor | Ketik | Presyo ng Avg (Silangan) |
Saham | Δ Saham (%) |
Dilaporkan Nilai ($1000) |
Nilai Δ (%) |
Alokasi Port (%) |
|
|---|---|---|---|---|---|---|---|---|---|---|
| 2025-08-14 | 13F | Goldman Sachs Group Inc | 6,663 | 765 | ||||||
| 2025-07-29 | 13F | Empirical Asset Management, LLC | 14,716 | 1.48 | 1,690 | 6.96 | ||||
| 2025-07-16 | 13F | Perigon Wealth Management, LLC | 16,882 | -0.59 | 1,939 | 4.76 | ||||
| 2025-07-01 | 13F | Park National Corp /oh/ | 10,919 | 0.83 | 1,254 | 6.27 | ||||
| 2025-08-06 | 13F | Wedbush Securities Inc | 2,109 | -0.19 | 0 | |||||
| 2025-08-06 | 13F | Commonwealth Equity Services, Llc | 69,240 | -1.55 | 8 | 0.00 | ||||
| 2025-08-15 | 13F | Truefg, Llc | 2,315 | 266 | ||||||
| 2025-08-07 | 13F | Cahill Financial Advisors Inc | 1,970 | 0.00 | 226 | 5.61 | ||||
| 2025-08-05 | 13F | American Institute for Advanced Investment Management, LLP | 1,755 | -46.49 | 202 | -43.70 | ||||
| 2025-08-11 | 13F | Citigroup Inc | 742 | 0.00 | 85 | 6.25 | ||||
| 2025-08-11 | 13F | Nations Financial Group Inc, /ia/ /adv | 3,204 | -1.51 | 368 | 3.67 | ||||
| 2025-04-29 | 13F | Resources Investment Advisors, LLC. | 0 | -100.00 | 0 | -100.00 | ||||
| 2025-08-05 | 13F | Fortress Wealth Group, LLC | 38,247 | -4.18 | 4,464 | 5.91 | ||||
| 2025-08-11 | 13F | Principal Securities, Inc. | 1,012 | -1.46 | 116 | -1.69 | ||||
| 2025-08-29 | 13F | Centaurus Financial, Inc. | 1,776 | 12.33 | 0 | |||||
| 2025-07-15 | 13F | Mather Group, Llc. | 0 | -100.00 | 0 | |||||
| 2025-07-09 | 13F | Keystone Wealth Services, LLC | 8,187 | -2.22 | 940 | 3.07 | ||||
| 2025-07-28 | 13F | RFG Advisory, LLC | 2,879 | -1.34 | 331 | 3.77 | ||||
| 2025-07-30 | 13F/A | KPP Advisory Services LLC | 3,463 | 0.00 | 398 | 5.31 | ||||
| 2025-07-18 | 13F | Pure Financial Advisors, Inc. | 2,105 | 2.09 | 242 | 7.59 | ||||
| 2025-08-07 | 13F | PFG Advisors | 5,364 | -2.28 | 616 | 3.01 | ||||
| 2025-08-14 | 13F | Integrated Wealth Concepts LLC | 1,896 | 218 | ||||||
| 2025-05-12 | 13F | Virtu Financial LLC | 0 | -100.00 | 0 | |||||
| 2025-07-14 | 13F | ABLE Financial Group, LLC | 0 | -100.00 | 0 | |||||
| 2025-05-12 | 13F | Independent Advisor Alliance | 0 | -100.00 | 0 | |||||
| 2025-05-14 | 13F | Flow Traders U.s. Llc | 0 | -100.00 | 0 | |||||
| 2025-08-14 | 13F | Old Mission Capital Llc | 5,053 | 580 | ||||||
| 2025-08-12 | 13F | Bedel Financial Consulting, Inc. | 16,900 | 0.00 | 1,941 | 7.54 | ||||
| 2025-07-03 | 13F | Higgins & Schmidt Wealth Strategies LLC | 4,804 | -2.16 | 552 | 2.99 | ||||
| 2025-08-14 | 13F | Financial Advisory Service, Inc. | 2,171 | -0.69 | 249 | 4.62 | ||||
| 2025-08-14 | 13F | IHT Wealth Management, LLC | 4,328 | -12.21 | 497 | -7.45 | ||||
| 2025-08-04 | 13F | Atria Investments Llc | 9,800 | -77.40 | 1,126 | -76.19 | ||||
| 2025-08-13 | 13F | Per Stirling Capital Management, LLC. | 41,839 | -35.60 | 4,805 | -32.13 | ||||
| 2025-08-14 | 13F | Mariner, LLC | 3,709 | -6.20 | 426 | -1.16 | ||||
| 2025-07-17 | 13F | Janney Montgomery Scott LLC | 48,931 | -6.39 | 6 | 0.00 | ||||
| 2025-08-13 | 13F | Northwestern Mutual Wealth Management Co | 56,553 | 18.44 | 6,495 | 24.83 | ||||
| 2025-07-17 | 13F | Sound Income Strategies, LLC | 0 | -100.00 | 0 | |||||
| 2025-07-17 | 13F | City Holding Co | 825 | 0.00 | 95 | 5.62 | ||||
| 2025-08-07 | 13F | Rathbone Brothers plc | 5,384 | -2.18 | 618 | 3.17 | ||||
| 2025-09-04 | 13F/A | Advisor Group Holdings, Inc. | 94,332 | -3.11 | 10,836 | 2.11 | ||||
| 2025-08-06 | 13F | Paladin Advisory Group, LLC | 31 | 4 | ||||||
| 2025-07-31 | 13F | Brinker Capital Investments, LLC | 0 | -100.00 | 0 | -100.00 | ||||
| 2025-08-12 | 13F | Quantum Private Wealth, LLC | 3,355 | 0.00 | 385 | 5.48 | ||||
| 2025-08-07 | 13F | Kestra Private Wealth Services, Llc | 42,671 | 6.86 | 4,901 | 12.62 | ||||
| 2025-05-05 | 13F | Lindbrook Capital, Llc | 275 | 0.00 | 30 | -6.45 | ||||
| 2025-07-29 | 13F | AssuredPartners Investment Advisors, LLC | 11,736 | -90.02 | 1,348 | -89.49 | ||||
| 2025-07-22 | 13F | Woodmont Investment Counsel Llc | 6,007 | 15.08 | 690 | 21.30 | ||||
| 2025-08-12 | 13F/A | Cozad Asset Management Inc | 14,414 | -0.82 | 1,655 | 4.55 | ||||
| 2025-08-14 | 13F | Comerica Bank | 19,256 | -0.95 | 2,212 | 4.39 | ||||
| 2025-08-12 | 13F | LPL Financial LLC | 914,162 | 0.26 | 104,991 | 5.66 | ||||
| 2025-07-17 | 13F | Sterling Investment Advisors, Ltd. | 10,195 | 0.00 | 1,171 | 5.31 | ||||
| 2025-07-23 | 13F | BankPlus Trust Department | 290 | 0.00 | 33 | 6.45 | ||||
| 2025-07-11 | 13F | Pinnacle Bancorp, Inc. | 100 | 0.00 | 11 | 10.00 | ||||
| 2025-07-22 | 13F | McElhenny Sheffield Capital Management, LLC | 51,000 | 51 | ||||||
| 2025-07-29 | 13F | Salomon & Ludwin, LLC | 90 | 0.00 | 11 | 11.11 | ||||
| 2025-08-08 | 13F | Intrua Financial, LLC | 1,866 | -2.81 | 214 | 2.39 | ||||
| 2025-08-13 | 13F | Luminist Capital LLC | 53 | 0.00 | 6 | 20.00 | ||||
| 2025-08-07 | 13F | Lakeridge Wealth Management LLC | 79,719 | 6.39 | 9,156 | 12.12 | ||||
| 2025-08-11 | 13F | Western Wealth Management, LLC | 36,555 | 4.21 | 4,198 | 9.84 | ||||
| 2025-07-25 | 13F | Priebe Wealth Holdings LLC | 8,459 | -53.09 | 972 | -50.59 | ||||
| 2025-08-15 | 13F | Kestra Advisory Services, LLC | 72,545 | -62.25 | 8,332 | -60.22 | ||||
| 2025-08-14 | 13F | Mpwm Advisory Solutions, Llc | 1,555 | 179 | ||||||
| 2025-08-14 | 13F | Marshall Investment Management, Llc | 0 | -100.00 | 0 | |||||
| 2025-08-14 | 13F | Fmr Llc | 4,921 | 37.73 | 565 | 45.24 | ||||
| 2025-08-14 | 13F | Potentia Wealth | 8,253 | -20.96 | 948 | -16.71 | ||||
| 2025-07-31 | 13F | Oppenheimer & Co Inc | 15,099 | -0.12 | 1,734 | 5.28 | ||||
| 2025-07-15 | 13F | LVZ Advisors, Inc. | 16,275 | 0.75 | 1,869 | 6.19 | ||||
| 2025-08-13 | 13F | MONECO Advisors, LLC | 3,854 | -13.86 | 443 | -9.24 | ||||
| 2025-08-05 | 13F | Sigma Planning Corp | 1,857 | -27.86 | 213 | -23.93 | ||||
| 2025-08-14 | 13F | Sunbelt Securities, Inc. | 204 | -0.49 | 24 | 4.55 | ||||
| 2025-08-13 | 13F | EverSource Wealth Advisors, LLC | 12 | 0.00 | 1 | 0.00 | ||||
| 2025-08-14 | 13F | Transamerica Financial Advisors, Inc. | 78 | 0.00 | 9 | |||||
| 2025-08-08 | 13F | Pnc Financial Services Group, Inc. | 3,365 | 0.18 | 387 | 5.46 | ||||
| 2025-07-25 | 13F | M3 Advisory Group, LLC | 1,939 | -1.57 | 223 | 3.74 | ||||
| 2025-04-29 | 13F | Hm Payson & Co | 1,737 | -22.35 | 189 | -26.74 | ||||
| 2025-08-12 | 13F | Steward Partners Investment Advisory, Llc | 5,586 | -1.69 | 642 | 3.55 | ||||
| 2025-08-01 | 13F | Envestnet Asset Management Inc | 17,025 | -13.31 | 1,955 | -8.64 | ||||
| 2025-07-22 | 13F | Belpointe Asset Management LLC | 3,391 | 0.00 | 389 | 5.42 | ||||
| 2025-05-02 | 13F | Cullen/frost Bankers, Inc. | 0 | -100.00 | 0 | |||||
| 2025-08-14 | 13F | Snowden Capital Advisors LLC | 20,799 | -0.18 | 2,389 | 5.20 | ||||
| 2025-08-14 | 13F | GWM Advisors LLC | 10,010 | -0.87 | 1,150 | 4.45 | ||||
| 2025-07-21 | 13F | Ameritas Advisory Services, LLC | 1,618 | -32.13 | 186 | -32.73 | ||||
| 2025-08-08 | 13F | Condor Capital Management | 2,918 | 0.00 | 335 | 5.35 | ||||
| 2025-07-15 | 13F | Farrell Financial LLC | 1,778 | 204 | ||||||
| 2025-07-29 | 13F | Chicago Partners Investment Group LLC | 59,810 | -0.67 | 7,146 | 10.74 | ||||
| 2025-07-23 | 13F | Element Wealth, LLC | 3,071 | 0.00 | 353 | 5.39 | ||||
| 2025-07-31 | 13F | Cambridge Investment Research Advisors, Inc. | 53,200 | -5.64 | 6 | 0.00 | ||||
| 2025-08-04 | 13F | Spire Wealth Management | 6 | -99.44 | 1 | -100.00 | ||||
| 2025-07-25 | 13F | Envestnet Portfolio Solutions, Inc. | 4,076 | 0.00 | 468 | 5.41 | ||||
| 2025-08-05 | 13F | Key FInancial Inc | 289 | 0.00 | 33 | 6.45 | ||||
| 2025-08-12 | 13F | Howe & Rusling Inc | 0 | -100.00 | 0 | |||||
| 2025-05-15 | 13F | Advisory Services Network, LLC | 0 | -100.00 | 0 | |||||
| 2025-07-29 | 13F | BKM Wealth Management, LLC | 1,942 | 7.53 | 223 | 13.78 | ||||
| 2025-08-07 | 13F | Allworth Financial LP | 2,077 | 0.05 | 239 | 9.68 | ||||
| 2025-08-14 | 13F | Stifel Financial Corp | 90,823 | -2.33 | 10,431 | 2.94 | ||||
| 2025-07-21 | 13F | Ameriflex Group, Inc. | 0 | -100.00 | 0 | |||||
| 2025-07-29 | 13F | Stratos Wealth Partners, LTD. | 41,409 | 7.47 | 4,756 | 13.24 | ||||
| 2025-08-18 | 13F/A | National Bank Of Canada /fi/ | 94 | -95.36 | 11 | -95.52 | ||||
| 2025-08-06 | 13F | Bensler, LLC | 2,189 | 251 | ||||||
| 2025-08-06 | 13F/A | Three Cord True Wealth Management, LLC | 116,858 | 4.97 | 13,421 | 10.62 | ||||
| 2025-08-11 | 13F | Anderson Financial Strategies, LLC | 0 | -100.00 | 0 | |||||
| 2025-08-12 | 13F | O'shaughnessy Asset Management, Llc | 680 | 78 | ||||||
| 2025-08-05 | 13F | GPS Wealth Strategies Group, LLC | 6,881 | 6.47 | 790 | 12.22 | ||||
| 2025-07-25 | 13F | Apollon Wealth Management, LLC | 4,696 | -0.09 | 539 | 5.27 | ||||
| 2025-07-14 | 13F | GAMMA Investing LLC | 927 | 0.00 | 106 | 4.95 | ||||
| 2025-08-14 | 13F | Hrt Financial Lp | 2,145 | 0 | ||||||
| 2025-08-14 | 13F | Great Valley Advisor Group, Inc. | 3,230 | -5.08 | 371 | 0.27 | ||||
| 2025-08-12 | 13F | Jpmorgan Chase & Co | 278 | -19.65 | 32 | -16.22 | ||||
| 2025-08-11 | 13F | Pinnacle Wealth Planning Services, Inc. | 2,097 | 0.00 | 241 | 5.26 | ||||
| 2025-08-14 | 13F | Jane Street Group, Llc | 0 | -100.00 | 0 | |||||
| 2025-08-14 | 13F | Raymond James Financial Inc | 487,310 | -4.26 | 55,968 | 0.90 | ||||
| 2025-08-04 | 13F | Creekmur Asset Management LLC | 136 | 0.00 | 16 | 7.14 | ||||
| 2025-07-29 | 13F | Crux Wealth Advisors | 7,996 | -58.47 | 918 | -56.24 | ||||
| 2025-08-19 | 13F | Anchor Investment Management, LLC | 273 | 0.00 | 31 | 6.90 | ||||
| 2025-08-13 | 13F | Elios Financial Group Inc. | 2,282 | -0.13 | 262 | 5.22 | ||||
| 2025-08-13 | 13F | Continuum Advisory, LLC | 0 | -100.00 | 0 | |||||
| 2025-07-08 | 13F | Nbc Securities, Inc. | 15,807 | 29.23 | 2 | 0.00 | ||||
| 2025-08-15 | 13F | Tower Research Capital LLC (TRC) | 5 | 66.67 | 1 | |||||
| 2025-08-14 | 13F | Wiley Bros.-aintree Capital, Llc | 14,516 | 98.50 | 1,667 | 110.75 | ||||
| 2025-08-12 | 13F | Global Retirement Partners, LLC | 956 | 0.31 | 110 | -0.91 | ||||
| 2025-08-11 | 13F | Hexagon Capital Partners LLC | 0 | -100.00 | 0 | |||||
| 2025-07-30 | 13F | Pacific Sun Financial Corp | 10,104 | -4.17 | 1,160 | 0.96 | ||||
| 2025-08-06 | 13F | Golden State Wealth Management, LLC | 289 | 0.35 | 33 | 6.45 | ||||
| 2025-08-13 | 13F | Twin Peaks Wealth Advisors, LLC | 134 | 16 | ||||||
| 2025-08-14 | 13F | Royal Bank Of Canada | 275,693 | 18.52 | 31,663 | 24.90 | ||||
| 2025-07-07 | 13F | Thurston, Springer, Miller, Herd & Titak, Inc. | 7,854 | 902 | ||||||
| 2025-07-30 | 13F | D.a. Davidson & Co. | 54,227 | -4.81 | 6,228 | 0.32 | ||||
| 2025-08-08 | 13F | Kingsview Wealth Management, LLC | 2,102 | -7.89 | 241 | -2.82 | ||||
| 2025-08-08 | 13F | Cetera Investment Advisers | 169,323 | -0.66 | 19,447 | 4.69 | ||||
| 2025-05-15 | 13F | Lido Advisors, LLC | 0 | -100.00 | 0 | |||||
| 2025-07-23 | 13F | Morey & Quinn Wealth Partners, LLC | 2,843 | -7.48 | 327 | -2.40 | ||||
| 2025-07-23 | 13F | Trifecta Capital Advisors, LLC | 134 | 0.00 | 15 | 7.14 | ||||
| 2025-08-12 | 13F | CIBC Private Wealth Group, LLC | 122 | -50.00 | 14 | -39.13 | ||||
| 2025-08-14 | 13F | Citadel Advisors Llc | 11,539 | -22.07 | 1,325 | -17.85 | ||||
| 2025-07-24 | 13F | Blair William & Co/il | 409 | 47 | ||||||
| 2025-08-08 | 13F | Gts Securities Llc | 14,259 | -74.48 | 1,638 | -73.12 | ||||
| 2025-08-12 | 13F | Nemes Rush Group LLC | 41 | 0.00 | 5 | 0.00 | ||||
| 2025-05-15 | 13F | National Wealth Management Group, LLC | 3,269 | -0.94 | 356 | -6.56 | ||||
| 2025-07-31 | 13F | FSM Wealth Advisors, LLC | 21,279 | 2,488 | ||||||
| 2025-07-18 | 13F | Truist Financial Corp | 18,408 | -3.00 | 2,114 | 2.22 | ||||
| 2025-08-06 | 13F | Moors & Cabot, Inc. | 3,553 | -2.12 | 408 | 3.29 | ||||
| 2025-07-28 | 13F | Private Wealth Asset Management, LLC | 854 | 0.00 | 98 | 5.38 | ||||
| 2025-08-14 | 13F | Benjamin Edwards Inc | 26,484 | -27.87 | 3,042 | -23.99 | ||||
| 2025-08-14 | 13F | CoreCap Advisors, LLC | 276 | 0.00 | 32 | 3.33 | ||||
| 2025-07-24 | 13F | IFP Advisors, Inc | 898 | 0.00 | 103 | 6.19 | ||||
| 2025-08-06 | 13F | Prospera Financial Services Inc | 31,699 | -4.38 | 3,641 | 0.77 | ||||
| 2025-08-13 | 13F | StoneX Group Inc. | 2,725 | -2.12 | 313 | 2.97 | ||||
| 2025-07-25 | 13F | Cwm, Llc | 5,031 | 0.06 | 1 | |||||
| 2025-08-14 | 13F | Susquehanna International Group, Llp | 40,988 | 285.15 | 4,707 | 306.13 | ||||
| 2025-08-13 | 13F | Virtue Capital Management, LLC | 0 | -100.00 | 0 | |||||
| 2025-08-12 | 13F | Proequities, Inc. | 0 | 0 | ||||||
| 2025-08-13 | 13F | Jones Financial Companies Lllp | 11,161 | 13.48 | 1,281 | 20.30 | ||||
| 2025-08-08 | 13F | Creative Planning | 13,234 | -34.00 | 1,520 | -30.48 | ||||
| 2025-05-01 | 13F | Quest 10 Wealth Builders, Inc. | 75 | -81.48 | 8 | -82.61 | ||||
| 2025-07-23 | 13F | Tcfg Wealth Management, Llc | 3,647 | 0.00 | 419 | 5.29 | ||||
| 2025-08-14 | 13F | UBS Group AG | 223,675 | 11.43 | 25,689 | 17.44 | ||||
| 2025-07-28 | 13F | Harbour Investments, Inc. | 12,684 | 6.13 | 1,457 | 11.83 | ||||
| 2025-08-14 | 13F | Wells Fargo & Company/mn | 782,117 | 14.99 | 89,826 | 21.18 | ||||
| 2025-07-31 | 13F | Aspen Capital Management, LLC | 2,084 | 0.00 | 239 | 5.29 | ||||
| 2025-08-12 | 13F | Richmond Investment Services, LLC | 4,178 | 100.10 | 480 | 111.01 | ||||
| 2025-08-08 | 13F | Avantax Advisory Services, Inc. | 23,151 | -14.65 | 2,659 | -10.08 | ||||
| 2025-08-19 | 13F | National Asset Management, Inc. | 64,951 | 75.22 | 7,460 | 73.91 | ||||
| 2025-04-21 | 13F | PSI Advisors, LLC | 0 | -100.00 | 0 | |||||
| 2025-07-07 | 13F | Park Edge Advisors, LLC | 2,871 | -5.43 | 330 | -0.30 | ||||
| 2025-07-10 | 13F | Three Seasons Wealth, LLC | 4,809 | -13.41 | 552 | -8.76 | ||||
| 2025-07-29 | 13F | Private Trust Co Na | 2,367 | -17.35 | 272 | -13.14 | ||||
| 2025-08-12 | 13F | MAI Capital Management | 2,351 | 0.00 | 270 | 5.47 | ||||
| 2025-07-24 | 13F | Us Bancorp \de\ | 3,645 | 1.25 | 419 | 6.63 | ||||
| 2025-07-15 | 13F | World Equity Group, Inc. | 3,468 | 5.73 | 398 | 11.48 | ||||
| 2025-07-25 | 13F | Atria Wealth Solutions, Inc. | 0 | -100.00 | 0 | |||||
| 2025-08-11 | 13F | United Advisor Group, LLC | 7,186 | 0.08 | 825 | 5.50 | ||||
| 2025-08-08 | 13F | Larson Financial Group LLC | 1,044 | 0.19 | 120 | 5.31 | ||||
| 2025-08-13 | 13F | First Trust Advisors Lp | 2,228 | 0.50 | 256 | 5.81 | ||||
| 2025-07-29 | 13F | Stephens Inc /ar/ | 11,144 | -0.13 | 1,280 | 5.18 | ||||
| 2025-08-08 | 13F | Citizens Financial Group Inc/ri | 7,339 | -59.70 | 843 | -57.56 | ||||
| 2025-07-11 | 13F | Farther Finance Advisors, LLC | 2,406 | -7.85 | 276 | -3.16 | ||||
| 2025-07-14 | 13F | Southland Equity Partners LLC | 7,267 | -0.62 | 835 | 4.77 | ||||
| 2025-08-11 | 13F | Private Advisor Group, LLC | 26,128 | 1.58 | 3,001 | 7.03 | ||||
| 2025-08-14 | 13F | Two Sigma Securities, Llc | 2,827 | 325 | ||||||
| 2025-08-15 | 13F | First Heartland Consultants, Inc. | 3,839 | -3.64 | 441 | 1.38 | ||||
| 2025-05-12 | 13F | Sandy Spring Bank | 387 | 0.00 | 42 | -4.55 | ||||
| 2025-07-23 | 13F | Trueblood Wealth Management, LLC | 1,758 | 202 | ||||||
| 2025-08-13 | 13F | Russell Investments Group, Ltd. | 9 | -25.00 | 1 | 0.00 | ||||
| 2025-08-04 | 13F | Assetmark, Inc | 1,075 | 1,785.96 | 123 | 1,950.00 | ||||
| 2025-08-13 | 13F | Baird Financial Group, Inc. | 176,257 | 7.28 | 20,243 | 13.06 | ||||
| 2025-08-18 | 13F/A | Westwood Holdings Group Inc | 1,987 | -26.35 | 228 | -22.45 | ||||
| 2025-08-08 | 13F | MTM Investment Management, LLC | 243 | 28 | ||||||
| 2025-08-12 | 13F | J.w. Cole Advisors, Inc. | 2,131 | 245 | ||||||
| 2025-08-14 | 13F | Warren Averett Asset Management, LLC | 2,417 | 278 | ||||||
| 2025-05-15 | 13F | Mercer Global Advisors Inc /adv | 0 | -100.00 | 0 | |||||
| 2025-07-21 | 13F | DHJJ Financial Advisors, Ltd. | 11,295 | -8.87 | 1,297 | -3.93 | ||||
| 2025-08-11 | 13F | Blue Bell Private Wealth Management, Llc | 2,900 | 0.00 | 333 | 5.38 | ||||
| 2025-08-15 | 13F | Morgan Stanley | 1,112,844 | -8.94 | 127,810 | -4.03 | ||||
| 2025-05-13 | 13F | Quadrant Capital Group Llc | 0 | -100.00 | 0 | |||||
| 2025-07-25 | 13F | Concurrent Investment Advisors, LLC | 1,815 | 208 | ||||||
| 2025-07-11 | 13F | Kaydan Wealth Management, Inc. | 12,849 | -1.09 | 1,476 | 4.24 | ||||
| 2025-08-18 | 13F | Geneos Wealth Management Inc. | 3,457 | 101.93 | 397 | 113.44 | ||||
| 2025-08-11 | 13F | Tidemark, LLC | 889 | 0.00 | 102 | 6.25 | ||||
| 2025-08-14 | 13F | Bank Of America Corp /de/ | 103,936 | -28.05 | 11,937 | -24.18 | ||||
| 2025-07-16 | 13F | Independent Wealth Network Inc. | 3,861 | -0.23 | 443 | 5.23 | ||||
| 2025-07-10 | 13F | Kozak & Associates, Inc. | 94 | 0.00 | 11 | 22.22 | ||||
| 2025-08-13 | 13F | Proactive Wealth Strategies LLC | 12,226 | 0.23 | 1 | 0.00 | ||||
| 2025-07-10 | 13F | Wealth Enhancement Advisory Services, Llc | 19,377 | 0.09 | 2,289 | 8.49 | ||||
| 2025-08-14 | 13F | Smartleaf Asset Management LLC | 101 | 0.00 | 12 | 10.00 | ||||
| 2025-08-15 | 13F | Cornerstone Financial Group, LLC /NE/ | 1,904 | 0.21 | 219 | 2.35 | ||||
| 2025-08-14 | 13F | Mml Investors Services, Llc | 6,875 | -25.27 | 1 | -100.00 | ||||
| 2025-08-13 | 13F | Solutions 4 Wealth, Ltd | 22,404 | 4.93 | 2,573 | 10.62 | ||||
| 2025-08-15 | 13F | Equitable Holdings, Inc. | 8,918 | -1.90 | 1,024 | 3.43 | ||||
| 2025-07-23 | 13F | Kingswood Wealth Advisors, Llc | 1,856 | 0.11 | 213 | 5.45 | ||||
| 2025-08-12 | 13F | SRS Capital Advisors, Inc. | 1,479 | -61.01 | 170 | -59.08 | ||||
| 2025-07-15 | 13F | BKA Wealth Consulting, Inc. | 2,096 | -0.14 | 241 | 5.26 | ||||
| 2025-08-11 | 13F | HighTower Advisors, LLC | 125,891 | 1.31 | 14,459 | 6.77 | ||||
| 2025-08-06 | 13F | Atlantic Union Bankshares Corp | 387 | 44 | ||||||
| 2025-07-23 | 13F | Bellevue Asset Management, Llc | 23,690 | -1.59 | 2,721 | 3.70 | ||||
| 2025-08-20 | 13F/A | Coppell Advisory Solutions LLC | 3,001 | 0.00 | 344 | 8.86 | ||||
| 2025-08-13 | 13F | Alerus Financial Na | 258 | 30 |
Other Listings
| MX:FNX |