Mga Batayang Estadistika
| Pemilik Institusional | 211 total, 211 long only, 0 short only, 0 long/short - change of 5.47% MRQ |
| Alokasi Portofolio Rata-rata | 0.1714 % - change of -17.43% MRQ |
| Saham Institusional (Jangka Panjang) | 10,731,203 (ex 13D/G) - change of -3.51MM shares -24.65% MRQ |
| Nilai Institusional (Jangka Panjang) | $ 519,329 USD ($1000) |
Kepemilikan Institusional dan Pemegang Saham
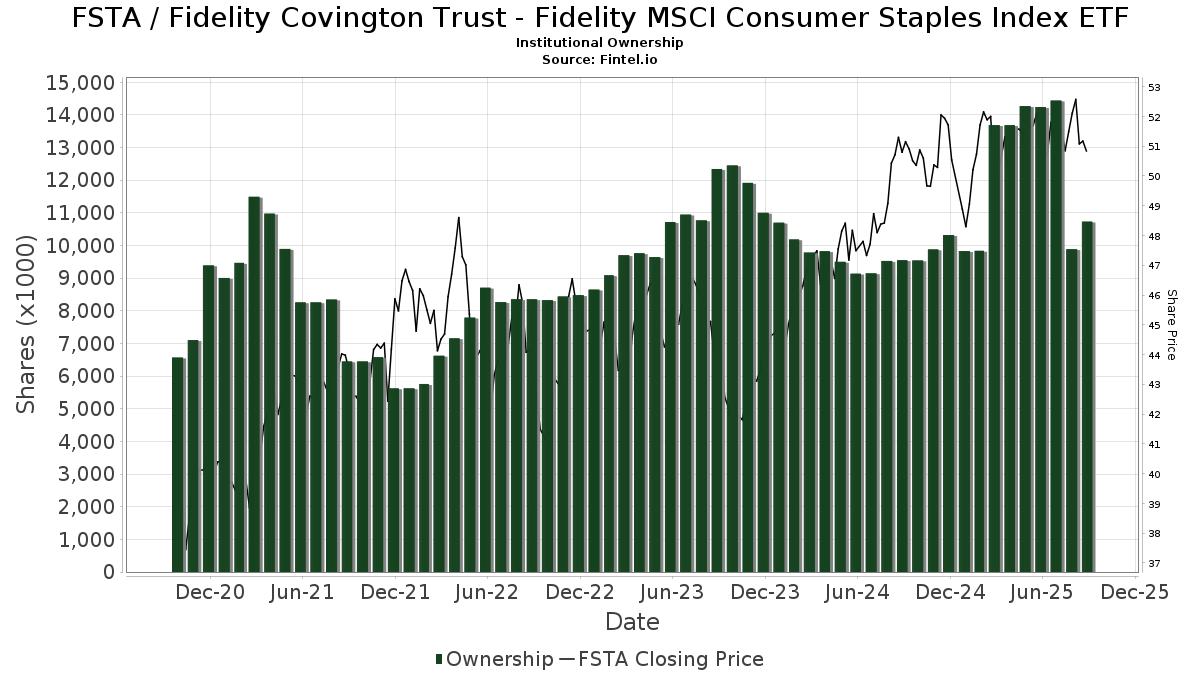
Fidelity Covington Trust - Fidelity MSCI Consumer Staples Index ETF (US:FSTA) memiliki 211 pemilik institusional dan pemegang saham yang telah mengajukan formulir 13D/G atau 13F kepada Komisi Bursa Efek (Securities Exchange Commission/SEC). Lembaga-lembaga ini memegang total 10,731,203 saham. Pemegang saham terbesar meliputi Charles Schwab Investment Management Inc, Lido Advisors, LLC, Advisor Group Holdings, Inc., Agf Management Ltd, Commonwealth Equity Services, Llc, LPL Financial LLC, Envestnet Asset Management Inc, Certified Advisory Corp, Compass Financial Group, INC/SD, and Northern Lights Fund Trust - PFG Fidelity Institutional AM® Equity Sector Strategy Fund Class R Shares .
Struktur kepemilikan institusional Fidelity Covington Trust - Fidelity MSCI Consumer Staples Index ETF (ARCA:FSTA) menunjukkan posisi terkini di perusahaan oleh institusi dan dana, serta perubahan terbaru dalam ukuran posisi. Pemegang saham utama dapat mencakup investor individu, reksa dana, dana lindung nilai, atau institusi. Jadwal 13D menunjukkan bahwa investor memegang (atau pernah memegang) lebih dari 5% saham perusahaan dan bermaksud (atau pernah bermaksud) untuk secara aktif mengejar perubahan strategi bisnis. Jadwal 13G menunjukkan investasi pasif lebih dari 5%.
The share price as of September 5, 2025 is 51.40 / share. Previously, on September 9, 2024, the share price was 51.23 / share. This represents an increase of 0.33% over that period.
Skor Sentimen Dana
Skor Sentimen Dana (sebelumnya dikenal sebagai Skor Akumulasi Kepemilikan) menemukan saham-saham yang paling banyak dibeli oleh dana. Ini adalah hasil dari model kuantitatif multi-faktor yang canggih yang mengidentifikasi perusahaan dengan tingkat akumulasi institusional tertinggi. Model penilaian menggunakan kombinasi dari total peningkatan pemilik yang diungkapkan, perubahan dalam alokasi portofolio pada pemilik tersebut, dan metrik lainnya. Angka berkisar dari 0 hingga 100, dengan angka yang lebih tinggi menunjukkan tingkat akumulasi yang lebih tinggi dibandingkan dengan perusahaan sejenisnya, dan 50 adalah rata-ratanya.
Frekuensi Pembaruan: Setiap Hari
Lihat Ownership Explorer, yang menyediakan daftar perusahaan dengan peringkat tertinggi.
Rasio Put/Call Institusional
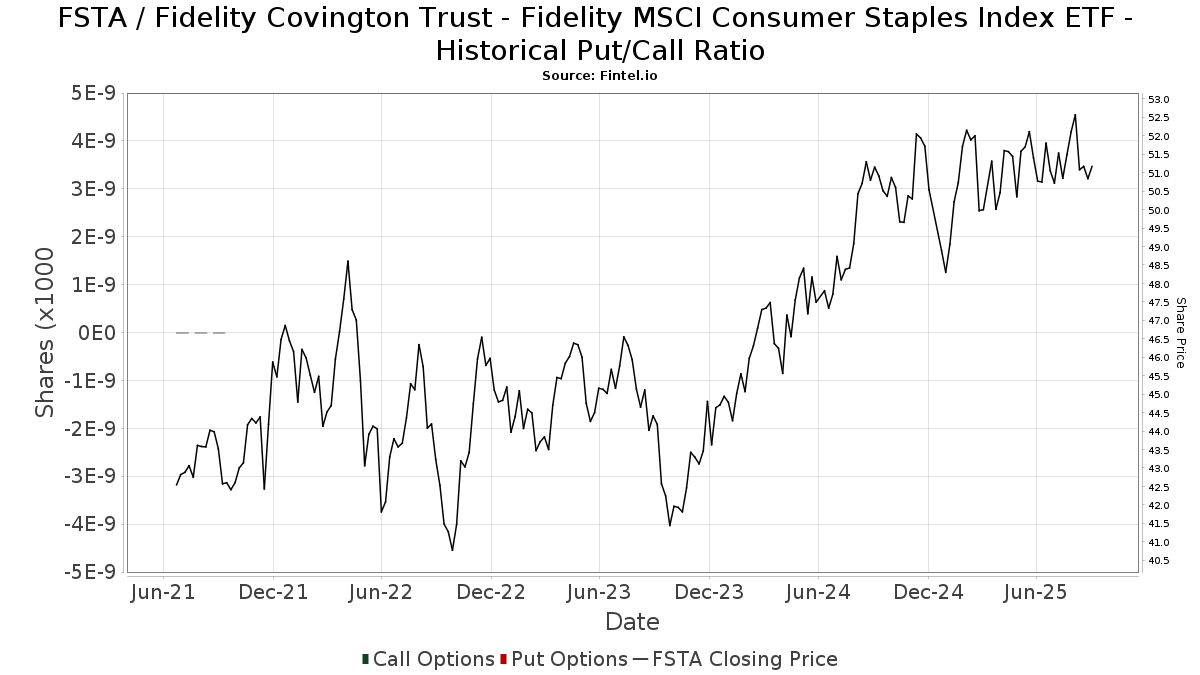
Selain melaporkan isu ekuitas dan utang standar, institusi dengan aset di bawah manajemen lebih dari 100 juta dolar AS juga harus mengungkapkan kepemilikan opsi put dan call mereka. Karena opsi put umumnya menunjukkan sentimen negatif, dan opsi call menunjukkan sentimen positif, kita dapat mengetahui sentimen institusional secara keseluruhan dengan memplot rasio put terhadap call. Grafik di sebelah kanan memplot rasio put/call historis untuk instrumen ini.
Menggunakan Rasio Put/Call sebagai indikator sentimen investor mengatasi salah satu kekurangan utama dari penggunaan total kepemilikan institusional, yaitu sejumlah besar aset yang dikelola diinvestasikan secara pasif untuk melacak indeks. Dana yang dikelola secara pasif biasanya tidak membeli opsi, sehingga indikator rasio put/call lebih akurat dalam melacak sentimen dana yang dikelola secara aktif.
Pengajuan 13F dan NPORT
Detail pada pengajuan 13F tersedia gratis. Detail pada pengajuan NP memerlukan keanggotaan premium. Baris berwarna hijau menunjukkan posisi baru. Baris berwarna merah menunjukkan posisi yang sudah ditutup. Klik tautan ini ikon untuk melihat riwayat transaksi selengkapnya.
Tingkatkan
untuk membuka data premium dan mengekspor ke Excel ![]() .
.
| Tanggal File | Sumber | Investor | Ketik | Presyo ng Avg (Silangan) |
Saham | Δ Saham (%) |
Dilaporkan Nilai ($1000) |
Nilai Δ (%) |
Alokasi Port (%) |
|
|---|---|---|---|---|---|---|---|---|---|---|
| 2025-08-12 | 13F | Steward Partners Investment Advisory, Llc | 17,413 | 21.38 | 891 | 21.42 | ||||
| 2025-07-22 | 13F | Partners Wealth Management, Llc | 15,995 | 0.00 | 821 | 0.49 | ||||
| 2025-08-08 | 13F | Foundations Investment Advisors, LLC | 98,888 | 9.43 | 5,058 | 9.48 | ||||
| 2025-05-27 | NP | EVVLX - The E-Valuator Very Conservative (0%-15%) RMS Fund Service Class Shares | 222 | -40.80 | 11 | -38.89 | ||||
| 2025-05-13 | 13F | Adams Wealth Management | 103,058 | 5,269 | ||||||
| 2025-08-12 | 13F | Jpmorgan Chase & Co | 68,841 | -3.54 | 3,521 | -3.51 | ||||
| 2025-08-29 | 13F | Centaurus Financial, Inc. | 3,085 | 9.01 | 0 | |||||
| 2025-05-13 | 13F | CacheTech Inc. | 103,058 | 5,269 | ||||||
| 2025-07-21 | 13F | Ameritas Advisory Services, LLC | 10,507 | -16.43 | 537 | -14.63 | ||||
| 2025-08-14 | 13F | Full Sail Capital, LLC | 90,921 | -0.94 | 4,651 | -0.92 | ||||
| 2025-07-14 | 13F | Sweeney & Michel, Llc | 18,000 | 0.44 | 918 | 6.87 | ||||
| 2025-07-30 | 13F | Financial Perspectives, Inc | 119,747 | 4.66 | 6,125 | 3.99 | ||||
| 2025-07-29 | 13F | Systelligence, LLC | 0 | -100.00 | 0 | |||||
| 2025-07-17 | 13F | Janney Montgomery Scott LLC | 5,045 | 4.32 | 0 | |||||
| 2025-08-04 | 13F | Creative Financial Designs Inc /adv | 5,583 | 13.80 | 286 | 14.00 | ||||
| 2025-07-17 | 13F | Beacon Capital Management, LLC | 118 | 0.85 | 6 | 20.00 | ||||
| 2025-08-14 | 13F | UBS Group AG | 53,378 | 0.44 | 2,730 | 0.48 | ||||
| 2025-08-01 | 13F | Envestnet Asset Management Inc | 225,612 | 27.35 | 11,540 | 27.40 | ||||
| 2025-08-14 | 13F | Integrated Wealth Concepts LLC | 0 | -100.00 | 0 | |||||
| 2025-08-14 | 13F | Snowden Capital Advisors LLC | 26,946 | -3.25 | 1,378 | -3.23 | ||||
| 2025-08-12 | 13F | Bokf, Na | 1,535 | 0.00 | 79 | 0.00 | ||||
| 2025-08-19 | 13F | Cape Investment Advisory, Inc. | 1,096 | 11.04 | 56 | 12.00 | ||||
| 2025-08-14 | 13F | Stifel Financial Corp | 48,151 | -4.35 | 2,463 | -4.31 | ||||
| 2025-08-12 | 13F | Charles Schwab Investment Management Inc | 2,260,071 | 0.19 | 115,603 | 0.23 | ||||
| 2025-08-14 | 13F | Fmr Llc | 56,039 | -20.80 | 2,866 | -20.76 | ||||
| 2025-04-29 | 13F | Element Wealth, LLC | 0 | -100.00 | 0 | |||||
| 2025-07-25 | 13F | Cwm, Llc | 1,672 | 1,462.62 | 0 | |||||
| 2025-08-04 | 13F | Spire Wealth Management | 1,144 | 13.04 | 59 | 13.73 | ||||
| 2025-08-07 | 13F | Kestra Private Wealth Services, Llc | 22,086 | -1.94 | 1,130 | -1.91 | ||||
| 2025-08-12 | 13F | Atlas Capital Advisors Llc | 95,118 | -26.64 | 4,865 | -26.61 | ||||
| 2025-08-14 | 13F | Quantinno Capital Management LP | 4,389 | 225 | ||||||
| 2025-08-14 | 13F/A | Rockefeller Capital Management L.P. | 28,840 | -4.98 | 1,475 | -4.90 | ||||
| 2025-08-14 | 13F | Susquehanna International Group, Llp | 51,653 | 137.29 | 2,642 | 137.59 | ||||
| 2025-07-16 | 13F | Fischer Financial Services, Inc. | 145,094 | 0.01 | 7,421 | 0.03 | ||||
| 2025-08-04 | 13F | FRG Family Wealth Advisors LLC | 32,285 | 51.15 | 1,651 | 51.19 | ||||
| 2025-07-17 | 13F | Wolff Wiese Magana Llc | 31 | 0.00 | 2 | 0.00 | ||||
| 2025-08-12 | 13F | Global Retirement Partners, LLC | 3,699 | 1.59 | 189 | 5.59 | ||||
| 2025-08-05 | 13F | Sigma Planning Corp | 34,705 | 2.08 | 1,775 | 2.13 | ||||
| 2025-08-18 | 13F | Geneos Wealth Management Inc. | 21 | -59.62 | 1 | -50.00 | ||||
| 2025-08-12 | 13F | Proequities, Inc. | 0 | 0 | ||||||
| 2025-07-16 | 13F | Brown, Lisle/cummings, Inc. | 23 | 0.00 | 1 | 0.00 | ||||
| 2025-08-15 | 13F | Kestra Advisory Services, LLC | 117,859 | 4.75 | 6,029 | 4.80 | ||||
| 2025-07-31 | 13F | CVA Family Office, LLC | 10 | 0.00 | 1 | |||||
| 2025-08-05 | 13F | Dunhill Financial, LLC | 974 | 50 | ||||||
| 2025-08-07 | 13F | Allworth Financial LP | 2,756 | -2.23 | 141 | -2.10 | ||||
| 2025-07-23 | 13F | Pillar Financial Advisors, LLC | 57 | 0.00 | 3 | 0.00 | ||||
| 2025-07-16 | 13F/A | CX Institutional | 4,122 | 108.08 | 0 | |||||
| 2025-04-23 | 13F | Mascagni Wealth Management, Inc. | 0 | -100.00 | 0 | |||||
| 2025-08-06 | 13F | Soltis Investment Advisors LLC | 8,376 | 3.37 | 428 | 3.38 | ||||
| 2025-08-14 | 13F | Sunbelt Securities, Inc. | 10,248 | 1.49 | 507 | -1.94 | ||||
| 2025-07-24 | 13F | Robertson Stephens Wealth Management, LLC | 4,533 | 0.00 | 232 | 0.00 | ||||
| 2025-07-16 | 13F | Southern Capital Advisors, Llc | 8,189 | 0.58 | 419 | 0.48 | ||||
| 2025-08-06 | 13F | Columbia River Financial Group, LLC | 0 | -100.00 | 0 | |||||
| 2025-08-14 | 13F | GWM Advisors LLC | 91,281 | -2.94 | 4,669 | -2.91 | ||||
| 2025-08-14 | 13F/A | Skopos Labs, Inc. | 551 | 28 | ||||||
| 2025-05-27 | NP | EVGLX - The E-Valuator Growth (70%-85%) RMS Fund Service Class Shares | 39,699 | -25.96 | 2,030 | -23.43 | ||||
| 2025-08-04 | 13F | Pensionmark Financial Group, Llc | 11,114 | 3.17 | 568 | 3.27 | ||||
| 2025-08-08 | 13F | Pnc Financial Services Group, Inc. | 10,553 | 3.58 | 540 | 3.65 | ||||
| 2025-07-22 | 13F | Yoder Wealth Management, Inc. | 34,067 | 3.34 | 1,743 | 3.38 | ||||
| 2025-07-30 | 13F | Brookstone Capital Management | 8,871 | -9.86 | 454 | -9.94 | ||||
| 2025-07-22 | 13F | Belpointe Asset Management LLC | 3,913 | 200 | ||||||
| 2025-07-31 | 13F | Moser Wealth Advisors, LLC | 93 | 5 | ||||||
| 2025-08-13 | 13F | Fisher Asset Management, LLC | 8,375 | -15.85 | 428 | -15.75 | ||||
| 2025-08-12 | 13F | Pathstone Holdings, LLC | 0 | -100.00 | 0 | |||||
| 2025-08-08 | 13F | Larson Financial Group LLC | 182,426 | 3.39 | 9,331 | 3.44 | ||||
| 2025-08-13 | 13F | KDK Private Wealth Management, LLC | 22,505 | -4.57 | 1,151 | -4.48 | ||||
| 2025-07-30 | 13F | Gables Capital Management Inc. | 308 | 0.00 | 16 | 0.00 | ||||
| 2025-08-15 | 13F | Tower Research Capital LLC (TRC) | 10,707 | 31,391.18 | 548 | 54,600.00 | ||||
| 2025-07-14 | 13F | Park Avenue Securities Llc | 8,781 | 31.61 | 0 | |||||
| 2025-08-06 | 13F | Agf Management Ltd | 424,991 | 1.50 | 21,738 | 1.54 | ||||
| 2025-08-14 | 13F | Sentinus, LLC | 6,406 | 328 | ||||||
| 2025-08-05 | 13F | GPS Wealth Strategies Group, LLC | 1,337 | 68 | ||||||
| 2025-04-23 | 13F | GHP Investment Advisors, Inc. | 0 | -100.00 | 0 | |||||
| 2025-07-18 | 13F | Bartlett & Co. Wealth Management Llc | 19 | 0.00 | 1 | |||||
| 2025-07-16 | 13F | Signature Resources Capital Management, LLC | 470 | 24 | ||||||
| 2025-07-29 | 13F | AssuredPartners Investment Advisors, LLC | 0 | -100.00 | 0 | |||||
| 2025-07-29 | 13F | FLC Capital Advisors | 5,003 | 0.00 | 256 | 0.00 | ||||
| 2025-07-30 | 13F | Whittier Trust Co | 1,885 | 0.00 | 96 | 0.00 | ||||
| 2025-05-09 | 13F | GeoWealth Management, LLC | 0 | -100.00 | 0 | |||||
| 2025-08-21 | 13F | Pathway Financial Advisers, LLC | 4,849 | 4.68 | 248 | 5.08 | ||||
| 2025-08-08 | 13F | Meridian Wealth Management, LLC | 12,508 | 0.55 | 640 | 0.63 | ||||
| 2025-08-13 | 13F | Jones Financial Companies Lllp | 13,919 | 50.90 | 709 | 52.80 | ||||
| 2025-08-11 | 13F | Brown Brothers Harriman & Co | 3,445 | 176 | ||||||
| 2025-04-24 | 13F | Wingate Wealth Advisors, Inc. | 0 | -100.00 | 0 | |||||
| 2025-08-08 | 13F | Cetera Investment Advisers | 72,589 | 21.67 | 3,713 | 21.70 | ||||
| 2025-08-11 | 13F | Heritage Wealth Advisors | 240 | 0.00 | 12 | 0.00 | ||||
| 2025-08-04 | 13F | UNIVEST FINANCIAL Corp | 0 | -100.00 | 0 | |||||
| 2025-08-12 | 13F | O'shaughnessy Asset Management, Llc | 7,117 | 2.79 | 364 | 2.82 | ||||
| 2025-08-14 | 13F | Bank Of America Corp /de/ | 56,699 | 17.62 | 2,900 | 17.69 | ||||
| 2025-08-13 | 13F | Colonial Trust Advisors | 0 | -100.00 | 0 | |||||
| 2025-07-31 | 13F | Cambridge Investment Research Advisors, Inc. | 98,934 | -0.25 | 5 | 0.00 | ||||
| 2025-08-08 | 13F | Kingsview Wealth Management, LLC | 5,977 | 2.57 | 306 | 2.69 | ||||
| 2025-05-14 | 13F | Apexium Financial, Lp | 0 | -100.00 | 0 | |||||
| 2025-07-24 | 13F | IFP Advisors, Inc | 3,412 | -0.87 | 175 | -0.57 | ||||
| 2025-07-30 | 13F | Retirement Planning Group | 5,372 | -5.09 | 275 | -5.19 | ||||
| 2025-03-21 | 13F | Prostatis Group LLC | 0 | -100.00 | 0 | |||||
| 2025-07-08 | 13F | Nbc Securities, Inc. | 7,606 | -5.76 | 0 | |||||
| 2025-07-30 | 13F | Bogart Wealth, LLC | 624 | 32 | ||||||
| 2025-08-12 | 13F | AlphaCore Capital LLC | 2,860 | 146 | ||||||
| 2025-08-14 | 13F | Hrt Financial Lp | 9,484 | 0 | ||||||
| 2025-07-30 | 13F | Demars Financial Group, LLC | 16,193 | -99.63 | 828 | 862.79 | ||||
| 2025-07-28 | 13F | Harbour Investments, Inc. | 2,418 | -0.82 | 124 | -0.81 | ||||
| 2025-07-21 | 13F | Fortis Capital Advisors, LLC | 3,913 | 200 | ||||||
| 2025-07-30 | 13F | Pacific Sun Financial Corp | 10,688 | -2.73 | 547 | -2.67 | ||||
| 2025-08-13 | 13F | EverSource Wealth Advisors, LLC | 50 | 0.00 | 3 | 0.00 | ||||
| 2025-08-14 | 13F | Citadel Advisors Llc | 64,961 | 3,323 | ||||||
| 2025-08-06 | 13F | Csenge Advisory Group | 6,456 | 0.00 | 338 | 1.81 | ||||
| 2025-08-07 | 13F | Parkside Financial Bank & Trust | 4 | 0.00 | 0 | |||||
| 2025-08-14 | 13F | Kovitz Investment Group Partners, LLC | 174,604 | 196.90 | 8,931 | 197.11 | ||||
| 2025-05-05 | 13F | Morningstar Investment Services LLC | 19,714 | -70.03 | 1 | -66.67 | ||||
| 2025-07-24 | 13F | Blair William & Co/il | 198 | 0.00 | 10 | 0.00 | ||||
| 2025-08-13 | 13F | Continuum Advisory, LLC | 0 | -100.00 | 0 | |||||
| 2025-05-27 | NP | EVMLX - The E-Valuator Moderate (50%-70%) RMS Fund Service Class Shares | 23,845 | -28.24 | 1,219 | -25.76 | ||||
| 2025-08-11 | 13F | HHM Wealth Advisors, LLC | 0 | -100.00 | 0 | |||||
| 2025-08-11 | 13F | Independent Advisor Alliance | 7,906 | 0.93 | 404 | 1.00 | ||||
| 2025-08-14 | 13F | Raymond James Financial Inc | 8,795 | 22.84 | 450 | 22.68 | ||||
| 2025-07-25 | 13F | Concord Wealth Partners | 102 | 0.99 | 5 | 0.00 | ||||
| 2025-08-19 | 13F | Newbridge Financial Services Group, Inc. | 343 | 0.00 | 18 | 0.00 | ||||
| 2025-08-14 | 13F | Jane Street Group, Llc | 14,006 | 716 | ||||||
| 2025-07-22 | 13F | Compass Financial Group, INC/SD | 218,431 | 10.04 | 11,173 | 10.08 | ||||
| 2025-07-25 | 13F | Envestnet Portfolio Solutions, Inc. | 11,659 | 51.40 | 596 | 51.65 | ||||
| 2025-08-14 | 13F | Federation des caisses Desjardins du Quebec | 1,410 | 0.00 | 72 | 0.00 | ||||
| 2025-07-16 | 13F | Dakota Wealth Management | 0 | -100.00 | 0 | |||||
| 2025-08-14 | 13F | Wells Fargo & Company/mn | 30,185 | 2.87 | 1,544 | 2.87 | ||||
| 2025-08-14 | 13F | Talon Private Wealth, LLC | 4,715 | -4.26 | 241 | -3.98 | ||||
| 2025-07-29 | 13F | TFC Financial Management | 905 | 0.00 | 46 | 0.00 | ||||
| 2025-07-14 | 13F | Buska Wealth Management, LLC | 23,300 | -12.13 | 1,192 | -12.10 | ||||
| 2025-07-14 | 13F | Pacifica Partners Inc. | 1,461 | 117.73 | 74 | 117.65 | ||||
| 2025-05-27 | NP | EVAGX - The E-Valuator Aggressive Growth (85%-99%) RMS Fund Service Class Shares | 40,585 | -17.86 | 2,075 | -15.03 | ||||
| 2025-07-31 | 13F | Briaud Financial Planning, Inc | 256 | 0 | ||||||
| 2025-06-30 | NP | Northern Lights Fund Trust - PFG Fidelity Institutional AM® Equity Sector Strategy Fund Class R Shares | 197,367 | -59.72 | 10,178 | -55.66 | ||||
| 2025-07-25 | 13F | Atria Wealth Solutions, Inc. | 52,791 | 1.80 | 2,710 | 2.23 | ||||
| 2025-07-28 | 13F | Rosenberg Matthew Hamilton | 2,986 | 0.00 | 153 | 0.00 | ||||
| 2025-07-18 | 13F | Truist Financial Corp | 17,684 | -4.77 | 905 | -4.74 | ||||
| 2025-07-21 | 13F | Curran Financial Partners, LLC | 12,957 | -1.17 | 663 | -1.19 | ||||
| 2025-07-29 | 13F | Private Trust Co Na | 1,007 | 113.80 | 52 | 112.50 | ||||
| 2025-08-13 | 13F | Summit Financial, LLC | 5,309 | -18.44 | 272 | -18.37 | ||||
| 2025-07-17 | 13F | Avondale Wealth Management | 1 | -100.00 | 0 | -100.00 | ||||
| 2025-05-27 | NP | EVCLX - The E-Valuator Conservative (15%-30%) RMS Fund Service Class Shares | 6,058 | 10.73 | 310 | 14.44 | ||||
| 2025-09-04 | 13F/A | Advisor Group Holdings, Inc. | 430,477 | 65.97 | 22,035 | 65.99 | ||||
| 2025-07-16 | 13F | Maridea Wealth Management LLC | 0 | -100.00 | 0 | |||||
| 2025-08-05 | 13F | Lifeworks Advisors, LLC | 72,232 | 91.90 | 3,695 | 92.00 | ||||
| 2025-08-15 | 13F | Morgan Stanley | 158,272 | 3.79 | 8,096 | 3.84 | ||||
| 2025-08-12 | 13F | Soundwatch Capital LLC | 3,951 | 2,341 | ||||||
| 2025-07-15 | 13F | Define Financial, Llc | 4,365 | 0.58 | 223 | 1.83 | ||||
| 2025-08-05 | 13F | Bank of New York Mellon Corp | 13,926 | 29.92 | 712 | 29.93 | ||||
| 2025-08-11 | 13F | Aptus Capital Advisors, LLC | 73 | 0.00 | 4 | 0.00 | ||||
| 2025-07-11 | 13F | Farther Finance Advisors, LLC | 426 | -57.86 | 22 | -58.82 | ||||
| 2025-08-11 | 13F | Wbi Investments, Inc. | 61,394 | -6.01 | 3,140 | -5.96 | ||||
| 2025-07-07 | 13F | Nova Wealth Management, Inc. | 17,537 | 11.71 | 897 | 11.85 | ||||
| 2025-08-08 | 13F | Thrive Capital Management, LLC | 0 | -100.00 | 0 | |||||
| 2025-08-14 | 13F | Smartleaf Asset Management LLC | 141 | -70.87 | 7 | -70.83 | ||||
| 2025-07-15 | 13F | Lynch & Associates/in | 27,978 | 0.49 | 1,431 | 0.56 | ||||
| 2025-08-14 | 13F | Mml Investors Services, Llc | 23,352 | 161.09 | 1 | |||||
| 2025-07-31 | 13F | Brinker Capital Investments, LLC | 0 | -100.00 | 0 | -100.00 | ||||
| 2025-07-23 | 13F | Heck Capital Advisors, LLC | 27,973 | 1.26 | 1,431 | 1.27 | ||||
| 2025-07-17 | 13F | Fifth Third Securities, Inc. | 4,561 | -4.76 | 233 | -4.51 | ||||
| 2025-08-13 | 13F | Green Harvest Asset Management LLC | 11,963 | -14.67 | 612 | -14.66 | ||||
| 2025-08-07 | 13F | 1620 Investment Advisors, Inc. | 118 | 0.00 | 6 | 0.00 | ||||
| 2025-07-31 | 13F | Sage Mountain Advisors LLC | 825 | 0.00 | 42 | 0.00 | ||||
| 2025-08-08 | 13F | Avantax Advisory Services, Inc. | 8,405 | 6.47 | 430 | 6.45 | ||||
| 2025-05-01 | 13F | Grant/GrossMendelsohn, LLC | 58,233 | 2,961 | ||||||
| 2025-08-07 | 13F | Resources Investment Advisors, LLC. | 3,997 | 204 | ||||||
| 2025-08-05 | 13F | EPG Wealth Management LLC | 685 | 0.44 | 35 | 2.94 | ||||
| 2025-08-12 | 13F | Howe & Rusling Inc | 119 | 6 | ||||||
| 2025-08-01 | 13F | SYM FINANCIAL Corp | 395 | 20 | ||||||
| 2025-04-23 | 13F | PMV Capital Advisers, LLC | 0 | -100.00 | 0 | |||||
| 2025-08-13 | 13F | Quadrant Capital Group Llc | 0 | -100.00 | 0 | |||||
| 2025-08-12 | 13F | MAI Capital Management | 2,270 | 2.76 | 116 | 3.57 | ||||
| 2025-08-13 | 13F | Capital Analysts, Inc. | 469 | 0.64 | 0 | |||||
| 2025-08-11 | 13F | HighTower Advisors, LLC | 10,573 | -23.63 | 541 | -23.62 | ||||
| 2025-08-11 | 13F | Sykon Capital Llc | 47,557 | 2,433 | ||||||
| 2025-07-15 | 13F | GSB Wealth Management, LLC | 8,342 | 10.61 | 427 | 10.65 | ||||
| 2025-05-14 | 13F | CIBC Private Wealth Group, LLC | 0 | -100.00 | 0 | -100.00 | ||||
| 2025-08-12 | 13F | J.w. Cole Advisors, Inc. | 78,244 | 76.41 | 4,002 | 76.53 | ||||
| 2025-08-08 | 13F | Creative Planning | 6,890 | 0.23 | 352 | 0.28 | ||||
| 2025-07-30 | 13F | Avidian Wealth Solutions, LLC | 8,564 | 0.00 | 438 | 0.23 | ||||
| 2025-08-12 | 13F | Coldstream Capital Management Inc | 0 | -100.00 | 0 | |||||
| 2025-08-04 | 13F | Assetmark, Inc | 111,090 | 926.43 | 5,682 | 927.49 | ||||
| 2025-08-14 | 13F | Certified Advisory Corp | 219,584 | 1.14 | 11,232 | 1.18 | ||||
| 2025-07-11 | 13F | LongView Wealth Management | 6,127 | 8.96 | 313 | 9.06 | ||||
| 2025-08-13 | 13F | Marshall Wace, Llp | 9,342 | 478 | ||||||
| 2025-08-04 | 13F | Arkadios Wealth Advisors | 47,423 | 15.87 | 2,426 | 15.92 | ||||
| 2025-07-30 | 13F | Crewe Advisors LLC | 0 | -100.00 | 0 | |||||
| 2025-08-15 | 13F | CI Private Wealth, LLC | 8,058 | 0.00 | 412 | 0.00 | ||||
| 2025-07-11 | 13F | Walker Financial Services, Inc. | 40,724 | 4.82 | 2,083 | 4.88 | ||||
| 2025-07-07 | 13F | Roxbury Financial LLC | 56,213 | -1.03 | 2,875 | -3.65 | ||||
| 2025-07-30 | 13F | Roman Butler Fullerton & Co | 8,820 | 0.00 | 453 | 0.89 | ||||
| 2025-07-16 | 13F | American National Bank | 14,877 | -8.52 | 761 | -8.54 | ||||
| 2025-08-13 | 13F | Colonial Trust Co / SC | 954 | 0.00 | 49 | 0.00 | ||||
| 2025-08-12 | 13F | LPL Financial LLC | 387,090 | 16.43 | 19,800 | 16.47 | ||||
| 2025-07-03 | 13F | TrueWealth Advisors, LLC | 9,026 | 0.00 | 462 | 0.00 | ||||
| 2025-07-10 | 13F | Oliver Lagore Vanvalin Investment Group | 169 | -65.86 | 9 | -66.67 | ||||
| 2025-07-08 | 13F | Parallel Advisors, LLC | 115 | 6 | ||||||
| 2025-08-14 | 13F | Comerica Bank | 14,924 | 0.04 | 763 | 0.13 | ||||
| 2025-07-08 | 13F | Atlas Brown,Inc. | 27,133 | -0.03 | 1,388 | 0.00 | ||||
| 2025-08-14 | 13F | Warren Averett Asset Management, LLC | 58,036 | 2,969 | ||||||
| 2025-08-06 | 13F | Commonwealth Equity Services, Llc | 422,155 | -3.05 | 22 | -4.55 | ||||
| 2025-08-04 | 13F | MeadowBrook Investment Advisors LLC | 0 | -100.00 | 0 | |||||
| 2025-05-27 | NP | EVTTX - The E-Valuator Conservative/Moderate (30%-50%) RMS Fund Service Class Shares | 3,801 | -14.74 | 194 | -11.82 | ||||
| 2025-07-21 | 13F | HighMark Wealth Management LLC | 100 | 0.00 | 5 | 0.00 | ||||
| 2025-07-16 | 13F | Signaturefd, Llc | 40 | 2 | ||||||
| 2025-07-30 | 13F | Cullen/frost Bankers, Inc. | 687 | 61.27 | 35 | 66.67 | ||||
| 2025-04-28 | 13F | Strategic Financial Concepts, LLC | 0 | -100.00 | 0 | -100.00 | ||||
| 2025-07-17 | 13F | Smith, Salley & Associates | 23,706 | 0.76 | 1,213 | 0.83 | ||||
| 2025-08-06 | 13F | Stonebridge Financial Planning Group, LLC | 9,108 | 0.00 | 466 | 0.00 | ||||
| 2025-08-14 | 13F | Mariner, LLC | 10,588 | -3.80 | 542 | -3.74 | ||||
| 2025-08-13 | 13F | Lido Advisors, LLC | 1,399,498 | 5.06 | 71,584 | 5.10 | ||||
| 2025-08-12 | 13F | SRS Capital Advisors, Inc. | 43,508 | 18.82 | 2,248 | 20.03 | ||||
| 2025-08-12 | 13F | Franklin Resources Inc | 0 | -100.00 | 0 | |||||
| 2025-08-19 | 13F | Asset Dedication, LLC | 1,055 | 0.00 | 54 | 0.00 | ||||
| 2025-05-15 | 13F | D. E. Shaw & Co., Inc. | 0 | -100.00 | 0 | -100.00 | ||||
| 2025-08-06 | 13F | AE Wealth Management LLC | 133,958 | 9.24 | 6,852 | 9.27 | ||||
| 2025-08-11 | 13F | Private Advisor Group, LLC | 0 | -100.00 | 0 | |||||
| 2025-08-05 | 13F | Huntington National Bank | 0 | |||||||
| 2025-08-14 | 13F | Goldman Sachs Group Inc | 122,003 | 0.00 | 6,240 | 0.03 | ||||
| 2025-04-28 | 13F | UMA Financial Services, Inc. | 0 | -100.00 | 0 | |||||
| 2025-07-17 | 13F | Sound Income Strategies, LLC | 59 | 0.00 | 3 | 0.00 | ||||
| 2025-07-28 | 13F | RFG Advisory, LLC | 8,600 | -25.77 | 440 | -25.84 | ||||
| 2025-07-02 | 13F | Marotta Asset Management | 102,599 | 13.50 | 5,248 | 13.72 | ||||
| 2025-07-28 | 13F | Acorn Financial Advisory Services Inc /adv | 5,726 | 35.72 | 293 | 35.81 | ||||
| 2025-08-04 | 13F | Atria Investments Llc | 4,690 | 240 | ||||||
| 2025-08-14 | 13F | Two Sigma Investments, Lp | 7,400 | 379 | ||||||
| 2025-08-12 | 13F | OneAscent Financial Services LLC | 14,879 | 1 | ||||||
| 2025-08-06 | 13F | Valued Wealth Advisors LLC | 93 | 0.00 | 5 | 0.00 | ||||
| 2025-08-13 | 13F | Russell Investments Group, Ltd. | 72 | 380.00 | 4 | |||||
| 2025-08-14 | 13F | Royal Bank Of Canada | 13,205 | 12.86 | 675 | 12.88 | ||||
| 2025-07-30 | 13F | VCI Wealth Management LLC | 15,475 | 7.15 | 792 | 7.18 | ||||
| 2025-08-19 | 13F | Advisory Services Network, LLC | 0 | -100.00 | 0 | |||||
| 2025-05-16 | 13F | McIlrath & Eck, LLC | 0 | -100.00 | 0 | |||||
| 2025-08-01 | 13F | Liberty Wealth Management Llc | 3,937 | 201 | ||||||
| 2025-08-04 | 13F | Prairie Wealth Advisors, Inc. | 9,952 | 7.00 | 509 | 7.16 | ||||
| 2025-07-21 | 13F | Exchange Capital Management, Inc. | 20,562 | -1.98 | 1,052 | -1.96 | ||||
| 2025-08-01 | 13F | Rossby Financial, LCC | 396 | 0.00 | 20 | 0.00 | ||||
| 2025-08-12 | 13F | Coston, McIsaac & Partners | 1,030 | 0.59 | 0 | |||||
| 2025-08-14 | 13F | Ameriprise Financial Inc | 42,846 | 73.49 | 2,191 | 73.53 | ||||
| 2025-07-30 | 13F | Mid-American Wealth Advisory Group, Inc. | 73 | 4 | ||||||
| 2025-07-16 | 13F | Beaumont Financial Advisors, LLC | 37,885 | 1.33 | 1,938 | 1.36 | ||||
| 2025-07-21 | 13F | Ameriflex Group, Inc. | 214 | 0.00 | 11 | 0.00 | ||||
| 2025-07-16 | 13F | Castleview Partners, Llc | 5,811 | -32.72 | 297 | -32.65 | ||||
| 2025-07-22 | 13F | Mascoma Wealth Management LLC | 424 | 0.00 | 22 | 0.00 | ||||
| 2025-08-11 | 13F | Principal Securities, Inc. | 36,125 | -14.93 | 1,848 | -12.01 | ||||
| 2025-07-23 | 13F | Godsey & Gibb Associates | 400 | 0.00 | 20 | 0.00 | ||||
| 2025-08-04 | 13F | Keybank National Association/oh | 6,826 | 0.00 | 349 | 0.00 | ||||
| 2025-08-11 | 13F | Citigroup Inc | 11,497 | 6.77 | 588 | 6.91 | ||||
| 2025-08-13 | 13F | Northwestern Mutual Wealth Management Co | 22,762 | 805.77 | 1,164 | 809.38 |