Mga Batayang Estadistika
| Pemilik Institusional | 94 total, 92 long only, 0 short only, 2 long/short - change of 1.06% MRQ |
| Alokasi Portofolio Rata-rata | 0.1781 % - change of 7.91% MRQ |
| Saham Institusional (Jangka Panjang) | 8,213,692 (ex 13D/G) - change of 1.98MM shares 31.71% MRQ |
| Nilai Institusional (Jangka Panjang) | $ 118,131 USD ($1000) |
Kepemilikan Institusional dan Pemegang Saham
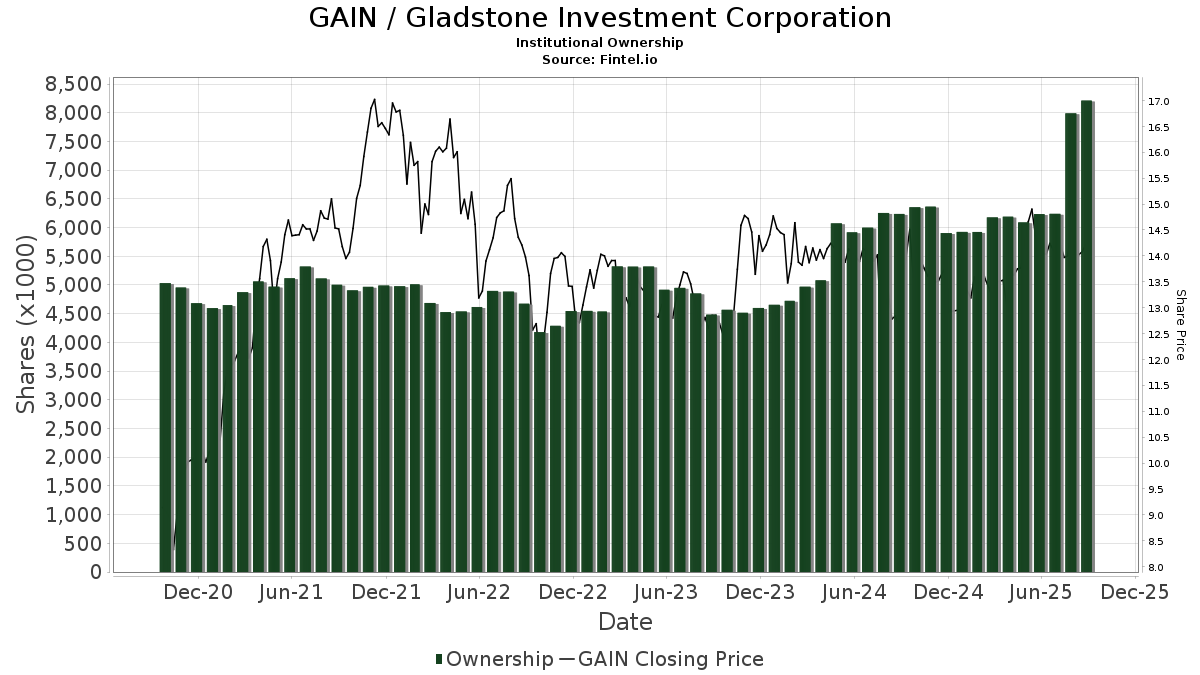
Gladstone Investment Corporation (US:GAIN) memiliki 94 pemilik institusional dan pemegang saham yang telah mengajukan formulir 13D/G atau 13F kepada Komisi Bursa Efek (Securities Exchange Commission/SEC). Lembaga-lembaga ini memegang total 8,213,692 saham. Pemegang saham terbesar meliputi Kingstone Capital Partners Texas, LLC, Melia Wealth LLC, Van Eck Associates Corp, BIZD - VanEck Vectors BDC Income ETF, Morgan Stanley, UBS Group AG, BlackRock, Inc., Legal & General Group Plc, Outfitter Financial LLC, and LPL Financial LLC .
Struktur kepemilikan institusional Gladstone Investment Corporation (NasdaqGS:GAIN) menunjukkan posisi terkini di perusahaan oleh institusi dan dana, serta perubahan terbaru dalam ukuran posisi. Pemegang saham utama dapat mencakup investor individu, reksa dana, dana lindung nilai, atau institusi. Jadwal 13D menunjukkan bahwa investor memegang (atau pernah memegang) lebih dari 5% saham perusahaan dan bermaksud (atau pernah bermaksud) untuk secara aktif mengejar perubahan strategi bisnis. Jadwal 13G menunjukkan investasi pasif lebih dari 5%.
The share price as of September 5, 2025 is 14.21 / share. Previously, on September 9, 2024, the share price was 12.51 / share. This represents an increase of 13.59% over that period.
Skor Sentimen Dana
Skor Sentimen Dana (sebelumnya dikenal sebagai Skor Akumulasi Kepemilikan) menemukan saham-saham yang paling banyak dibeli oleh dana. Ini adalah hasil dari model kuantitatif multi-faktor yang canggih yang mengidentifikasi perusahaan dengan tingkat akumulasi institusional tertinggi. Model penilaian menggunakan kombinasi dari total peningkatan pemilik yang diungkapkan, perubahan dalam alokasi portofolio pada pemilik tersebut, dan metrik lainnya. Angka berkisar dari 0 hingga 100, dengan angka yang lebih tinggi menunjukkan tingkat akumulasi yang lebih tinggi dibandingkan dengan perusahaan sejenisnya, dan 50 adalah rata-ratanya.
Frekuensi Pembaruan: Setiap Hari
Lihat Ownership Explorer, yang menyediakan daftar perusahaan dengan peringkat tertinggi.
Rasio Put/Call Institusional
Selain melaporkan isu ekuitas dan utang standar, institusi dengan aset di bawah manajemen lebih dari 100 juta dolar AS juga harus mengungkapkan kepemilikan opsi put dan call mereka. Karena opsi put umumnya menunjukkan sentimen negatif, dan opsi call menunjukkan sentimen positif, kita dapat mengetahui sentimen institusional secara keseluruhan dengan memplot rasio put terhadap call. Grafik di sebelah kanan memplot rasio put/call historis untuk instrumen ini.
Menggunakan Rasio Put/Call sebagai indikator sentimen investor mengatasi salah satu kekurangan utama dari penggunaan total kepemilikan institusional, yaitu sejumlah besar aset yang dikelola diinvestasikan secara pasif untuk melacak indeks. Dana yang dikelola secara pasif biasanya tidak membeli opsi, sehingga indikator rasio put/call lebih akurat dalam melacak sentimen dana yang dikelola secara aktif.

Pengajuan 13F dan NPORT
Detail pada pengajuan 13F tersedia gratis. Detail pada pengajuan NP memerlukan keanggotaan premium. Baris berwarna hijau menunjukkan posisi baru. Baris berwarna merah menunjukkan posisi yang sudah ditutup. Klik tautan ini ikon untuk melihat riwayat transaksi selengkapnya.
Tingkatkan
untuk membuka data premium dan mengekspor ke Excel ![]() .
.
| Tanggal File | Sumber | Investor | Ketik | Presyo ng Avg (Silangan) |
Saham | Δ Saham (%) |
Dilaporkan Nilai ($1000) |
Nilai Δ (%) |
Alokasi Port (%) |
|
|---|---|---|---|---|---|---|---|---|---|---|
| 2025-08-13 | 13F | Invesco Ltd. | 51,478 | 735 | ||||||
| 2025-08-04 | 13F | Assetmark, Inc | 845 | 12 | ||||||
| 2025-08-14 | 13F | Citadel Advisors Llc | 0 | -100.00 | 0 | |||||
| 2025-08-12 | 13F | Virtu Financial LLC | 12,592 | 0 | ||||||
| 2025-08-12 | 13F | Proequities, Inc. | Put | 0 | 0 | |||||
| 2025-08-12 | 13F | Proequities, Inc. | Call | 0 | 0 | |||||
| 2025-05-05 | 13F | Lindbrook Capital, Llc | 0 | -100.00 | 0 | |||||
| 2025-07-11 | 13F | Caldwell Securities, Inc | 800 | 0.00 | 11 | 10.00 | ||||
| 2025-08-12 | 13F | Proequities, Inc. | 0 | 0 | ||||||
| 2025-08-14 | 13F | Two Sigma Investments, Lp | 56,075 | -29.13 | 800 | -24.31 | ||||
| 2025-08-11 | 13F | Private Advisor Group, LLC | 15,751 | 0.97 | 225 | 7.69 | ||||
| 2025-07-15 | 13F | Kentucky Trust Co | 2,000 | 0.00 | 29 | 7.69 | ||||
| 2025-07-22 | 13F | Valley National Advisers Inc | 150 | 0.00 | 0 | |||||
| 2025-08-18 | 13F/A | National Bank Of Canada /fi/ | 1,000 | 0.00 | 14 | 7.69 | ||||
| 2025-05-14 | 13F | Susquehanna International Group, Llp | Call | 0 | -100.00 | 0 | -100.00 | |||
| 2025-07-23 | 13F | Hardy Reed LLC | 10,733 | 5.57 | 153 | 13.33 | ||||
| 2025-08-11 | 13F | United Advisor Group, LLC | 78,434 | 2.73 | 1,119 | 9.71 | ||||
| 2025-08-06 | 13F | Atlantic Union Bankshares Corp | 85,613 | -3.39 | 1,222 | 3.21 | ||||
| 2025-08-12 | 13F | Jpmorgan Chase & Co | 5,304 | 960.80 | 76 | 1,150.00 | ||||
| 2025-07-30 | 13F | Prosperity Financial Group, Inc. | 24,700 | -22.20 | 352 | -16.98 | ||||
| 2025-08-14 | 13F | Colony Group, LLC | 19,855 | 1.68 | 283 | 8.85 | ||||
| 2025-08-14 | 13F | Citadel Advisors Llc | Put | 0 | -100.00 | 0 | ||||
| 2025-07-21 | 13F | DHJJ Financial Advisors, Ltd. | 5 | 0.00 | 0 | |||||
| 2025-08-14 | 13F | Susquehanna International Group, Llp | 32,155 | 4.97 | 459 | 11.98 | ||||
| 2025-05-29 | NP | JAFEX - Total Stock Market Index Trust NAV | 39 | -94.73 | 1 | -100.00 | ||||
| 2025-08-14 | 13F | Qube Research & Technologies Ltd | 0 | -100.00 | 0 | |||||
| 2025-08-14 | 13F | Susquehanna International Group, Llp | Put | 71,100 | 17.52 | 1,015 | 25.50 | |||
| 2025-08-04 | 13F | Creekmur Asset Management LLC | 0 | -100.00 | 0 | |||||
| 2025-08-18 | 13F | Geneos Wealth Management Inc. | 8,849 | 4.60 | 126 | 11.50 | ||||
| 2025-08-14 | 13F | Bank Of America Corp /de/ | 2,404 | -75.26 | 34 | -73.64 | ||||
| 2025-08-14 | 13F | Van Eck Associates Corp | 836,641 | 3.49 | 12 | 10.00 | ||||
| 2025-08-21 | NP | BIZD - VanEck Vectors BDC Income ETF | 834,567 | 2.85 | 11,909 | 9.86 | ||||
| 2025-08-14 | 13F | Two Sigma Advisers, Lp | 0 | -100.00 | 0 | |||||
| 2025-08-14 | 13F | Hrt Financial Lp | 57,501 | 260.39 | 1 | |||||
| 2025-07-22 | 13F | DAVENPORT & Co LLC | 135,262 | -12.47 | 1,930 | -6.54 | ||||
| 2025-07-28 | 13F | Harbour Investments, Inc. | 10 | 0.00 | 0 | |||||
| 2025-08-14 | 13F | UBS Group AG | 255,656 | 15.63 | 3,648 | 23.54 | ||||
| 2025-08-12 | 13F | MAI Capital Management | 871 | 56.37 | 12 | 71.43 | ||||
| 2025-07-29 | 13F | Albert D Mason Inc | 48,056 | -6.22 | 686 | 0.15 | ||||
| 2025-08-06 | 13F | Commonwealth Equity Services, Llc | 36,633 | 5.84 | 1 | |||||
| 2025-06-27 | NP | LBO - WHITEWOLF Publicly Listed Private Equity ETF | 2,456 | 14.23 | 34 | 13.79 | ||||
| 2025-07-22 | 13F | Coastal Investment Advisors, Inc. | 42,227 | 322.27 | 603 | 352.63 | ||||
| 2025-08-06 | 13F | First Horizon Advisors, Inc. | 2,259 | 32 | ||||||
| 2025-07-17 | 13F | Sound Income Strategies, LLC | 0 | -100.00 | 0 | |||||
| 2025-08-15 | 13F | Equitable Holdings, Inc. | 10,602 | 5.22 | 151 | 12.69 | ||||
| 2025-07-28 | 13F | Melia Wealth LLC | 1,133,030 | 4.06 | 16,168 | 11.15 | ||||
| 2025-07-08 | 13F | Parallel Advisors, LLC | 263 | -27.95 | 4 | -25.00 | ||||
| 2025-08-06 | 13F | Outfitter Financial LLC | 202,295 | 0.57 | 2,887 | 7.41 | ||||
| 2025-07-15 | 13F | North Star Investment Management Corp. | 5,000 | 0.00 | 71 | 7.58 | ||||
| 2025-08-12 | 13F | BlackRock, Inc. | 251,201 | 25.60 | 3,585 | 34.18 | ||||
| 2025-08-11 | 13F | United Capital Financial Advisers, Llc | 13,500 | 12.50 | 193 | 20.00 | ||||
| 2025-08-12 | 13F | Cornerstone Wealth Management, LLC | 10,479 | -11.41 | 150 | -5.70 | ||||
| 2025-08-14 | 13F | D. E. Shaw & Co., Inc. | 0 | -100.00 | 0 | |||||
| 2025-08-14 | 13F | Millennium Management Llc | 169,197 | 118.53 | 2,414 | 133.46 | ||||
| 2025-08-05 | 13F | Simplex Trading, Llc | 0 | -100.00 | 0 | |||||
| 2025-08-13 | 13F | Baird Financial Group, Inc. | 90,800 | -0.70 | 1,296 | 6.06 | ||||
| 2025-08-15 | 13F | Morgan Stanley | 286,395 | 11.79 | 4,087 | 19.40 | ||||
| 2025-07-16 | 13F | Signaturefd, Llc | 1,322 | 32.33 | 19 | 38.46 | ||||
| 2025-08-14 | 13F | Royal Bank Of Canada | 77,867 | 2.95 | 1,112 | 10.10 | ||||
| 2025-07-24 | 13F | Blair William & Co/il | 169,571 | 0.67 | 2,420 | 7.51 | ||||
| 2025-04-17 | 13F | Janney Montgomery Scott LLC | 0 | -100.00 | 0 | |||||
| 2025-08-13 | 13F | Garner Asset Management Corp | 36,805 | -2.38 | 525 | 4.37 | ||||
| 2025-08-04 | 13F | Roble, Belko & Company, Inc | 93 | 1.09 | 0 | |||||
| 2025-08-08 | 13F | Cetera Investment Advisers | 30,681 | 1.47 | 438 | 8.44 | ||||
| 2025-08-13 | 13F | EverSource Wealth Advisors, LLC | 1,200 | 0.00 | 17 | 6.25 | ||||
| 2025-08-07 | 13F | PFG Advisors | 100,404 | 0.00 | 1,433 | 6.79 | ||||
| 2025-08-14 | 13F | Jane Street Group, Llc | 14,193 | -37.14 | 203 | -32.89 | ||||
| 2025-08-12 | 13F | Advisors Asset Management, Inc. | 114,865 | -0.51 | 1,639 | 6.29 | ||||
| 2025-08-14 | 13F | Raymond James Financial Inc | 40,857 | 2.03 | 583 | 9.18 | ||||
| 2025-08-13 | 13F | Northwestern Mutual Wealth Management Co | 0 | -100.00 | 0 | |||||
| 2025-08-14 | 13F | Bnp Paribas Arbitrage, Sa | 0 | -100.00 | 0 | |||||
| 2025-08-07 | 13F | Allworth Financial LP | 5,030 | 38,592.31 | 72 | |||||
| 2025-07-11 | 13F | Kingstone Capital Partners Texas, LLC | 1,759,421 | 24 | ||||||
| 2025-08-14 | 13F | Aquatic Capital Management LLC | 0 | -100.00 | 0 | |||||
| 2025-08-14 | 13F | Comerica Bank | 950 | 14 | ||||||
| 2025-08-15 | 13F | Tower Research Capital LLC (TRC) | 971 | -75.46 | 14 | -75.47 | ||||
| 2025-08-19 | 13F | State of Wyoming | 12,033 | 204.32 | 172 | 228.85 | ||||
| 2025-08-01 | 13F | Envestnet Asset Management Inc | 16,794 | 0.27 | 240 | 7.17 | ||||
| 2025-07-11 | 13F | Farther Finance Advisors, LLC | 5,364 | 1.55 | 77 | 7.04 | ||||
| 2025-08-12 | 13F | LPL Financial LLC | 188,193 | 0.82 | 2,686 | 7.70 | ||||
| 2025-08-08 | 13F | Foundations Investment Advisors, LLC | 15,410 | 220 | ||||||
| 2025-08-27 | NP | Mason Capital Fund Trust - Fundamentals First ETF | 1,864 | 0.00 | 27 | 8.33 | ||||
| 2025-07-17 | 13F | Oakworth Capital, Inc. | 100 | 1 | ||||||
| 2025-08-13 | 13F | Quantbot Technologies LP | 7,392 | 105 | ||||||
| 2025-04-01 | NP | PSP - Invesco Global Listed Private Equity ETF This fund is a listed as child fund of Invesco Ltd. and if that institution has disclosed ownership in this security, then these positions will not be double counted when calculating total shares and total value | 108,956 | 162.65 | 1,472 | 153.18 | ||||
| 2025-08-04 | 13F | Creative Financial Designs Inc /adv | 600 | 0.00 | 9 | 0.00 | ||||
| 2025-08-14 | 13F | Fmr Llc | 0 | -100.00 | 0 | |||||
| 2025-04-25 | 13F | JNBA Financial Advisors | 0 | -100.00 | 0 | -100.00 | ||||
| 2025-07-10 | 13F | Exchange Traded Concepts, Llc | 1,901 | 27 | ||||||
| 2025-07-21 | 13F | Ameriflex Group, Inc. | 0 | -100.00 | 0 | |||||
| 2025-08-12 | 13F | Steward Partners Investment Advisory, Llc | 3,600 | 0.00 | 51 | 6.25 | ||||
| 2025-08-13 | 13F | Transce3nd, LLC | 35 | 288.89 | 0 | |||||
| 2025-08-14 | 13F | GWM Advisors LLC | 19,626 | 0.00 | 280 | 6.87 | ||||
| 2025-08-14 | 13F | Group One Trading, L.p. | Call | 400 | 6 | |||||
| 2025-08-15 | 13F | Great West Life Assurance Co /can/ | 37,238 | 6.09 | 1 | |||||
| 2025-05-14 | 13F | Virtus ETF Advisers LLC | 0 | -100.00 | 0 | |||||
| 2025-08-05 | 13F | Simplex Trading, Llc | Put | 10,500 | -12.50 | 0 | ||||
| 2025-08-05 | 13F | Simplex Trading, Llc | Call | 2,300 | 109.09 | 0 | ||||
| 2025-08-13 | 13F | Quadrant Capital Group Llc | 0 | -100.00 | 0 | |||||
| 2025-08-13 | 13F | Virtus Investment Advisers, Inc. | 53,768 | -38.03 | 767 | -33.82 | ||||
| 2025-09-04 | 13F/A | Advisor Group Holdings, Inc. | 24,828 | -5.97 | 354 | 0.57 | ||||
| 2025-08-14 | 13F | Federation des caisses Desjardins du Quebec | 0 | -100.00 | 0 | |||||
| 2025-07-21 | 13F | Pflug Koory, LLC | 675 | 0.00 | 10 | 0.00 | ||||
| 2025-04-25 | 13F | Morton Brown Family Wealth, LLC | 0 | -100.00 | 0 | |||||
| 2025-08-14 | 13F | Wells Fargo & Company/mn | 12,107 | -7.62 | 173 | -1.71 | ||||
| 2025-08-05 | 13F | Cassaday & Co Wealth Management LLC | 112,500 | 0.00 | 1,605 | 6.79 | ||||
| 2025-08-14 | 13F | Quarry LP | 1 | 0 | ||||||
| 2025-08-13 | 13F | Jones Financial Companies Lllp | 1,291 | 0.00 | 18 | 5.88 | ||||
| 2025-08-13 | 13F | Legacy Capital Wealth Partners, LLC | 102,257 | -3.61 | 1,459 | 2.96 | ||||
| 2025-07-28 | 13F | BRYN MAWR TRUST Co | 884 | 0.00 | 13 | 9.09 | ||||
| 2025-08-11 | 13F | Citigroup Inc | 1 | -99.96 | 0 | -100.00 | ||||
| 2025-06-25 | NP | VPC - Virtus Private Credit Strategy ETF | 79,260 | 5.63 | 1,090 | 7.50 | ||||
| 2025-08-25 | NP | TMVAX - RBC Microcap Value Fund A Shares | 10,200 | 0.00 | 146 | 6.62 | ||||
| 2025-08-13 | 13F | Northern Trust Corp | 24,854 | 101.13 | 355 | 114.55 | ||||
| 2025-07-18 | 13F | Union Bancaire Privee, UBP SA | 19,806 | 5.09 | 40,356 | 15,977.69 | ||||
| 2025-08-12 | 13F | Legal & General Group Plc | 242,600 | 0.00 | 3,462 | 6.72 | ||||
| 2025-08-08 | 13F | Larson Financial Group LLC | 224 | 1.82 | 3 | 50.00 | ||||
| 2025-04-23 | 13F | Spire Wealth Management | 0 | -100.00 | 0 | |||||
| 2025-07-30 | 13F | Mid-American Wealth Advisory Group, Inc. | 401 | 6 | ||||||
| 2025-08-13 | 13F | Marshall Wace, Llp | 29,972 | 428 | ||||||
| 2025-08-14 | 13F | Citadel Advisors Llc | Call | 77,100 | 30.24 | 1,100 | 39.24 |
Other Listings
| GB:0IVR |