Mga Batayang Estadistika
| Pemilik Institusional | 89 total, 89 long only, 0 short only, 0 long/short - change of 0.00% MRQ |
| Alokasi Portofolio Rata-rata | 0.3480 % - change of 61.04% MRQ |
| Saham Institusional (Jangka Panjang) | 2,345,608 (ex 13D/G) - change of -0.15MM shares -6.06% MRQ |
| Nilai Institusional (Jangka Panjang) | $ 245,242 USD ($1000) |
Kepemilikan Institusional dan Pemegang Saham
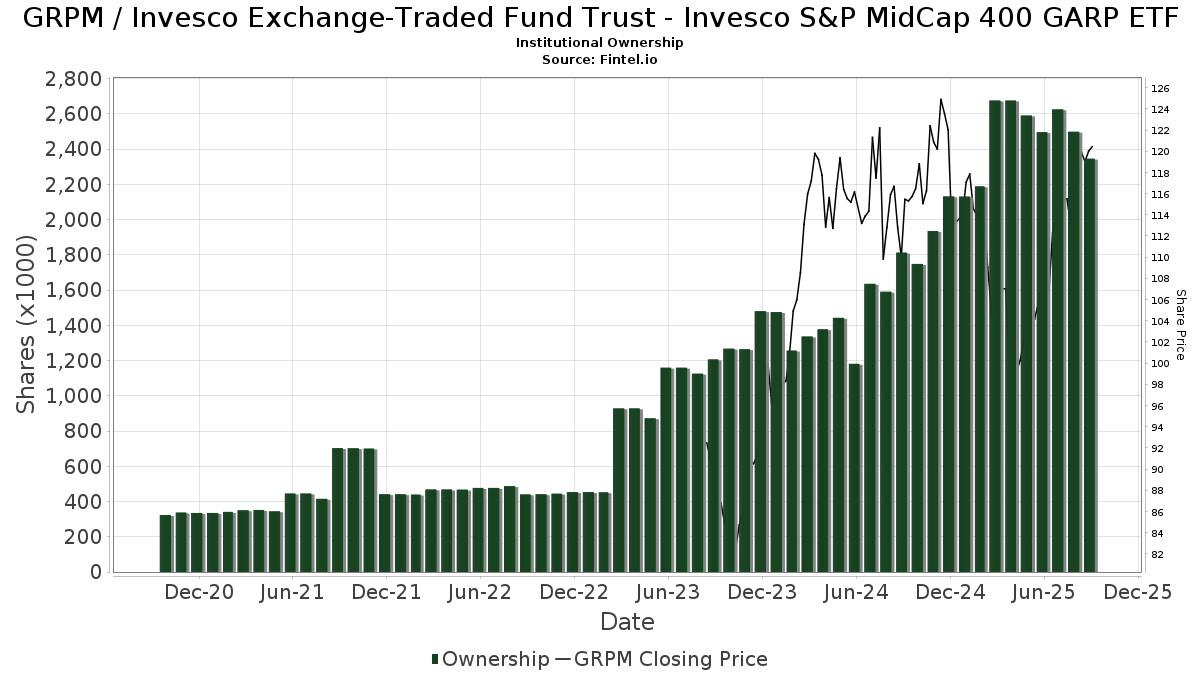
Invesco Exchange-Traded Fund Trust - Invesco S&P MidCap 400 GARP ETF (US:GRPM) memiliki 89 pemilik institusional dan pemegang saham yang telah mengajukan formulir 13D/G atau 13F kepada Komisi Bursa Efek (Securities Exchange Commission/SEC). Lembaga-lembaga ini memegang total 2,345,608 saham. Pemegang saham terbesar meliputi Morgan Stanley, LPL Financial LLC, Fortitude Financial, LLC, Northwestern Mutual Wealth Management Co, Bank Of America Corp /de/, Advisor Group Holdings, Inc., 626 Financial, LLC, Private Advisor Group, LLC, Jones Financial Companies Lllp, and WealthCare Investment Partners, LLC .
Struktur kepemilikan institusional Invesco Exchange-Traded Fund Trust - Invesco S&P MidCap 400 GARP ETF (ARCA:GRPM) menunjukkan posisi terkini di perusahaan oleh institusi dan dana, serta perubahan terbaru dalam ukuran posisi. Pemegang saham utama dapat mencakup investor individu, reksa dana, dana lindung nilai, atau institusi. Jadwal 13D menunjukkan bahwa investor memegang (atau pernah memegang) lebih dari 5% saham perusahaan dan bermaksud (atau pernah bermaksud) untuk secara aktif mengejar perubahan strategi bisnis. Jadwal 13G menunjukkan investasi pasif lebih dari 5%.
The share price as of September 5, 2025 is 120.75 / share. Previously, on September 6, 2024, the share price was 110.15 / share. This represents an increase of 9.62% over that period.
Skor Sentimen Dana
Skor Sentimen Dana (sebelumnya dikenal sebagai Skor Akumulasi Kepemilikan) menemukan saham-saham yang paling banyak dibeli oleh dana. Ini adalah hasil dari model kuantitatif multi-faktor yang canggih yang mengidentifikasi perusahaan dengan tingkat akumulasi institusional tertinggi. Model penilaian menggunakan kombinasi dari total peningkatan pemilik yang diungkapkan, perubahan dalam alokasi portofolio pada pemilik tersebut, dan metrik lainnya. Angka berkisar dari 0 hingga 100, dengan angka yang lebih tinggi menunjukkan tingkat akumulasi yang lebih tinggi dibandingkan dengan perusahaan sejenisnya, dan 50 adalah rata-ratanya.
Frekuensi Pembaruan: Setiap Hari
Lihat Ownership Explorer, yang menyediakan daftar perusahaan dengan peringkat tertinggi.
Rasio Put/Call Institusional
Selain melaporkan isu ekuitas dan utang standar, institusi dengan aset di bawah manajemen lebih dari 100 juta dolar AS juga harus mengungkapkan kepemilikan opsi put dan call mereka. Karena opsi put umumnya menunjukkan sentimen negatif, dan opsi call menunjukkan sentimen positif, kita dapat mengetahui sentimen institusional secara keseluruhan dengan memplot rasio put terhadap call. Grafik di sebelah kanan memplot rasio put/call historis untuk instrumen ini.
Menggunakan Rasio Put/Call sebagai indikator sentimen investor mengatasi salah satu kekurangan utama dari penggunaan total kepemilikan institusional, yaitu sejumlah besar aset yang dikelola diinvestasikan secara pasif untuk melacak indeks. Dana yang dikelola secara pasif biasanya tidak membeli opsi, sehingga indikator rasio put/call lebih akurat dalam melacak sentimen dana yang dikelola secara aktif.
Pengajuan 13F dan NPORT
Detail pada pengajuan 13F tersedia gratis. Detail pada pengajuan NP memerlukan keanggotaan premium. Baris berwarna hijau menunjukkan posisi baru. Baris berwarna merah menunjukkan posisi yang sudah ditutup. Klik tautan ini ikon untuk melihat riwayat transaksi selengkapnya.
Tingkatkan
untuk membuka data premium dan mengekspor ke Excel ![]() .
.
| Tanggal File | Sumber | Investor | Ketik | Presyo ng Avg (Silangan) |
Saham | Δ Saham (%) |
Dilaporkan Nilai ($1000) |
Nilai Δ (%) |
Alokasi Port (%) |
|
|---|---|---|---|---|---|---|---|---|---|---|
| 2025-07-21 | 13F | Seros Financial, LLC | 8,336 | 2.36 | 911 | 6.92 | ||||
| 2025-08-08 | 13F | Larson Financial Group LLC | 792 | 87 | ||||||
| 2025-08-14 | 13F | GWM Advisors LLC | 2,758 | 925.28 | 301 | 975.00 | ||||
| 2025-07-31 | 13F | Glass Jacobson Investment Advisors llc | 605 | -9.70 | 66 | -12.00 | ||||
| 2025-08-08 | 13F | Gts Securities Llc | 27,099 | 55.74 | 2,962 | 62.60 | ||||
| 2025-08-08 | 13F | Capital Investment Advisory Services, LLC | 325 | -52.76 | 36 | -51.39 | ||||
| 2025-08-13 | 13F | Crescent Grove Advisors, LLC | 2,300 | 0.00 | 251 | 4.58 | ||||
| 2025-08-04 | 13F | Spire Wealth Management | 0 | -100.00 | 0 | |||||
| 2025-06-30 | NP | Northern Lights Fund Trust - PFG Invesco(R) Thematic ESG Strategy Class R Shares | 26,272 | 5.48 | 2,634 | -7.35 | ||||
| 2025-04-22 | 13F | Crews Bank & Trust | 0 | -100.00 | 0 | |||||
| 2025-08-12 | 13F | PSI Advisors, LLC | 0 | -100.00 | 0 | |||||
| 2025-07-10 | 13F | Exchange Traded Concepts, Llc | 108 | 12 | ||||||
| 2025-08-11 | 13F | Private Advisor Group, LLC | 70,828 | 99.99 | 7,741 | 108.74 | ||||
| 2025-07-24 | 13F | IFP Advisors, Inc | 20 | -94.74 | 2 | -94.87 | ||||
| 2025-05-02 | 13F | Prevail Innovative Wealth Advisors, Llc | 0 | -100.00 | 0 | |||||
| 2025-08-15 | 13F | Kestra Advisory Services, LLC | 5,363 | 5.26 | 586 | 9.94 | ||||
| 2025-08-12 | 13F | LPL Financial LLC | 160,429 | -8.81 | 17,533 | -4.81 | ||||
| 2025-08-14 | 13F | Integrated Wealth Concepts LLC | 18,656 | 2,039 | ||||||
| 2025-08-14 | 13F | Goldman Sachs Group Inc | 28,643 | 80.11 | 3,130 | 87.99 | ||||
| 2025-08-14 | 13F | Wells Fargo & Company/mn | 337 | -18.60 | 37 | -16.28 | ||||
| 2025-08-14 | 13F | EP Wealth Advisors, Inc. | 1,835 | 201 | ||||||
| 2025-05-13 | 13F/A | Heck Capital Advisors, LLC | 0 | -100.00 | 0 | -100.00 | ||||
| 2025-08-14 | 13F | Modern Wealth Management, LLC | 31,864 | 18.88 | 3,482 | 24.09 | ||||
| 2025-08-04 | 13F | Quaker Wealth Management, LLC | 140 | 15 | ||||||
| 2025-08-14 | 13F | Royal Bank Of Canada | 11,268 | -70.10 | 1,231 | -68.80 | ||||
| 2025-08-19 | 13F | Cape Investment Advisory, Inc. | 66 | 7 | ||||||
| 2025-07-25 | 13F | Cwm, Llc | 107 | 0.00 | 0 | |||||
| 2025-05-09 | 13F | North Ridge Wealth Advisors, Inc. | 0 | -100.00 | 0 | |||||
| 2025-08-06 | 13F | Commonwealth Equity Services, Llc | 20,320 | 3.92 | 2 | 0.00 | ||||
| 2025-08-13 | 13F | Victory Financial Group, Llc | 0 | -100.00 | 0 | |||||
| 2025-08-14 | 13F | Mariner, LLC | 4,278 | -1.20 | 468 | 3.09 | ||||
| 2025-08-12 | 13F | Ameritas Investment Partners, Inc. | 46,861 | 11.00 | 5,121 | 15.86 | ||||
| 2025-04-21 | 13F | Compass Capital Corp /ma/ /adv | 0 | -100.00 | 0 | |||||
| 2025-08-13 | 13F | Stenger Family Office, LLC | 38,498 | 5,348 | ||||||
| 2025-08-04 | 13F | Creative Financial Designs Inc /adv | 3,254 | 23.35 | 356 | 28.62 | ||||
| 2025-07-09 | 13F | WealthCare Investment Partners, LLC | 56,551 | -0.16 | 6,403 | 18.27 | ||||
| 2025-08-14 | 13F | Jane Street Group, Llc | 3,822 | -15.48 | 418 | -11.84 | ||||
| 2025-07-22 | 13F | Merit Financial Group, LLC | 17,723 | -73.08 | 1,937 | -71.91 | ||||
| 2025-07-21 | 13F | Ameritas Advisory Services, LLC | 344 | 38 | ||||||
| 2025-08-14 | 13F | Bank Of America Corp /de/ | 122,739 | -27.80 | 13,414 | -24.63 | ||||
| 2025-07-08 | 13F | Davis Investment Partners, LLC | 14,825 | -0.84 | 1,642 | 13.02 | ||||
| 2025-07-10 | 13F | Redhawk Wealth Advisors, Inc. | 4,011 | -37.08 | 438 | -34.33 | ||||
| 2025-08-14 | 13F | Susquehanna International Group, Llp | 8,405 | 13.64 | 919 | 18.60 | ||||
| 2025-08-13 | 13F | Northwestern Mutual Wealth Management Co | 129,346 | -30.97 | 14,136 | -27.94 | ||||
| 2025-07-31 | 13F | Cambridge Investment Research Advisors, Inc. | 41,225 | 91.79 | 5 | 100.00 | ||||
| 2025-08-12 | 13F | Proequities, Inc. | 0 | 0 | ||||||
| 2025-08-06 | 13F | AE Wealth Management LLC | 186 | -65.30 | 20 | -64.29 | ||||
| 2025-04-23 | 13F | Embree Financial Group | 0 | -100.00 | 0 | |||||
| 2025-08-13 | 13F | Cerity Partners LLC | 29,029 | -2.41 | 3,173 | 1.86 | ||||
| 2025-08-13 | 13F | Balance Wealth, LLC | 0 | -100.00 | 0 | |||||
| 2025-05-08 | 13F | Endeavor Private Wealth, Inc. | 0 | -100.00 | 0 | |||||
| 2025-08-11 | 13F | Principal Securities, Inc. | 789 | 995.83 | 86 | 975.00 | ||||
| 2025-07-25 | 13F | Courage Miller Partners, LLC | 1,983 | 0.00 | 217 | 4.35 | ||||
| 2025-08-08 | 13F | Cetera Investment Advisers | 56,033 | -44.76 | 6,124 | -42.34 | ||||
| 2025-08-15 | 13F | Morgan Stanley | 430,893 | -23.70 | 47,092 | -20.35 | ||||
| 2025-07-15 | 13F | Main Street Group, LTD | 1,860 | 70.02 | 203 | 78.07 | ||||
| 2025-09-04 | 13F/A | Advisor Group Holdings, Inc. | 112,369 | 76.79 | 12,294 | 84.76 | ||||
| 2025-08-08 | 13F | Creative Planning | 53,754 | -11.67 | 5,875 | -7.80 | ||||
| 2025-04-22 | 13F | Nilsine Partners, LLC | 0 | -100.00 | 0 | |||||
| 2025-08-05 | 13F | Bank Of Montreal /can/ | 3,729 | 0.49 | 408 | 4.90 | ||||
| 2025-08-01 | 13F | Envestnet Asset Management Inc | 31,081 | 0.28 | 3,397 | 4.65 | ||||
| 2025-08-04 | 13F | Integrity Alliance, Llc. | 0 | -100.00 | 0 | |||||
| 2025-08-14 | 13F | Fmr Llc | 469 | -36.62 | 51 | -33.77 | ||||
| 2025-08-14 | 13F | Raymond James Financial Inc | 39,050 | -4.76 | 4,268 | -0.58 | ||||
| 2025-08-05 | 13F | Arrowroot Family Office, LLC | 9,720 | -6.51 | 1,062 | -9.39 | ||||
| 2025-08-05 | 13F | Sigma Planning Corp | 19,252 | -3.62 | 2,104 | 0.62 | ||||
| 2025-07-29 | 13F | Private Trust Co Na | 150 | 16 | ||||||
| 2025-08-04 | 13F | Quaker Wealth Management, LLC | Put | 0 | -100.00 | 0 | -100.00 | |||
| 2025-08-07 | 13F | BOK Financial Private Wealth, Inc. | 146 | 0.00 | 16 | 0.00 | ||||
| 2025-08-04 | 13F/A | 626 Financial, LLC | 98,918 | -4.00 | 10,811 | 0.20 | ||||
| 2025-07-17 | 13F | Wagner Wealth Management, Llc | 0 | -100.00 | 0 | |||||
| 2025-08-07 | 13F | PFG Advisors | 4,686 | 3.38 | 512 | 8.02 | ||||
| 2025-08-15 | 13F | Asset Allocation Strategies LLC | 11,783 | 1,288 | ||||||
| 2025-07-24 | 13F | Us Bancorp \de\ | 749 | 0.00 | 82 | 3.85 | ||||
| 2025-07-24 | 13F | Tandem Capital Management Corp /adv | 4,755 | -1.76 | 520 | 2.57 | ||||
| 2025-04-28 | 13F | Financial Advocates Investment Management | 0 | -100.00 | 0 | |||||
| 2025-05-06 | 13F | SYM FINANCIAL Corp | 0 | -100.00 | 0 | |||||
| 2025-06-11 | 13F | Fortitude Financial, LLC | 143,018 | 825.14 | 14,974 | 759.04 | ||||
| 2025-08-12 | 13F | Cornerstone Wealth Management, LLC | 7,448 | -9.50 | 814 | -5.46 | ||||
| 2025-08-14 | 13F | UBS Group AG | 37,040 | 8.99 | 4,048 | 13.77 | ||||
| 2025-07-31 | 13F | Oppenheimer & Co Inc | 8,428 | 0.00 | 921 | 4.42 | ||||
| 2025-07-25 | 13F | Concurrent Investment Advisors, LLC | 16,622 | 1.32 | 1,817 | 5.77 | ||||
| 2025-07-28 | 13F | Sagespring Wealth Partners, Llc | 15,365 | 139.52 | 1,679 | 150.22 | ||||
| 2025-08-13 | 13F | Jones Financial Companies Lllp | 65,982 | 3.40 | 7,200 | 7.93 | ||||
| 2025-04-11 | 13F | Harbor Group, Inc. | 0 | -100.00 | 0 | |||||
| 2025-08-12 | 13F | Steward Partners Investment Advisory, Llc | 1,473 | 161 | ||||||
| 2025-08-06 | 13F | North Capital, Inc. | 24 | 0.00 | 3 | 0.00 | ||||
| 2025-08-08 | 13F | Avantax Advisory Services, Inc. | 11,171 | -1.00 | 1,221 | 3.30 | ||||
| 2025-08-04 | 13F | Bay Colony Advisory Group, Inc d/b/a Bay Colony Advisors | 2,646 | -11.80 | 289 | -7.67 | ||||
| 2025-08-26 | 13F/A | Thrivent Financial For Lutherans | 0 | -100.00 | 0 | |||||
| 2025-08-14 | 13F | Two Sigma Securities, Llc | 2,120 | -28.16 | 232 | -25.00 | ||||
| 2025-08-14 | 13F | Stifel Financial Corp | 38,898 | -51.61 | 4,255 | -49.48 | ||||
| 2025-07-28 | 13F | Axxcess Wealth Management, Llc | 7,475 | -6.76 | 817 | -2.74 | ||||
| 2025-08-14 | 13F | Citadel Advisors Llc | 13,436 | 47.42 | 1,468 | 53.88 | ||||
| 2025-05-05 | 13F | Mainstay Capital Management Llc /adv | 0 | -100.00 | 0 | |||||
| 2025-07-29 | 13F | Signature Estate & Investment Advisors Llc | 2,493 | -2.43 | 272 | 1.87 | ||||
| 2025-08-07 | 13F | Kestra Private Wealth Services, Llc | 47,392 | 5.24 | 5,179 | 9.86 | ||||
| 2025-08-12 | 13F | Gladstone Institutional Advisory LLC | 2,445 | 0.00 | 267 | 4.71 | ||||
| 2025-07-28 | 13F | Harbour Investments, Inc. | 143 | -83.04 | 16 | -82.95 | ||||
| 2025-08-13 | 13F | Flow Traders U.s. Llc | 5,832 | 155.68 | 1 | |||||
| 2025-07-24 | 13F | Capital Advisors, Ltd. LLC | 2,186 | 0.23 | 0 | |||||
| 2025-08-14 | 13F | Ameriprise Financial Inc | 31,442 | -3.10 | 3,436 | 0.61 | ||||
| 2025-05-12 | 13F | Townsquare Capital Llc | 0 | -100.00 | 0 | |||||
| 2025-08-08 | 13F | Thoroughbred Financial Services, Llc | 27,841 | -33.40 | 3 | -25.00 | ||||
| 2025-08-08 | 13F | Foundations Investment Advisors, LLC | 0 | -100.00 | 0 | |||||
| 2025-08-12 | 13F | Global Retirement Partners, LLC | 900 | 51.01 | 98 | 46.27 | ||||
| 2025-08-14 | 13F | Mml Investors Services, Llc | 5,367 | 21.48 | 1 | |||||
| 2025-07-17 | 13F | Janney Montgomery Scott LLC | 2,255 | 0.40 | 0 | |||||
| 2025-08-05 | 13F | Key FInancial Inc | 73 | 0.00 | 8 | 0.00 | ||||
| 2025-07-18 | 13F | Truist Financial Corp | 16,649 | -7.12 | 1,736 | -9.21 | ||||
| 2025-07-11 | 13F | International Private Wealth Advisors LLC | 4,560 | -1.81 | 498 | 2.47 | ||||
| 2025-08-13 | 13F | Lido Advisors, LLC | 3,147 | 0.00 | 344 | 4.26 | ||||
| 2025-05-12 | 13F | Independent Advisor Alliance | 0 | -100.00 | 0 | |||||
| 2025-08-14 | 13F | Marshall Investment Management, Llc | 0 | -100.00 | 0 | |||||
| 2025-04-22 | 13F | Manning & Napier Advisors Llc | 0 | -100.00 | 0 |