Mga Batayang Estadistika
| Pemilik Institusional | 292 total, 292 long only, 0 short only, 0 long/short - change of -0.68% MRQ |
| Alokasi Portofolio Rata-rata | 0.7178 % - change of 8.23% MRQ |
| Saham Institusional (Jangka Panjang) | 93,711,875 (ex 13D/G) - change of -3.53MM shares -3.63% MRQ |
| Nilai Institusional (Jangka Panjang) | $ 3,418,131 USD ($1000) |
Kepemilikan Institusional dan Pemegang Saham
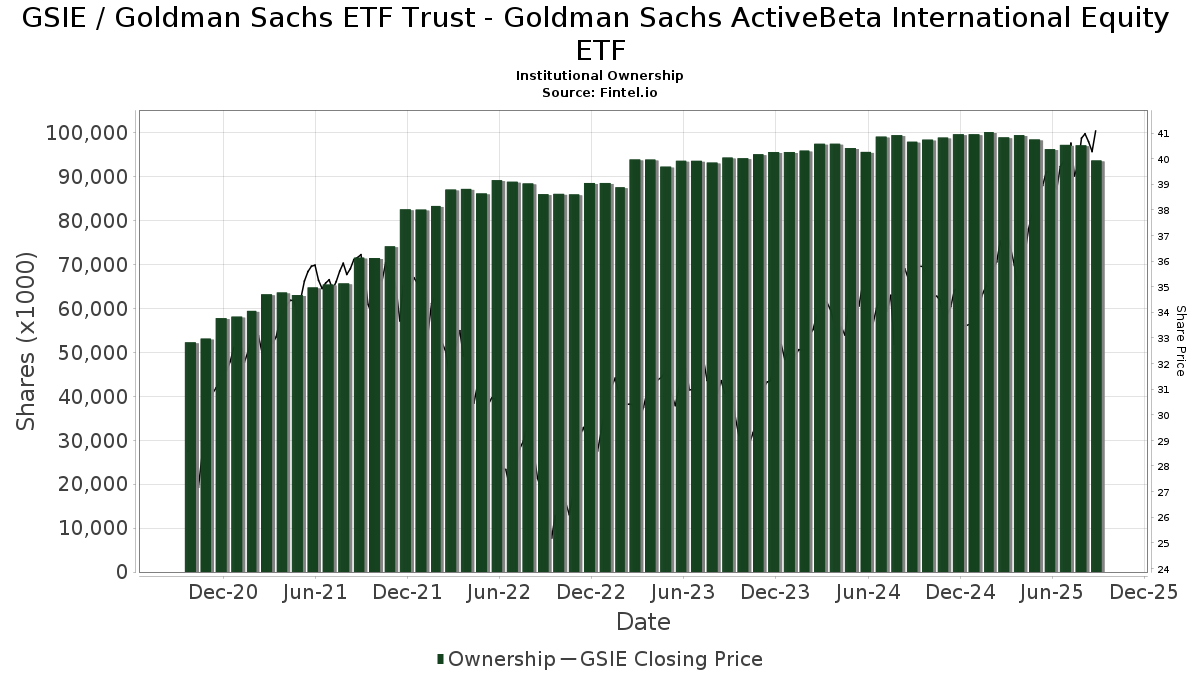
Goldman Sachs ETF Trust - Goldman Sachs ActiveBeta International Equity ETF (US:GSIE) memiliki 292 pemilik institusional dan pemegang saham yang telah mengajukan formulir 13D/G atau 13F kepada Komisi Bursa Efek (Securities Exchange Commission/SEC). Lembaga-lembaga ini memegang total 93,711,875 saham. Pemegang saham terbesar meliputi Wells Fargo & Company/mn, LPL Financial LLC, Bank Of America Corp /de/, SigFig Wealth Management, LLC, Morgan Stanley, Envestnet Asset Management Inc, Betterment LLC, HB Wealth Management, LLC, Goldman Sachs Group Inc, and Commonwealth Equity Services, Llc .
Struktur kepemilikan institusional Goldman Sachs ETF Trust - Goldman Sachs ActiveBeta International Equity ETF (ARCA:GSIE) menunjukkan posisi terkini di perusahaan oleh institusi dan dana, serta perubahan terbaru dalam ukuran posisi. Pemegang saham utama dapat mencakup investor individu, reksa dana, dana lindung nilai, atau institusi. Jadwal 13D menunjukkan bahwa investor memegang (atau pernah memegang) lebih dari 5% saham perusahaan dan bermaksud (atau pernah bermaksud) untuk secara aktif mengejar perubahan strategi bisnis. Jadwal 13G menunjukkan investasi pasif lebih dari 5%.
The share price as of September 5, 2025 is 40.78 / share. Previously, on September 9, 2024, the share price was 35.08 / share. This represents an increase of 16.25% over that period.
Skor Sentimen Dana
Skor Sentimen Dana (sebelumnya dikenal sebagai Skor Akumulasi Kepemilikan) menemukan saham-saham yang paling banyak dibeli oleh dana. Ini adalah hasil dari model kuantitatif multi-faktor yang canggih yang mengidentifikasi perusahaan dengan tingkat akumulasi institusional tertinggi. Model penilaian menggunakan kombinasi dari total peningkatan pemilik yang diungkapkan, perubahan dalam alokasi portofolio pada pemilik tersebut, dan metrik lainnya. Angka berkisar dari 0 hingga 100, dengan angka yang lebih tinggi menunjukkan tingkat akumulasi yang lebih tinggi dibandingkan dengan perusahaan sejenisnya, dan 50 adalah rata-ratanya.
Frekuensi Pembaruan: Setiap Hari
Lihat Ownership Explorer, yang menyediakan daftar perusahaan dengan peringkat tertinggi.
Rasio Put/Call Institusional
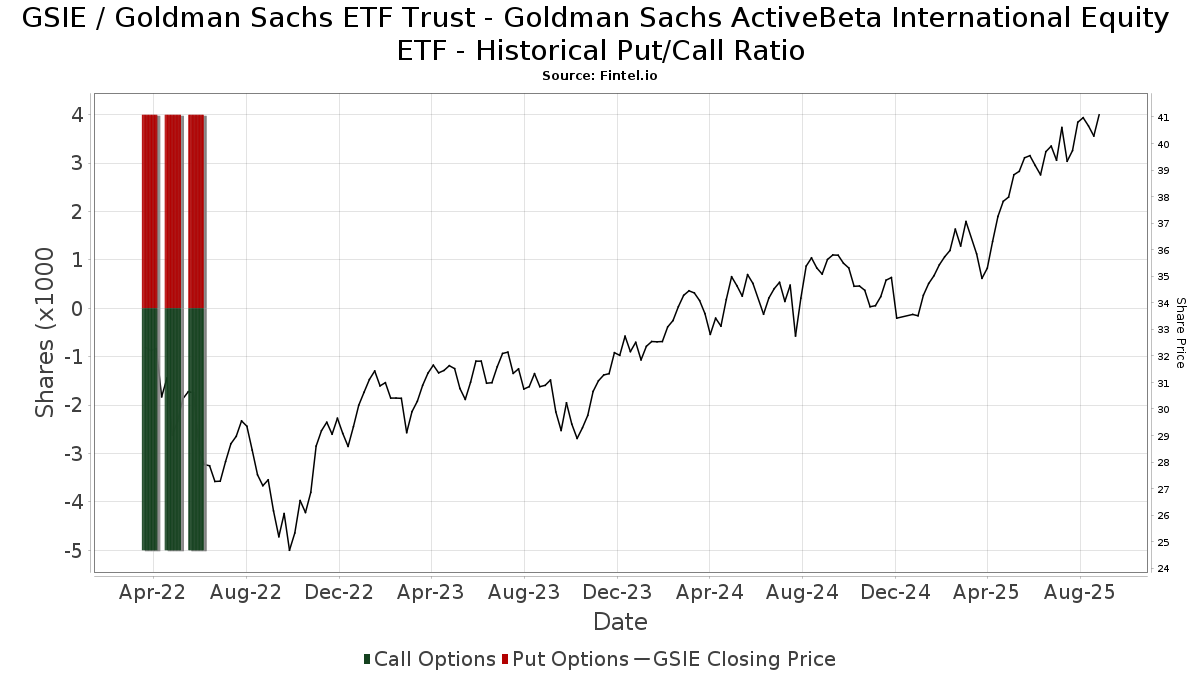
Selain melaporkan isu ekuitas dan utang standar, institusi dengan aset di bawah manajemen lebih dari 100 juta dolar AS juga harus mengungkapkan kepemilikan opsi put dan call mereka. Karena opsi put umumnya menunjukkan sentimen negatif, dan opsi call menunjukkan sentimen positif, kita dapat mengetahui sentimen institusional secara keseluruhan dengan memplot rasio put terhadap call. Grafik di sebelah kanan memplot rasio put/call historis untuk instrumen ini.
Menggunakan Rasio Put/Call sebagai indikator sentimen investor mengatasi salah satu kekurangan utama dari penggunaan total kepemilikan institusional, yaitu sejumlah besar aset yang dikelola diinvestasikan secara pasif untuk melacak indeks. Dana yang dikelola secara pasif biasanya tidak membeli opsi, sehingga indikator rasio put/call lebih akurat dalam melacak sentimen dana yang dikelola secara aktif.
Pengajuan 13F dan NPORT
Detail pada pengajuan 13F tersedia gratis. Detail pada pengajuan NP memerlukan keanggotaan premium. Baris berwarna hijau menunjukkan posisi baru. Baris berwarna merah menunjukkan posisi yang sudah ditutup. Klik tautan ini ikon untuk melihat riwayat transaksi selengkapnya.
Tingkatkan
untuk membuka data premium dan mengekspor ke Excel ![]() .
.
| Tanggal File | Sumber | Investor | Ketik | Presyo ng Avg (Silangan) |
Saham | Δ Saham (%) |
Dilaporkan Nilai ($1000) |
Nilai Δ (%) |
Alokasi Port (%) |
|
|---|---|---|---|---|---|---|---|---|---|---|
| 2025-07-08 | 13F | Richard P Slaughter Associates Inc | 30,347 | -24.54 | 1,204 | -16.05 | ||||
| 2025-07-25 | 13F | Hemington Wealth Management | 381 | 0.00 | 0 | |||||
| 2025-08-13 | 13F | Baird Financial Group, Inc. | 167,146 | -1.10 | 6,629 | 10.02 | ||||
| 2025-04-01 | 13F | Modus Advisors, LLC | 0 | -100.00 | 0 | |||||
| 2025-07-22 | 13F | HFM Investment Advisors, LLC | 347 | 2.66 | 14 | 8.33 | ||||
| 2025-08-12 | 13F | Park Square Financial Group, LLC | 74 | 0.00 | 3 | 0.00 | ||||
| 2025-08-19 | 13F | Anchor Investment Management, LLC | 109,036 | 0.04 | 4,324 | 11.30 | ||||
| 2025-08-13 | 13F | Lido Advisors, LLC | 9,233 | 0.77 | 366 | 12.27 | ||||
| 2025-07-11 | 13F | SILVER OAK SECURITIES, Inc | 26,083 | 0.00 | 1,034 | 10.23 | ||||
| 2025-08-06 | 13F | Atlantic Union Bankshares Corp | 226 | 9 | ||||||
| 2025-08-15 | 13F | First Heartland Consultants, Inc. | 5,812 | -6.21 | 231 | 4.55 | ||||
| 2025-05-07 | 13F | WMS Partners, LLC | 0 | -100.00 | 0 | |||||
| 2025-07-17 | 13F | Dopkins Wealth Management, Llc | 23,386 | -3.44 | 927 | 7.42 | ||||
| 2025-07-29 | 13F | Empirical Asset Management, LLC | 6,094 | -0.62 | 242 | 10.55 | ||||
| 2025-08-05 | 13F | Bank of New York Mellon Corp | 736,998 | -9.12 | 29,229 | 1.11 | ||||
| 2025-07-09 | 13F | Reyes Financial Architecture, Inc. | 123 | 0.00 | 5 | 0.00 | ||||
| 2025-07-17 | 13F | LexAurum Advisors, LLC | 489,704 | 25.23 | 19,422 | 39.31 | ||||
| 2025-08-12 | 13F | Inscription Capital, LLC | 33,889 | -9.40 | 1,344 | 4.84 | ||||
| 2025-07-31 | 13F | Wealthfront Advisers Llc | 10,941 | 25.90 | 434 | 40.13 | ||||
| 2025-08-12 | 13F | Waterloo Capital, L.P. | 12,954 | 2.42 | 514 | 14.00 | ||||
| 2025-07-09 | 13F | Dynamic Advisor Solutions LLC | 66,278 | -25.46 | 2,629 | -17.07 | ||||
| 2025-07-25 | 13F | Cwm, Llc | 310,876 | -2.56 | 12 | 9.09 | ||||
| 2025-07-17 | 13F | HB Wealth Management, LLC | 2,774,891 | -11.17 | 110,052 | -1.18 | ||||
| 2025-07-24 | 13F | Endeavor Private Wealth, Inc. | 13,706 | -14.14 | 544 | -4.57 | ||||
| 2025-08-14 | 13F | Aqr Capital Management Llc | 516,626 | 1.03 | 20,489 | 12.39 | ||||
| 2025-07-09 | 13F | Pallas Capital Advisors LLC | 23,743 | -95.51 | 942 | -95.00 | ||||
| 2025-07-31 | 13F | Cambridge Investment Research Advisors, Inc. | 136,263 | 16.68 | 5 | 25.00 | ||||
| 2025-07-25 | 13F | Concurrent Investment Advisors, LLC | 22,623 | 45.12 | 897 | 61.62 | ||||
| 2025-07-28 | 13F | Lunt Capital Management, Inc. | 25,198 | 0.00 | 999 | 11.25 | ||||
| 2025-07-01 | 13F | Stonehearth Capital Management, LLC | 83,734 | -4.33 | 3,321 | 6.41 | ||||
| 2025-07-14 | 13F | Lee-Kelleher Wealth Management | 30,567 | -1.68 | 1,212 | 9.39 | ||||
| 2025-07-21 | 13F | Ameriflex Group, Inc. | 56 | 0.00 | 2 | 100.00 | ||||
| 2025-08-14 | 13F | First Foundation Advisors | 1,036,921 | 5.89 | 41,124 | 17.80 | ||||
| 2025-07-08 | 13F | Baker Ellis Asset Management LLC | 377,804 | 5.57 | 14,984 | 17.44 | ||||
| 2025-07-30 | 13F | Cullen/frost Bankers, Inc. | 983 | 0.00 | 39 | 8.57 | ||||
| 2025-08-14 | 13F | Integrated Wealth Concepts LLC | 187,378 | 19.50 | 7,431 | 32.93 | ||||
| 2025-08-14 | 13F | Betterment LLC | 3,191,444 | -33.26 | 127 | -25.88 | ||||
| 2025-08-14 | 13F | Glenview Trust Co | 32,862 | 5.68 | 1,303 | 17.60 | ||||
| 2025-08-19 | NP | GAPIX - Goldman Sachs Dynamic Global Equity Fund Institutional | 202,666 | 13.89 | 8,038 | 26.69 | ||||
| 2025-08-14 | 13F | Royal Bank Of Canada | 962,651 | -3.43 | 38,179 | 7.44 | ||||
| 2025-08-14 | 13F | Qube Research & Technologies Ltd | 3,036 | -60.38 | 120 | -56.04 | ||||
| 2025-08-13 | 13F | Cheviot Value Management, LLC | 69 | 0.00 | 3 | 0.00 | ||||
| 2025-07-31 | 13F | CNB Bank | 1,623 | 0.00 | 64 | 12.28 | ||||
| 2025-07-07 | 13F | Thurston, Springer, Miller, Herd & Titak, Inc. | 179 | 231.48 | 7 | 600.00 | ||||
| 2025-07-25 | 13F | Prostatis Group LLC | 46,067 | 101.77 | 1,827 | 124.72 | ||||
| 2025-08-12 | 13F | Fca Corp /tx | 236,669 | 2.34 | 9,386 | 13.85 | ||||
| 2025-07-18 | 13F | Truist Financial Corp | 20,538 | -2.82 | 815 | 8.10 | ||||
| 2025-08-07 | 13F | Brio Consultants, LLC | 959,806 | 3.33 | 38,066 | 14.95 | ||||
| 2025-07-29 | 13F | Stephens Inc /ar/ | 64,908 | -0.13 | 2,574 | 11.14 | ||||
| 2025-08-14 | 13F | Stonehaven Wealth & Tax Solutions, Llc | 10,083 | -19.48 | 400 | -10.54 | ||||
| 2025-08-12 | 13F | Vawter Financial, Ltd. | 6,450 | -95.31 | 256 | -94.80 | ||||
| 2025-07-09 | 13F | Goelzer Investment Management, Inc. | 8,953 | 0.00 | 355 | 11.29 | ||||
| 2025-07-15 | 13F | Financial Management Professionals, Inc. | 1,288,458 | 0.35 | 51,100 | 11.63 | ||||
| 2025-08-07 | 13F | Verus Capital Partners, Llc | 9,418 | 4.33 | 374 | 16.20 | ||||
| 2025-07-18 | 13F | PFG Investments, LLC | 20,276 | 1.36 | 804 | 12.76 | ||||
| 2025-08-19 | NP | GOIIX - Goldman Sachs Growth and Income Strategy Portfolio Institutional | 395,959 | 0.00 | 15,704 | 11.25 | ||||
| 2025-08-14 | 13F | LaSalle St. Investment Advisors, LLC | 5,658 | -9.23 | 0 | |||||
| 2025-08-14 | 13F | Susquehanna International Group, Llp | 14,039 | -96.47 | 557 | -96.08 | ||||
| 2025-08-14 | 13F | Two Sigma Securities, Llc | 0 | -100.00 | 0 | |||||
| 2025-08-13 | 13F | Manning & Napier Advisors Llc | 232,107 | -10.72 | 9,205 | -0.68 | ||||
| 2025-07-01 | 13F | Kera Capital Partners, Inc. | 377,170 | 3.47 | 14,959 | 15.11 | ||||
| 2025-08-14 | 13F | LifePlan Investment Advisors, Inc. | 71,126 | 36.30 | 2,821 | 51.61 | ||||
| 2025-07-23 | 13F | West Paces Advisors Inc. | 0 | -100.00 | 0 | |||||
| 2025-08-01 | 13F | Bank of Jackson Hole Trust | 0 | -100.00 | 0 | |||||
| 2025-07-10 | 13F | Tompkins Financial Corp | 2,157 | -10.05 | 86 | 0.00 | ||||
| 2025-08-11 | 13F | Vanguard Group Inc | 5,699 | 1.24 | 226 | 13.00 | ||||
| 2025-04-29 | 13F | Callan Capital, LLC | 700,347 | -3.42 | 24,967 | 3.27 | ||||
| 2025-08-01 | 13F | Strategic Financial Services, Inc, | 949,667 | 7.67 | 37,664 | 19.78 | ||||
| 2025-08-14 | 13F | Ausdal Financial Partners, Inc. | 9,365 | 0.17 | 371 | 11.41 | ||||
| 2025-07-24 | 13F | Mengis Capital Management, Inc. | 289,330 | 1.14 | 11,475 | 12.51 | ||||
| 2025-05-06 | 13F | Proficio Capital Partners LLC | 0 | -100.00 | 0 | -100.00 | ||||
| 2025-07-17 | 13F | Beacon Capital Management, LLC | 269 | 1.13 | 11 | 11.11 | ||||
| 2025-05-15 | 13F | Hrt Financial Lp | 0 | -100.00 | 0 | |||||
| 2025-07-16 | 13F | Perigon Wealth Management, LLC | 18,354 | 29.40 | 728 | 43.96 | ||||
| 2025-08-14 | 13F | Fmr Llc | 38,156 | -0.01 | 1,513 | 11.25 | ||||
| 2025-04-28 | 13F | Great Point Wealth Advisors, LLC | 317,535 | -1.33 | 11,320 | 5.51 | ||||
| 2025-08-19 | 13F | Asset Dedication, LLC | 71 | 3 | ||||||
| 2025-04-15 | 13F | Accurate Wealth Management, LLC | 0 | -100.00 | 0 | -100.00 | ||||
| 2025-08-06 | 13F | Legacy Bridge, LLC | 883 | 0.00 | 35 | 12.90 | ||||
| 2025-08-11 | 13F | Perennial Investment Advisors, LLC | 29,566 | 1.00 | 1,173 | 12.37 | ||||
| 2025-07-08 | 13F | Parallel Advisors, LLC | 608 | -83.75 | 24 | -81.95 | ||||
| 2025-08-04 | 13F | Assetmark, Inc | 7,513 | 79.91 | 298 | 100.68 | ||||
| 2025-04-10 | 13F | Sugar Maple Asset Management, LLC | 0 | -100.00 | 0 | |||||
| 2025-07-17 | 13F | Patton Albertson Miller Group, Llc | 15,299 | 38.40 | 607 | 53.81 | ||||
| 2025-08-12 | 13F | Jpmorgan Chase & Co | 108,298 | 65.87 | 4,295 | 84.57 | ||||
| 2025-09-04 | 13F/A | Advisor Group Holdings, Inc. | 223,161 | -9.40 | 8,855 | 0.82 | ||||
| 2025-08-27 | 13F/A | Brinker Capital Investments, LLC | 108,109 | 5.66 | 4,288 | 17.55 | ||||
| 2025-08-11 | 13F | Private Advisor Group, LLC | 74,884 | -4.20 | 2,970 | 6.57 | ||||
| 2025-08-15 | 13F | Equitable Holdings, Inc. | 107,802 | -45.02 | 4,275 | -38.83 | ||||
| 2025-08-12 | 13F | Global Retirement Partners, LLC | 24,164 | -14.55 | 958 | 1.70 | ||||
| 2025-07-16 | 13F | ORG Partners LLC | 245 | 10 | ||||||
| 2025-08-04 | 13F | Creative Financial Designs Inc /adv | 436 | -39.70 | 17 | -32.00 | ||||
| 2025-07-17 | 13F | White Pine Investment CO | 375,538 | -1.96 | 15 | 7.69 | ||||
| 2025-07-16 | 13F | Cambridge Advisors Inc. | 7,600 | 0.00 | 301 | 11.48 | ||||
| 2025-08-13 | 13F | Maia Wealth LLC | 46,419 | -10.48 | 1,841 | 1.21 | ||||
| 2025-07-07 | 13F | Roxbury Financial LLC | 63 | 1.61 | 2 | 0.00 | ||||
| 2025-07-21 | 13F | Monticello Wealth Management, Llc | 280,672 | -1.85 | 11,131 | 9.19 | ||||
| 2025-08-11 | 13F | Regal Investment Advisors LLC | 101,147 | -2.57 | 4,011 | 8.38 | ||||
| 2025-07-29 | 13F | Signature Estate & Investment Advisors Llc | 28,278 | -77.57 | 1,122 | -75.06 | ||||
| 2025-07-14 | 13F | UMA Financial Services, Inc. | 902 | 0.00 | 36 | 9.38 | ||||
| 2025-07-24 | 13F | IFP Advisors, Inc | 119,325 | 6.08 | 4,732 | 18.00 | ||||
| 2025-07-10 | 13F | Community Trust & Investment Co | 62,327 | 0.00 | 2,472 | 11.26 | ||||
| 2025-08-12 | 13F/A | Cozad Asset Management Inc | 85,235 | 8.34 | 3,380 | 20.54 | ||||
| 2025-07-16 | 13F | Signaturefd, Llc | 44 | 2 | ||||||
| 2025-07-31 | 13F | Brighton Jones Llc | 6,081 | 5.77 | 241 | 18.14 | ||||
| 2025-07-30 | 13F | Syntegra Private Wealth Group, LLC | 49,861 | 43.51 | 1,977 | 59.69 | ||||
| 2025-08-06 | 13F | Stokes Family Office, LLC | 20,038 | -0.15 | 795 | 11.05 | ||||
| 2025-07-24 | 13F | Us Bancorp \de\ | 6,702 | 10.10 | 266 | 22.12 | ||||
| 2025-04-29 | 13F | Hm Payson & Co | 2,143 | 0.00 | 76 | 7.04 | ||||
| 2025-08-13 | 13F | Continuum Advisory, LLC | 0 | -100.00 | 0 | |||||
| 2025-08-06 | 13F | AE Wealth Management LLC | 922 | -18.84 | 37 | -10.00 | ||||
| 2025-08-12 | 13F | MAI Capital Management | 2,200 | -0.72 | 87 | 10.13 | ||||
| 2025-07-07 | 13F | Investors Research Corp | 0 | -100.00 | 0 | |||||
| 2025-08-14 | 13F | Wells Fargo & Company/mn | 21,122,125 | 2.41 | 837,703 | 13.93 | ||||
| 2025-08-11 | 13F | HighTower Advisors, LLC | 330,385 | 46.44 | 13,103 | 62.93 | ||||
| 2025-08-13 | 13F | Northwestern Mutual Wealth Management Co | 713,074 | -1.71 | 28,281 | 9.35 | ||||
| 2025-07-16 | 13F | RWM Asset Management, LLC | 16,130 | 0.00 | 640 | 11.13 | ||||
| 2025-08-05 | 13F | Bank Of Montreal /can/ | 4,975 | 14.34 | 197 | 27.10 | ||||
| 2025-07-16 | 13F | Kathmere Capital Management, LLC | 54,336 | -4.78 | 2,155 | 5.90 | ||||
| 2025-04-10 | 13F | Lmcg Investments, Llc | 0 | -100.00 | 0 | |||||
| 2025-07-30 | 13F | IMG Wealth Management, Inc. | 0 | -100.00 | 0 | |||||
| 2025-07-28 | 13F | IFC Advisors LLC | 134,265 | 0.00 | 5,325 | 11.24 | ||||
| 2025-08-13 | 13F | Renaissance Technologies Llc | 0 | -100.00 | 0 | |||||
| 2025-08-14 | 13F | CoreCap Advisors, LLC | 474,174 | -2.89 | 18,806 | 8.03 | ||||
| 2025-07-22 | 13F | Mascoma Wealth Management LLC | 1,034 | -55.66 | 41 | -50.60 | ||||
| 2025-08-07 | 13F | Resources Investment Advisors, LLC. | 1,010,547 | 6.76 | 40,078 | 18.77 | ||||
| 2025-07-07 | 13F | Kings Path Partners LLC | 234,753 | -8.93 | 9,310 | 1.32 | ||||
| 2025-07-08 | 13F | Atwood & Palmer Inc | 273,743 | -1.93 | 10,857 | 9.09 | ||||
| 2025-07-14 | 13F | Sowell Financial Services LLC | 16,292 | 109.11 | 646 | 133.21 | ||||
| 2025-08-13 | 13F | IAG Wealth Partners, LLC | 627,069 | 8.14 | 24,870 | 20.31 | ||||
| 2025-08-12 | 13F | Insigneo Advisory Services, Llc | 7,956 | 23.35 | 316 | 37.55 | ||||
| 2025-07-28 | 13F | Harbour Investments, Inc. | 5,284 | -11.76 | 210 | -1.88 | ||||
| 2025-08-07 | 13F | Evoke Wealth, Llc | 16,138 | 640 | ||||||
| 2025-08-07 | 13F | Vise Technologies, Inc. | 0 | -100.00 | 0 | |||||
| 2025-08-08 | 13F | Cetera Investment Advisers | 666,978 | -42.79 | 26,452 | -36.36 | ||||
| 2025-08-14 | 13F | Mariner, LLC | 55,319 | -3.38 | 2,194 | 7.45 | ||||
| 2025-07-18 | 13F | Bartlett & Co. Wealth Management Llc | 28 | 0.00 | 1 | |||||
| 2025-08-13 | 13F | Brown Advisory Inc | 6,355 | -50.93 | 252 | -45.34 | ||||
| 2025-07-25 | 13F | Allspring Global Investments Holdings, LLC | 4 | 0.00 | 0 | |||||
| 2025-08-04 | 13F | Spire Wealth Management | 0 | -100.00 | 0 | |||||
| 2025-07-24 | 13F | JNBA Financial Advisors | 509 | 20 | ||||||
| 2025-08-14 | 13F | Ameriprise Financial Inc | 10,705 | -73.91 | 425 | -71.00 | ||||
| 2025-08-14 | 13F | Mml Investors Services, Llc | 19,158 | 20.16 | 1 | |||||
| 2025-07-15 | 13F | Optima Capital Llc | 5,826 | 0.00 | 231 | 11.59 | ||||
| 2025-07-11 | 13F | Farther Finance Advisors, LLC | 7,896 | -47.20 | 313 | -41.39 | ||||
| 2025-07-30 | 13F | Retirement Planning Group | 87,096 | -1.60 | 3,454 | 9.48 | ||||
| 2025-08-14 | 13F | Straightline Group Llc | 662,654 | -0.20 | 26,301 | 11.14 | ||||
| 2025-04-21 | 13F | Nelson, Van Denburg & Campbell Wealth Management Group, LLC | 0 | -100.00 | 0 | |||||
| 2025-08-13 | 13F | SageView Advisory Group, LLC | 92,462 | 0.24 | 3,671 | 11.62 | ||||
| 2025-08-13 | 13F | Russell Investments Group, Ltd. | 1,409 | 0.00 | 56 | 10.00 | ||||
| 2025-07-17 | 13F | Independence Bank of Kentucky | 1,000 | 40 | ||||||
| 2025-08-13 | 13F | M Holdings Securities, Inc. | 0 | -100.00 | 0 | |||||
| 2025-07-09 | 13F | Channel Wealth Llc | 175,205 | 24.86 | 6,949 | 38.90 | ||||
| 2025-07-14 | 13F | Gries Financial Llc | 7,782 | 309 | ||||||
| 2025-08-08 | 13F | Crossmark Global Holdings, Inc. | 30,171 | -1.43 | 1,197 | 9.62 | ||||
| 2025-08-14 | 13F | Palo Alto Wealth Advisors, Llc | 207,879 | 6.34 | 8,244 | 10.69 | ||||
| 2025-08-19 | NP | GGSIX - Goldman Sachs Growth Strategy Portfolio Institutional | 557,846 | 0.00 | 22,124 | 11.25 | ||||
| 2025-07-16 | 13F | John W. Brooker & Co., CPAs | 33,905 | -59.91 | 1,353 | -55.11 | ||||
| 2025-08-14 | 13F | Colony Group, LLC | 6,872 | -0.41 | 273 | 11.02 | ||||
| 2025-07-30 | 13F | Gables Capital Management Inc. | 29 | 0.00 | 1 | 0.00 | ||||
| 2025-07-09 | 13F | High Probability Advisors, LLC | 927,984 | -7.22 | 36,804 | 3.22 | ||||
| 2025-07-25 | 13F | PrairieView Partners, LLC | 306 | 0.00 | 0 | |||||
| 2025-08-12 | 13F | NWF Advisory Services Inc. | 32,668 | -7.39 | 1,165 | -1.10 | ||||
| 2025-08-11 | 13F | FSA Wealth Management LLC | 130 | 0.78 | 5 | 25.00 | ||||
| 2025-08-13 | 13F | Colonial Trust Co / SC | 175 | -11.17 | 7 | -14.29 | ||||
| 2025-07-01 | 13F | Harbor Investment Advisory, Llc | 1,417 | 0.00 | 56 | 12.00 | ||||
| 2025-07-30 | 13F | Drive Wealth Management, Llc | 74,651 | 2.71 | 2,961 | 14.29 | ||||
| 2025-08-07 | 13F | Hennion & Walsh Asset Management, Inc. | 780,476 | 0.19 | 30,954 | 11.45 | ||||
| 2025-08-14 | 13F | Keebeck Wealth Management, LLC | 103,897 | 4,121 | ||||||
| 2025-07-21 | 13F | Patriot Financial Group Insurance Agency, LLC | 7,366 | -21.77 | 292 | -12.84 | ||||
| 2025-08-05 | 13F | Beckerman Institutional, LLC | 15,714 | -1.03 | 1 | |||||
| 2025-07-22 | 13F | Wealthcare Advisory Partners LLC | 217,451 | 1.94 | 8,624 | 13.41 | ||||
| 2025-07-31 | 13F | Leavell Investment Management, Inc. | 31,620 | 0.56 | 1,254 | 11.86 | ||||
| 2025-08-08 | 13F | Gts Securities Llc | 5,743 | 228 | ||||||
| 2025-08-04 | 13F | Amplius Wealth Advisors, LLC | 27,849 | 0.95 | 1,103 | 12.21 | ||||
| 2025-08-05 | 13F | Key FInancial Inc | 39 | 0.00 | 2 | 0.00 | ||||
| 2025-08-14 | 13F | Stifel Financial Corp | 26,851 | -7.02 | 1,065 | 3.40 | ||||
| 2025-07-29 | 13F | Harbor Asset Planning, Inc. | 76,156 | 3,020 | ||||||
| 2025-08-12 | 13F | Proequities, Inc. | 0 | 0 | ||||||
| 2025-08-13 | 13F | Cerity Partners LLC | 1,313,393 | 6.81 | 52,089 | 18.83 | ||||
| 2025-08-14 | 13F | Citadel Advisors Llc | 272,228 | 233.23 | 10,797 | 270.74 | ||||
| 2025-08-13 | 13F | Strategic Family Wealth Counselors, L.L.C. | 8,112 | 0.15 | 322 | 11.46 | ||||
| 2025-07-28 | 13F | Elmwood Wealth Management, Inc. | 78,874 | -1.13 | 3,128 | 10.02 | ||||
| 2025-07-23 | 13F | Sax Wealth Advisors, Llc | 20,113 | 798 | ||||||
| 2025-08-13 | 13F | Cresset Asset Management, LLC | 0 | -100.00 | 0 | |||||
| 2025-08-07 | 13F | SFE Investment Counsel | 7,904 | -60.44 | 313 | -56.04 | ||||
| 2025-07-22 | 13F | Appleton Partners Inc/ma | 434,855 | 0.18 | 17 | 13.33 | ||||
| 2025-08-11 | 13F | TD Waterhouse Canada Inc. | 2,654 | 105 | ||||||
| 2025-08-11 | 13F | Principal Securities, Inc. | 1,088,092 | -6.00 | 43,154 | 11.82 | ||||
| 2025-08-14 | 13F | Bank Of America Corp /de/ | 4,516,794 | 30.31 | 179,136 | 44.96 | ||||
| 2025-07-25 | 13F | Hazlett, Burt & Watson, Inc. | 146 | 1.39 | 0 | |||||
| 2025-07-21 | 13F | Family CFO Inc | 1,491 | 0.00 | 59 | 11.32 | ||||
| 2025-08-08 | 13F | CFO4Life Group, LLC | 141,903 | 1.14 | 5,628 | 12.52 | ||||
| 2025-07-21 | 13F | Hilltop National Bank | 116 | 0.00 | 5 | 33.33 | ||||
| 2025-07-14 | 13F | Armstrong Advisory Group, Inc | 949 | 0.00 | 38 | 19.35 | ||||
| 2025-07-17 | 13F | Wagner Wealth Management, Llc | 6,708 | 1.28 | 266 | 12.71 | ||||
| 2025-07-17 | 13F | Janney Montgomery Scott LLC | 96,799 | -6.31 | 4 | 0.00 | ||||
| 2025-08-19 | 13F | Advisory Services Network, LLC | 26,484 | 0.00 | 1,033 | 9.43 | ||||
| 2025-05-02 | 13F | Whittier Trust Co Of Nevada Inc | 0 | -100.00 | 0 | |||||
| 2025-08-14 | 13F | Goldman Sachs Group Inc | 1,923,066 | 9.30 | 76,269 | 21.59 | ||||
| 2025-08-12 | 13F | Clearwater Capital Advisors, LLC | 66,681 | -5.08 | 2,645 | 5.59 | ||||
| 2025-08-14 | 13F | Glen Eagle Advisors, LLC | 337 | 0.00 | 13 | 8.33 | ||||
| 2025-08-01 | 13F | Ashton Thomas Private Wealth, LLC | 42,905 | 57.73 | 1,702 | 75.54 | ||||
| 2025-07-07 | 13F | Insight Wealth Strategies, LLC | 681,505 | -7.68 | 27,015 | 2.65 | ||||
| 2025-07-17 | 13F | Fifth Third Securities, Inc. | 15,234 | -0.37 | 604 | 10.83 | ||||
| 2025-08-11 | 13F | Citigroup Inc | 13,807 | -1.05 | 548 | 10.06 | ||||
| 2025-08-08 | 13F | Larson Financial Group LLC | 0 | -100.00 | 0 | |||||
| 2025-08-15 | 13F | Tower Research Capital LLC (TRC) | 12 | 0 | ||||||
| 2025-08-15 | 13F | SkyView Investment Advisors, LLC | 1,027,678 | 7.17 | 41 | 17.65 | ||||
| 2025-08-14 | 13F | Great Valley Advisor Group, Inc. | 5,812 | -55.40 | 231 | -50.43 | ||||
| 2025-07-25 | 13F | Envestnet Portfolio Solutions, Inc. | 446,034 | -3.33 | 17,690 | 7.54 | ||||
| 2025-07-23 | 13F | Winthrop Advisory Group LLC | 122,587 | 13.13 | 4,862 | 25.87 | ||||
| 2025-07-30 | 13F | Avidian Wealth Solutions, LLC | 55,188 | -4.07 | 2,189 | 6.73 | ||||
| 2025-08-11 | 13F | Paul R. Ried Financial Group, LLC | 454,486 | 1.53 | 18,025 | 12.95 | ||||
| 2025-08-15 | 13F | Captrust Financial Advisors | 1,268,124 | 1.30 | 50,294 | 12.69 | ||||
| 2025-07-31 | 13F | Hixon Zuercher, LLC | 554,790 | 1.03 | 22,003 | 12.39 | ||||
| 2025-08-05 | 13F | Trail Ridge Investment Advisors, LLC | 471,733 | -6.20 | 18,407 | 2.67 | ||||
| 2025-07-21 | 13F | Ameritas Advisory Services, LLC | 1,705 | 68 | ||||||
| 2025-08-14 | 13F | Comerica Bank | 52,401 | -14.60 | 2,078 | -4.98 | ||||
| 2025-07-22 | 13F | Coastal Investment Advisors, Inc. | 115 | -48.20 | 5 | -42.86 | ||||
| 2025-07-07 | 13F | Nova Wealth Management, Inc. | 0 | -100.00 | 0 | -100.00 | ||||
| 2025-07-18 | 13F | Naples Global Advisors, Llc | 10,779 | 0.00 | 427 | 11.20 | ||||
| 2025-08-12 | 13F | Waddell & Associates, Llc | 14,192 | 0.00 | 563 | 11.29 | ||||
| 2025-08-14 | 13F | Quantinno Capital Management LP | 123,189 | 30.67 | 4,886 | 45.39 | ||||
| 2025-08-12 | 13F | PKS Advisory Services, LLC | 70,895 | -30.59 | 2,812 | -22.80 | ||||
| 2025-07-11 | 13F/A | Umb Bank N A/mo | 2,803 | -20.05 | 111 | -10.48 | ||||
| 2025-07-18 | 13F | Parsons Capital Management Inc/ri | 23,241 | -4.32 | 922 | 6.47 | ||||
| 2025-08-08 | 13F | Pnc Financial Services Group, Inc. | 1,031 | -23.97 | 41 | -16.67 | ||||
| 2025-07-16 | 13F | EdgeRock Capital LLC | 6,946 | 275 | ||||||
| 2025-08-14 | 13F | Hilltop Holdings Inc. | 27,777 | 3.56 | 1,102 | 15.17 | ||||
| 2025-07-17 | 13F | Emerald Advisors, LLC | 42,953 | 65.86 | 1,704 | 84.51 | ||||
| 2025-08-13 | 13F | Flow Traders U.s. Llc | 0 | -100.00 | 0 | |||||
| 2025-08-14 | 13F | Raymond James Financial Inc | 856,839 | 1.32 | 33,982 | 12.72 | ||||
| 2025-08-05 | 13F | EPG Wealth Management LLC | 0 | -100.00 | 0 | |||||
| 2025-08-14 | 13F | Evergreen Wealth Solutions, LLC | 6,550 | 9.17 | 260 | 21.60 | ||||
| 2025-07-08 | 13F | First National Corp /ma/ /adv | 143,385 | 1.95 | 5,687 | 13.40 | ||||
| 2025-08-11 | 13F | Hexagon Capital Partners LLC | 0 | -100.00 | 0 | |||||
| 2025-08-04 | 13F | Ledyard National Bank | 508,812 | -1.73 | 20,179 | 9.32 | ||||
| 2025-07-23 | 13F | Heck Capital Advisors, LLC | 0 | -100.00 | 0 | |||||
| 2025-08-13 | 13F | GeoWealth Management, LLC | 115,397 | -8.25 | 4,577 | 2.07 | ||||
| 2025-08-14 | 13F | Jane Street Group, Llc | 0 | -100.00 | 0 | |||||
| 2025-07-10 | 13F | Global Financial Private Client, LLC | 0 | -100.00 | 0 | |||||
| 2025-08-07 | 13F | Legacy Advisors, LLC | 0 | -100.00 | 0 | |||||
| 2025-07-31 | 13F | Oak Harbor Wealth Partners, Llc | 25,345 | -2.77 | 1,005 | 8.18 | ||||
| 2025-07-28 | 13F | Morris Financial Concepts, Inc. | 6,827 | -0.64 | 271 | 10.66 | ||||
| 2025-08-12 | 13F | O'shaughnessy Asset Management, Llc | 13,386 | 6.76 | 531 | 18.83 | ||||
| 2025-08-08 | 13F | Creative Planning | 11,851 | 19.13 | 470 | 32.77 | ||||
| 2025-08-14 | 13F | Bnp Paribas Arbitrage, Sa | 0 | -100.00 | 0 | |||||
| 2025-07-30 | 13F | D.a. Davidson & Co. | 0 | -100.00 | 0 | |||||
| 2025-08-13 | 13F | Jones Financial Companies Lllp | 59,797 | 143.72 | 2,366 | 168.25 | ||||
| 2025-08-14 | 13F | 10Elms LLP | 392 | 0.00 | 16 | 15.38 | ||||
| 2025-08-15 | 13F | Kestra Advisory Services, LLC | 8,844 | -54.59 | 351 | -82.06 | ||||
| 2025-08-11 | 13F | Aptus Capital Advisors, LLC | 1,191 | 1.45 | 47 | 14.63 | ||||
| 2025-08-14 | 13F | Shepherd Kaplan Krochuk, Llc | 17,264 | -13.47 | 685 | -3.80 | ||||
| 2025-07-24 | 13F | Cascade Investment Group, Inc. | 7,916 | 0.00 | 314 | 10.99 | ||||
| 2025-08-11 | 13F | Annis Gardner Whiting Capital Advisors, LLC | 29,744 | 33.72 | 1,180 | 48.86 | ||||
| 2025-08-13 | 13F | Serenus Wealth Advisors, LLC | 0 | -100.00 | 0 | |||||
| 2025-07-17 | 13F | Archford Capital Strategies, LLC | 6,087 | -1.76 | 241 | 9.55 | ||||
| 2025-08-12 | 13F | Steward Partners Investment Advisory, Llc | 14,379 | -2.13 | 570 | 8.99 | ||||
| 2025-08-12 | 13F | CIBC Private Wealth Group, LLC | 2,467 | 98 | ||||||
| 2025-07-24 | 13F | Blair William & Co/il | 2,203 | -93.30 | 87 | -92.57 | ||||
| 2025-08-08 | 13F | Hartland & Co., LLC | 5,369 | -1.34 | 213 | 9.84 | ||||
| 2025-08-13 | 13F | EverSource Wealth Advisors, LLC | 220,359 | 2.46 | 8,739 | 13.98 | ||||
| 2025-08-14 | 13F | Wiley Bros.-aintree Capital, Llc | 67,554 | -5.71 | 2,674 | 4.49 | ||||
| 2025-08-15 | 13F | Morgan Stanley | 3,326,554 | 4.35 | 131,931 | 16.09 | ||||
| 2025-07-18 | 13F | Consolidated Portfolio Review Corp | 39,846 | 135.78 | 1,580 | 162.46 | ||||
| 2025-08-15 | 13F | CI Private Wealth, LLC | 982,624 | -3.46 | 38,971 | 7.40 | ||||
| 2025-07-21 | 13F | Quent Capital, LLC | 0 | -100.00 | 0 | |||||
| 2025-07-25 | NP | SRGAX - Stringer Growth Fund Class A Shares | 30,345 | 37.02 | 1,189 | 71.68 | ||||
| 2025-07-24 | 13F | Capital Advisors, Ltd. LLC | 59,831 | 0.34 | 2 | 0.00 | ||||
| 2025-08-06 | 13F | Rialto Wealth Management, LLC | 569 | 0.00 | 23 | 10.00 | ||||
| 2025-07-31 | 13F | Buckingham Strategic Partners | 29,041 | 4.97 | 1,152 | 16.73 | ||||
| 2025-08-06 | 13F | Prospera Financial Services Inc | 0 | -100.00 | 0 | |||||
| 2025-04-25 | 13F | Farmers & Merchants Trust Co of Chambersburg PA | 0 | -100.00 | 0 | |||||
| 2025-07-16 | 13F | Register Financial Advisors LLC | 262 | 1.16 | 10 | 11.11 | ||||
| 2025-07-28 | 13F | Duncker Streett & Co Inc | 436 | 0.00 | 17 | 13.33 | ||||
| 2025-07-29 | 13F | Kelman-Lazarov, Inc. | 957,305 | -0.31 | 37,967 | 10.91 | ||||
| 2025-08-13 | 13F | Texas Capital Bank Wealth Management Services Inc | 30,371 | 22.09 | 1,205 | 35.89 | ||||
| 2025-08-14 | 13F | Strategic Wealth Designers | 0 | -100.00 | 0 | -100.00 | ||||
| 2025-08-14 | 13F/A | Rockefeller Capital Management L.P. | 243,871 | 5.36 | 9,672 | 17.21 | ||||
| 2025-07-18 | 13F | Newman Dignan & Sheerar, Inc. | 176,397 | 3.98 | 6,996 | 15.68 | ||||
| 2025-08-08 | 13F | Horizon Family Wealth, Inc. | 409,575 | 3.40 | 16,244 | 15.04 | ||||
| 2025-08-06 | 13F | Commonwealth Equity Services, Llc | 1,697,165 | 0.87 | 67 | 13.56 | ||||
| 2025-08-12 | 13F | Gladstone Institutional Advisory LLC | 273,933 | 1.48 | 10,864 | 12.90 | ||||
| 2025-07-30 | 13F | Silver Oak Wealth Advisors Services, Llc | 648,111 | 33.47 | 25,704 | 48.48 | ||||
| 2025-08-11 | 13F | Alteri Wealth LLC | 8,463 | 0.17 | 336 | 11.30 | ||||
| 2025-07-24 | 13F | GFG Capital, LLC | 705,257 | -11.99 | 27,970 | -2.09 | ||||
| 2025-08-18 | 13F | Geneos Wealth Management Inc. | 194 | 8 | ||||||
| 2025-08-11 | 13F | NewEdge Wealth, LLC | 9,216 | 6.96 | 369 | 20.20 | ||||
| 2025-07-28 | 13F | Private Wealth Asset Management, LLC | 17,705 | 13.45 | 702 | 26.26 | ||||
| 2025-08-06 | 13F | Golden State Wealth Management, LLC | 1,222 | 1.41 | 48 | 14.29 | ||||
| 2025-07-28 | 13F | Turtle Creek Wealth Advisors, LLC | 18,415 | 0.00 | 730 | 11.28 | ||||
| 2025-08-14 | 13F | Smartleaf Asset Management LLC | 39,899 | -6.94 | 1,579 | 2.33 | ||||
| 2025-08-26 | 13F/A | Thrivent Financial For Lutherans | 15,874 | -95.53 | 1 | -100.00 | ||||
| 2025-08-01 | 13F | SYM FINANCIAL Corp | 5,050 | 200 | ||||||
| 2025-08-14 | 13F | Mercer Global Advisors Inc /adv | 175,854 | -5.65 | 6,974 | 4.97 | ||||
| 2025-07-10 | 13F | Wealth Enhancement Advisory Services, Llc | 171,226 | -22.70 | 6,806 | -13.80 | ||||
| 2025-07-18 | 13F | Marino, Stram & Associates Llc | 8,021 | 7.12 | 318 | 19.55 | ||||
| 2025-07-22 | 13F | Merit Financial Group, LLC | 6,963 | 1.35 | 276 | 13.11 | ||||
| 2025-08-19 | NP | GIPIX - Goldman Sachs Balanced Strategy Portfolio Institutional | 149,586 | 10.90 | 5,933 | 23.38 | ||||
| 2025-08-14 | 13F | Ieq Capital, Llc | 10,916 | 433 | ||||||
| 2025-08-01 | 13F | Envestnet Asset Management Inc | 3,307,425 | 2.95 | 131,172 | 14.53 | ||||
| 2025-08-12 | 13F | LPL Financial LLC | 6,138,152 | 0.25 | 243,439 | 11.53 | ||||
| 2025-07-16 | 13F | American National Bank | 634,663 | -1.10 | 25,171 | 10.03 | ||||
| 2025-07-25 | 13F | LRI Investments, LLC | 10,928 | 433 | ||||||
| 2025-08-14 | 13F | Beaird Harris Wealth Management, LLC | 2,414 | 0.00 | 96 | 10.47 | ||||
| 2025-07-24 | 13F | Edge Financial Advisors LLC | 21,307 | -4.62 | 845 | 6.03 | ||||
| 2025-08-07 | 13F/A | Joseph Group Capital Management | 0 | -100.00 | 0 | |||||
| 2025-08-14 | 13F | UBS Group AG | 994,314 | 0.69 | 39,434 | 12.01 | ||||
| 2025-07-22 | 13F | Beacon Financial Advisory LLC | 8,200 | 325 | ||||||
| 2025-08-07 | 13F | Allworth Financial LP | 2,852 | 0.39 | 113 | 8.65 | ||||
| 2025-07-08 | 13F/A | Salem Investment Counselors Inc | 317 | 0.00 | 13 | 9.09 | ||||
| 2025-05-12 | 13F | Sandy Spring Bank | 226 | 0.00 | 8 | 14.29 | ||||
| 2025-07-25 | 13F | NorthRock Partners, LLC | 2,007 | -4.20 | 80 | 6.76 | ||||
| 2025-08-11 | 13F | Brown Brothers Harriman & Co | 948 | 0.00 | 38 | 12.12 | ||||
| 2025-07-29 | 13F | Private Trust Co Na | 3,513 | -23.33 | 139 | -14.72 | ||||
| 2025-07-17 | 13F | Camelot Portfolios, LLC | 14,455 | 19.31 | 573 | 32.95 | ||||
| 2025-07-21 | 13F | Asset Advisors Investment Management, LLC | 161,207 | 6,393 | ||||||
| 2025-08-13 | 13F | StoneX Group Inc. | 0 | -100.00 | 0 | -100.00 | ||||
| 2025-07-17 | 13F | Worth Financial Advisory Group, LLC | 13,709 | 0.00 | 544 | 11.27 | ||||
| 2025-07-15 | 13F | Cora Capital Advisors Llc | 15,712 | 0.00 | 623 | 11.25 | ||||
| 2025-08-13 | 13F | Capital Analysts, Inc. | 26 | 0 | ||||||
| 2025-04-23 | 13F | Mascagni Wealth Management, Inc. | 0 | -100.00 | 0 | -100.00 | ||||
| 2025-08-14 | 13F | IHT Wealth Management, LLC | 5,208 | 207 | ||||||
| 2025-07-25 | 13F | Atria Wealth Solutions, Inc. | 49,892 | -56.21 | 1,979 | -51.29 | ||||
| 2025-07-18 | 13F | SigFig Wealth Management, LLC | 4,494,944 | -1.23 | 177,865 | 8.63 | ||||
| 2025-08-13 | 13F | Townsquare Capital Llc | 5,972 | -93.53 | 237 | -92.82 | ||||
| 2025-07-08 | 13F | Nbc Securities, Inc. | 7,316 | 17.43 | 0 | |||||
| 2025-08-14 | 13F | GWM Advisors LLC | 103,215 | -0.49 | 4,094 | 10.71 | ||||
| 2025-05-15 | 13F/A | Orion Portfolio Solutions, LLC | 102,322 | -0.40 | 3,648 | 6.48 | ||||
| 2025-08-06 | 13F | Round Rock Advisors, LLC | 8,988 | -6.64 | 356 | 3.79 | ||||
| 2025-07-28 | 13F | BRYN MAWR TRUST Co | 4,055 | 0.00 | 161 | 11.11 |
Other Listings
| MX:GSIE |