Mga Batayang Estadistika
| Pemilik Institusional | 105 total, 105 long only, 0 short only, 0 long/short - change of -0.94% MRQ |
| Alokasi Portofolio Rata-rata | 0.3578 % - change of -5.15% MRQ |
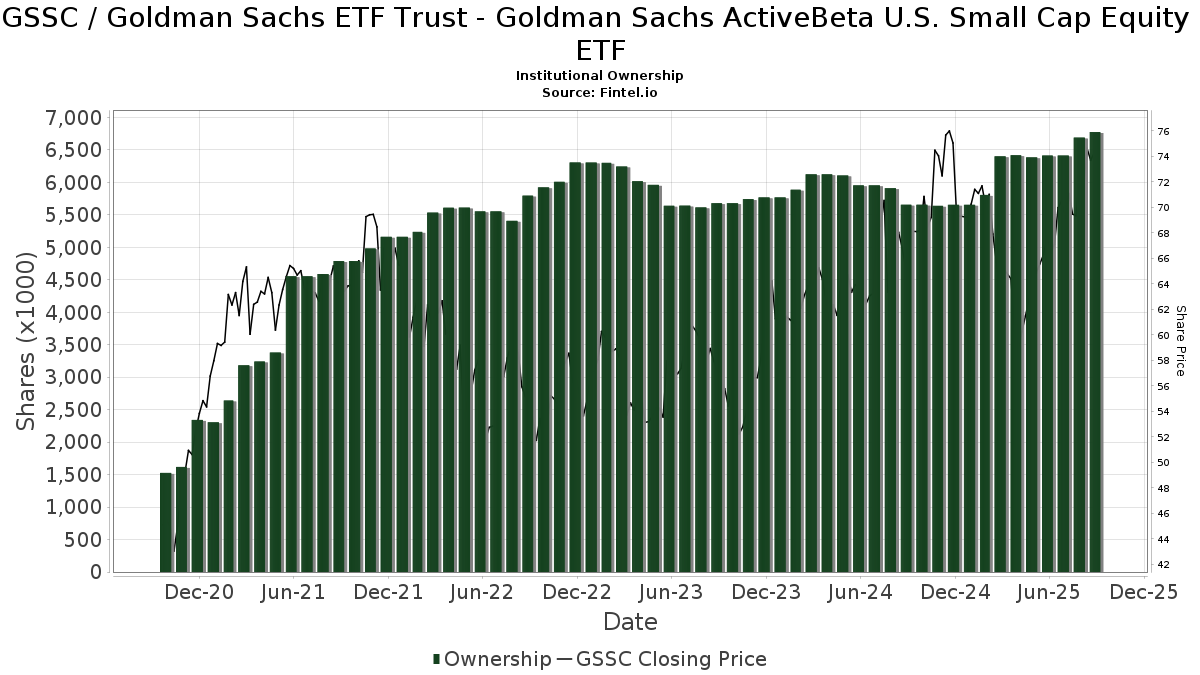
| Saham Institusional (Jangka Panjang) | 6,776,341 (ex 13D/G) - change of 0.36MM shares 5.64% MRQ |
| Nilai Institusional (Jangka Panjang) | $ 401,551 USD ($1000) |
Kepemilikan Institusional dan Pemegang Saham
Goldman Sachs ETF Trust - Goldman Sachs ActiveBeta U.S. Small Cap Equity ETF (US:GSSC) memiliki 105 pemilik institusional dan pemegang saham yang telah mengajukan formulir 13D/G atau 13F kepada Komisi Bursa Efek (Securities Exchange Commission/SEC). Lembaga-lembaga ini memegang total 6,776,341 saham. Pemegang saham terbesar meliputi Betterment LLC, LPL Financial LLC, First Foundation Advisors, American National Bank, Bank Of America Corp /de/, Richard P Slaughter Associates Inc, Envestnet Asset Management Inc, Raymond James Financial Inc, Morgan Stanley, and Brinker Capital Investments, LLC .
Struktur kepemilikan institusional Goldman Sachs ETF Trust - Goldman Sachs ActiveBeta U.S. Small Cap Equity ETF (ARCA:GSSC) menunjukkan posisi terkini di perusahaan oleh institusi dan dana, serta perubahan terbaru dalam ukuran posisi. Pemegang saham utama dapat mencakup investor individu, reksa dana, dana lindung nilai, atau institusi. Jadwal 13D menunjukkan bahwa investor memegang (atau pernah memegang) lebih dari 5% saham perusahaan dan bermaksud (atau pernah bermaksud) untuk secara aktif mengejar perubahan strategi bisnis. Jadwal 13G menunjukkan investasi pasif lebih dari 5%.
The share price as of September 5, 2025 is 74.88 / share. Previously, on September 6, 2024, the share price was 65.02 / share. This represents an increase of 15.16% over that period.
Skor Sentimen Dana
Skor Sentimen Dana (sebelumnya dikenal sebagai Skor Akumulasi Kepemilikan) menemukan saham-saham yang paling banyak dibeli oleh dana. Ini adalah hasil dari model kuantitatif multi-faktor yang canggih yang mengidentifikasi perusahaan dengan tingkat akumulasi institusional tertinggi. Model penilaian menggunakan kombinasi dari total peningkatan pemilik yang diungkapkan, perubahan dalam alokasi portofolio pada pemilik tersebut, dan metrik lainnya. Angka berkisar dari 0 hingga 100, dengan angka yang lebih tinggi menunjukkan tingkat akumulasi yang lebih tinggi dibandingkan dengan perusahaan sejenisnya, dan 50 adalah rata-ratanya.
Frekuensi Pembaruan: Setiap Hari
Lihat Ownership Explorer, yang menyediakan daftar perusahaan dengan peringkat tertinggi.
Rasio Put/Call Institusional
Selain melaporkan isu ekuitas dan utang standar, institusi dengan aset di bawah manajemen lebih dari 100 juta dolar AS juga harus mengungkapkan kepemilikan opsi put dan call mereka. Karena opsi put umumnya menunjukkan sentimen negatif, dan opsi call menunjukkan sentimen positif, kita dapat mengetahui sentimen institusional secara keseluruhan dengan memplot rasio put terhadap call. Grafik di sebelah kanan memplot rasio put/call historis untuk instrumen ini.
Menggunakan Rasio Put/Call sebagai indikator sentimen investor mengatasi salah satu kekurangan utama dari penggunaan total kepemilikan institusional, yaitu sejumlah besar aset yang dikelola diinvestasikan secara pasif untuk melacak indeks. Dana yang dikelola secara pasif biasanya tidak membeli opsi, sehingga indikator rasio put/call lebih akurat dalam melacak sentimen dana yang dikelola secara aktif.
Pengajuan 13F dan NPORT
Detail pada pengajuan 13F tersedia gratis. Detail pada pengajuan NP memerlukan keanggotaan premium. Baris berwarna hijau menunjukkan posisi baru. Baris berwarna merah menunjukkan posisi yang sudah ditutup. Klik tautan ini ikon untuk melihat riwayat transaksi selengkapnya.
Tingkatkan
untuk membuka data premium dan mengekspor ke Excel ![]() .
.
| Tanggal File | Sumber | Investor | Ketik | Presyo ng Avg (Silangan) |
Saham | Δ Saham (%) |
Dilaporkan Nilai ($1000) |
Nilai Δ (%) |
Alokasi Port (%) |
|
|---|---|---|---|---|---|---|---|---|---|---|
| 2025-08-11 | 13F | Blue Bell Private Wealth Management, Llc | 16 | 0.00 | 1 | 0.00 | ||||
| 2025-07-17 | 13F | HB Wealth Management, LLC | 21,190 | 0.00 | 1,454 | 8.11 | ||||
| 2025-08-13 | 13F | Lido Advisors, LLC | 7,752 | 0.00 | 532 | 8.15 | ||||
| 2025-08-13 | 13F | Maia Wealth LLC | 5,844 | -1.96 | 401 | 13.31 | ||||
| 2025-08-11 | 13F | Principal Securities, Inc. | 90,763 | 12.88 | 6,227 | 12.04 | ||||
| 2025-08-12 | 13F | Segall Bryant & Hamill, Llc | 0 | -100.00 | 0 | |||||
| 2025-07-10 | 13F | Sovran Advisors, LLC | 9,255 | -3.56 | 648 | 14.49 | ||||
| 2025-07-29 | 13F | Stephens Inc /ar/ | 28,190 | 0.00 | 1,934 | 8.17 | ||||
| 2025-08-13 | 13F | EverSource Wealth Advisors, LLC | 381 | 0.26 | 26 | 8.33 | ||||
| 2025-07-31 | 13F | Wealthfront Advisers Llc | 11,155 | -18.19 | 765 | -11.46 | ||||
| 2025-08-05 | 13F | Bank of New York Mellon Corp | 7,097 | 4.74 | 487 | 13.29 | ||||
| 2025-07-09 | 13F | Dynamic Advisor Solutions LLC | 39,166 | -21.64 | 2,687 | -15.24 | ||||
| 2025-08-07 | 13F | SFE Investment Counsel | 0 | -100.00 | 0 | |||||
| 2025-08-14 | 13F | First Foundation Advisors | 564,889 | -5.38 | 38,757 | 2.34 | ||||
| 2025-07-08 | 13F | Richard P Slaughter Associates Inc | 298,022 | -6.21 | 20,447 | 1.45 | ||||
| 2025-07-21 | 13F | Quent Capital, LLC | 0 | -100.00 | 0 | |||||
| 2025-07-15 | 13F | McCarthy & Cox | 144,227 | 3.63 | 9,895 | 12.10 | ||||
| 2025-07-17 | 13F | Fifth Third Securities, Inc. | 8,198 | -13.08 | 562 | -6.02 | ||||
| 2025-07-14 | 13F | Gries Financial Llc | 3,029 | 208 | ||||||
| 2025-05-15 | 13F | Stonehaven Wealth & Tax Solutions, Llc | 0 | -100.00 | 0 | |||||
| 2025-08-11 | 13F | TD Waterhouse Canada Inc. | 0 | -100.00 | 0 | |||||
| 2025-07-31 | 13F | CNB Bank | 170 | 0.00 | 12 | 10.00 | ||||
| 2025-08-14 | 13F | Glenview Trust Co | 11,630 | -0.03 | 798 | 8.14 | ||||
| 2025-08-11 | 13F | Citigroup Inc | 2 | 0 | ||||||
| 2025-08-14 | 13F | Bank Of America Corp /de/ | 316,676 | -2.39 | 21,727 | 5.59 | ||||
| 2025-07-28 | 13F | Mutual Advisors, LLC | 4,079 | -8.54 | 286 | 4.76 | ||||
| 2025-08-14 | 13F | Integrated Wealth Concepts LLC | 3,810 | 4.01 | 261 | 12.50 | ||||
| 2025-08-07 | 13F | Verus Capital Partners, Llc | 24,870 | 1,706 | ||||||
| 2025-08-14 | 13F | Susquehanna International Group, Llp | 0 | -100.00 | 0 | |||||
| 2025-07-11 | 13F/A | Umb Bank N A/mo | 116 | -54.86 | 8 | -56.25 | ||||
| 2025-07-24 | 13F | Louisbourg Investments Inc. | 30 | 0.00 | 2 | 100.00 | ||||
| 2025-07-25 | 13F | Envestnet Portfolio Solutions, Inc. | 39,010 | -0.49 | 2,676 | 7.64 | ||||
| 2025-08-06 | 13F | AE Wealth Management LLC | 43 | 59.26 | 3 | 100.00 | ||||
| 2025-08-11 | 13F | Paul R. Ried Financial Group, LLC | 164,732 | -18.41 | 11,302 | -11.75 | ||||
| 2025-08-15 | 13F | Morgan Stanley | 178,181 | 11.99 | 12,225 | 21.14 | ||||
| 2025-08-07 | 13F | Vise Technologies, Inc. | 0 | -100.00 | 0 | |||||
| 2025-07-31 | 13F | Hixon Zuercher, LLC | 38,609 | -17.74 | 2,649 | -11.05 | ||||
| 2025-07-21 | 13F | Ameritas Advisory Services, LLC | 649 | 45 | ||||||
| 2025-04-30 | 13F | Axxcess Wealth Management, Llc | 0 | -100.00 | 0 | |||||
| 2025-08-14 | 13F | LifePlan Investment Advisors, Inc. | 6,380 | 39.82 | 438 | 51.21 | ||||
| 2025-05-16 | 13F | Coppell Advisory Solutions LLC | 0 | -100.00 | 0 | |||||
| 2025-08-14 | 13F | Comerica Bank | 194 | 0.00 | 13 | 8.33 | ||||
| 2025-08-04 | 13F | Linscomb & Williams, Inc. | 48,556 | 5.49 | 3,331 | 14.11 | ||||
| 2025-08-14 | 13F | Fmr Llc | 917 | -34.17 | 63 | -29.55 | ||||
| 2025-08-04 | 13F | Kovack Advisors, Inc. | 3,000 | 206 | ||||||
| 2025-07-23 | 13F | Heck Capital Advisors, LLC | 168,642 | 0.05 | 11,571 | 8.22 | ||||
| 2025-08-01 | 13F | Strategic Financial Services, Inc, | 105,706 | 79.39 | 7,252 | 94.06 | ||||
| 2025-08-12 | 13F | Jpmorgan Chase & Co | 161 | 0.00 | 11 | 10.00 | ||||
| 2025-08-07 | 13F | CENTRAL TRUST Co | 25,636 | -16.36 | 1,759 | -9.57 | ||||
| 2025-07-29 | NP | EBI - Longview Advantage ETF | 0 | -100.00 | 0 | -100.00 | ||||
| 2025-08-14 | 13F | Betterment LLC | 762,667 | 27.97 | 52 | 40.54 | ||||
| 2025-07-22 | 13F | Miracle Mile Advisors, LLC | 6,484 | -42.69 | 445 | -38.08 | ||||
| 2025-08-14 | 13F | Raymond James Financial Inc | 231,414 | 12.02 | 15,877 | 21.17 | ||||
| 2025-09-04 | 13F/A | Advisor Group Holdings, Inc. | 50,258 | 280.14 | 3,448 | 311.46 | ||||
| 2025-05-06 | 13F | Venturi Wealth Management, LLC | 0 | -100.00 | 0 | |||||
| 2025-08-14 | 13F | Two Sigma Investments, Lp | 0 | -100.00 | 0 | |||||
| 2025-04-22 | 13F | Private Wealth Partners, LLC | 0 | -100.00 | 0 | |||||
| 2025-08-27 | 13F/A | Brinker Capital Investments, LLC | 177,845 | 0.18 | 12,202 | 8.36 | ||||
| 2025-05-15 | 13F | Citadel Advisors Llc | 0 | -100.00 | 0 | |||||
| 2025-08-11 | 13F | Private Advisor Group, LLC | 21,427 | -9.80 | 1,470 | -2.39 | ||||
| 2025-08-12 | 13F | Proequities, Inc. | 0 | 0 | ||||||
| 2025-08-12 | 13F | O'shaughnessy Asset Management, Llc | 94 | 46.88 | 6 | 50.00 | ||||
| 2025-07-28 | 13F | Morris Financial Concepts, Inc. | 3,545 | -23.98 | 243 | -17.63 | ||||
| 2025-07-21 | 13F | Financial Architects, LLC | 170,750 | -2.23 | 11,715 | 5.75 | ||||
| 2025-07-21 | 13F | Monticello Wealth Management, Llc | 143,342 | -2.12 | 9,835 | 5.87 | ||||
| 2025-08-11 | 13F | Aptus Capital Advisors, LLC | 992 | 0.00 | 68 | 9.68 | ||||
| 2025-07-28 | 13F | Harbour Investments, Inc. | 665 | -11.33 | 46 | -4.26 | ||||
| 2025-08-11 | 13F | HHM Wealth Advisors, LLC | 196 | -40.24 | 13 | -35.00 | ||||
| 2025-05-15 | 13F/A | Orion Portfolio Solutions, LLC | 177,532 | 1.74 | 11,261 | -6.65 | ||||
| 2025-08-12 | 13F | Steward Partners Investment Advisory, Llc | 408 | 0.00 | 28 | 8.00 | ||||
| 2025-07-24 | 13F | Blair William & Co/il | 218 | 0.00 | 15 | 7.69 | ||||
| 2025-07-24 | 13F | IFP Advisors, Inc | 173,626 | 4.10 | 11,913 | 12.60 | ||||
| 2025-05-01 | 13F | Freedom Day Solutions, LLC | 0 | -100.00 | 0 | -100.00 | ||||
| 2025-07-11 | 13F | Spence Asset Management | 38,107 | 4.20 | 3 | 0.00 | ||||
| 2025-08-14 | 13F | GWM Advisors LLC | 6,937 | 8.83 | 476 | 17.57 | ||||
| 2025-07-10 | 13F | Community Trust & Investment Co | 3,866 | 0.00 | 265 | 8.16 | ||||
| 2025-08-15 | 13F | CI Private Wealth, LLC | 10,947 | -19.08 | 751 | -12.47 | ||||
| 2025-07-24 | 13F | Us Bancorp \de\ | 33 | 0.00 | 2 | 0.00 | ||||
| 2025-08-04 | 13F | Great Lakes Retirement, Inc. | 109,821 | -39.21 | 7,535 | -34.25 | ||||
| 2025-07-22 | 13F/A | Duncan Williams Asset Management, LLC | 134,394 | 420.79 | 9,221 | 463.57 | ||||
| 2025-08-21 | 13F | Aveo Capital Partners, LLC | 0 | -100.00 | 0 | |||||
| 2025-07-25 | 13F | Cwm, Llc | 50 | 0 | ||||||
| 2025-08-12 | 13F | MAI Capital Management | 1,813 | 0.00 | 124 | 8.77 | ||||
| 2025-07-30 | 13F | Syntegra Private Wealth Group, LLC | 17,104 | 1,174 | ||||||
| 2025-07-14 | 13F | U.S. Capital Wealth Advisors, LLC | 3,240 | 0.00 | 222 | 8.29 | ||||
| 2025-07-10 | 13F | Wealth Enhancement Advisory Services, Llc | 30,842 | -35.63 | 2,179 | -28.33 | ||||
| 2025-04-21 | 13F | Nelson, Van Denburg & Campbell Wealth Management Group, LLC | 0 | -100.00 | 0 | |||||
| 2025-08-14 | 13F | Wells Fargo & Company/mn | 391 | 551.67 | 27 | 766.67 | ||||
| 2025-08-04 | 13F | Creative Financial Designs Inc /adv | 8 | 1 | ||||||
| 2025-08-12 | 13F | Gladstone Institutional Advisory LLC | 15,486 | 6.67 | 1,062 | 15.43 | ||||
| 2025-08-13 | 13F | Northwestern Mutual Wealth Management Co | 42 | 0.00 | 3 | 0.00 | ||||
| 2025-08-06 | 13F | Commonwealth Equity Services, Llc | 107,352 | 4.42 | 7 | 16.67 | ||||
| 2025-08-05 | 13F | Bank Of Montreal /can/ | 50 | 0.00 | 3 | 0.00 | ||||
| 2025-08-14 | 13F | CoreCap Advisors, LLC | 38,121 | 1.74 | 2,616 | 10.06 | ||||
| 2025-07-23 | 13F | Sax Wealth Advisors, Llc | 3,590 | 246 | ||||||
| 2025-08-15 | 13F | Equitable Holdings, Inc. | 0 | -100.00 | 0 | |||||
| 2025-05-14 | 13F | Ameriprise Financial Inc | 0 | -100.00 | 0 | -100.00 | ||||
| 2025-08-12 | 13F | Coldstream Capital Management Inc | 0 | -100.00 | 0 | |||||
| 2025-08-12 | 13F | Global Retirement Partners, LLC | 2,785 | -73.61 | 191 | -73.80 | ||||
| 2025-08-06 | 13F | Ethos Financial Group, LLC | 3,047 | 209 | ||||||
| 2025-08-08 | 13F | Cetera Investment Advisers | 121,886 | 3.78 | 8,363 | 12.26 | ||||
| 2025-05-07 | 13F | WMS Partners, LLC | 0 | -100.00 | 0 | |||||
| 2025-08-01 | 13F | Envestnet Asset Management Inc | 290,428 | 8.10 | 19,926 | 16.93 | ||||
| 2025-08-12 | 13F | LPL Financial LLC | 647,204 | 5.03 | 44,405 | 13.60 | ||||
| 2025-08-14 | 13F | Goldman Sachs Group Inc | 12,406 | -0.59 | 851 | 7.59 | ||||
| 2025-07-08 | 13F | Apella Capital, LLC | 3,549 | 0.14 | 247 | 15.49 | ||||
| 2025-07-16 | 13F | American National Bank | 460,771 | -8.21 | 31,613 | -0.71 | ||||
| 2025-08-12 | 13F | SRS Capital Advisors, Inc. | 0 | -100.00 | 0 | |||||
| 2025-08-14 | 13F | Royal Bank Of Canada | 90,047 | 5.66 | 6,178 | 14.30 | ||||
| 2025-08-14 | 13F | UBS Group AG | 133 | -96.44 | 9 | -96.20 | ||||
| 2025-07-24 | 13F | Edge Financial Advisors LLC | 3,653 | -25.14 | 253 | -18.45 | ||||
| 2025-08-18 | 13F | Hollencrest Capital Management | 29 | 2 | ||||||
| 2025-08-07 | 13F | Allworth Financial LP | 303 | 0.00 | 21 | 11.11 | ||||
| 2025-08-14 | 13F | Smartleaf Asset Management LLC | 0 | -100.00 | 0 | |||||
| 2025-07-29 | 13F | Private Trust Co Na | 599 | 49.75 | 41 | 64.00 | ||||
| 2025-08-13 | 13F | Russell Investments Group, Ltd. | 49 | -78.22 | 3 | -78.57 | ||||
| 2025-07-17 | 13F | Wagner Wealth Management, Llc | 2 | 0.00 | 0 | |||||
| 2025-08-12 | 13F | Ameritas Investment Partners, Inc. | 36 | 2 | ||||||
| 2025-08-08 | 13F | Crossmark Global Holdings, Inc. | 29,945 | 2.67 | 2,051 | 10.99 | ||||
| 2025-08-18 | 13F | Tyler-Stone Wealth Management | 3,600 | -23.40 | 247 | -17.45 | ||||
| 2025-07-25 | 13F | PrairieView Partners, LLC | 11 | 0.00 | 0 | |||||
| 2025-08-12 | 13F | Inscription Capital, LLC | 0 | -100.00 | 0 | |||||
| 2025-07-30 | 13F | Gables Capital Management Inc. | 6 | 0.00 | 0 | |||||
| 2025-07-09 | 13F | High Probability Advisors, LLC | 148,937 | 14.48 | 10,219 | 23.82 | ||||
| 2025-05-12 | 13F | Independent Advisor Alliance | 0 | -100.00 | 0 | |||||
| 2025-07-29 | 13F | Aire Advisors, Llc | 5,000 | 0.00 | 343 | 8.20 | ||||
| 2025-08-12 | 13F | Change Path, LLC | 12,955 | -12.23 | 889 | -5.13 | ||||
| 2025-05-07 | 13F | David R. Rahn & Associates Inc. | 0 | -100.00 | 0 | |||||
| 2025-07-08 | 13F | Nbc Securities, Inc. | 3,493 | 0.00 | 0 | |||||
| 2025-08-11 | 13F | Bell Investment Advisors, Inc | 96,836 | 11.12 | 6,644 | 20.19 | ||||
| 2025-08-14 | 13F | Keebeck Wealth Management, LLC | 9,698 | 665 | ||||||
| 2025-07-25 | 13F | Atria Wealth Solutions, Inc. | 4,303 | -55.39 | 295 | -51.72 |