Mga Batayang Estadistika
| Pemilik Institusional | 184 total, 184 long only, 0 short only, 0 long/short - change of 2.76% MRQ |
| Alokasi Portofolio Rata-rata | 0.1469 % - change of -0.70% MRQ |
| Saham Institusional (Jangka Panjang) | 5,883,530 (ex 13D/G) - change of 0.12MM shares 2.11% MRQ |
| Nilai Institusional (Jangka Panjang) | $ 286,125 USD ($1000) |
Kepemilikan Institusional dan Pemegang Saham
iShares Trust - iShares Cybersecurity and Tech ETF (US:IHAK) memiliki 184 pemilik institusional dan pemegang saham yang telah mengajukan formulir 13D/G atau 13F kepada Komisi Bursa Efek (Securities Exchange Commission/SEC). Lembaga-lembaga ini memegang total 5,883,530 saham. Pemegang saham terbesar meliputi Bank Of America Corp /de/, Morgan Stanley, LPL Financial LLC, Wharton Business Group, LLC, UBS Group AG, Advisor Group Holdings, Inc., Ameriprise Financial Inc, Scotia Capital Inc., HighTower Advisors, LLC, and Royal Bank Of Canada .
Struktur kepemilikan institusional iShares Trust - iShares Cybersecurity and Tech ETF (ARCA:IHAK) menunjukkan posisi terkini di perusahaan oleh institusi dan dana, serta perubahan terbaru dalam ukuran posisi. Pemegang saham utama dapat mencakup investor individu, reksa dana, dana lindung nilai, atau institusi. Jadwal 13D menunjukkan bahwa investor memegang (atau pernah memegang) lebih dari 5% saham perusahaan dan bermaksud (atau pernah bermaksud) untuk secara aktif mengejar perubahan strategi bisnis. Jadwal 13G menunjukkan investasi pasif lebih dari 5%.
The share price as of September 5, 2025 is 51.46 / share. Previously, on September 9, 2024, the share price was 46.20 / share. This represents an increase of 11.38% over that period.

Skor Sentimen Dana
Skor Sentimen Dana (sebelumnya dikenal sebagai Skor Akumulasi Kepemilikan) menemukan saham-saham yang paling banyak dibeli oleh dana. Ini adalah hasil dari model kuantitatif multi-faktor yang canggih yang mengidentifikasi perusahaan dengan tingkat akumulasi institusional tertinggi. Model penilaian menggunakan kombinasi dari total peningkatan pemilik yang diungkapkan, perubahan dalam alokasi portofolio pada pemilik tersebut, dan metrik lainnya. Angka berkisar dari 0 hingga 100, dengan angka yang lebih tinggi menunjukkan tingkat akumulasi yang lebih tinggi dibandingkan dengan perusahaan sejenisnya, dan 50 adalah rata-ratanya.
Frekuensi Pembaruan: Setiap Hari
Lihat Ownership Explorer, yang menyediakan daftar perusahaan dengan peringkat tertinggi.
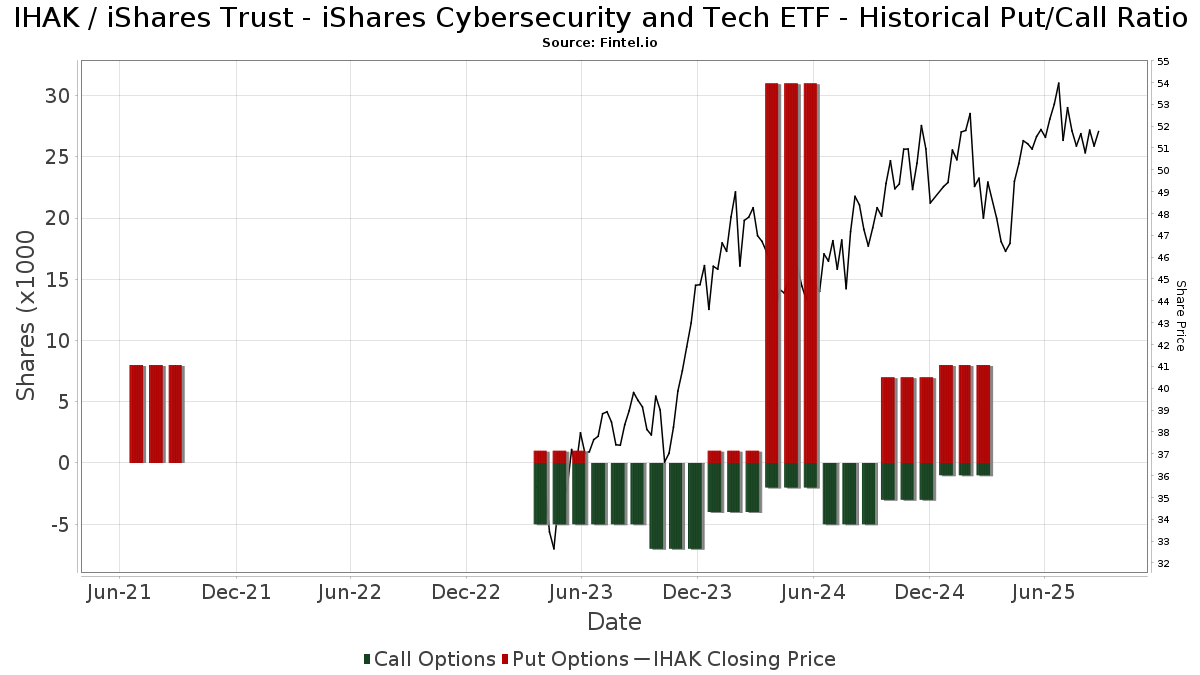
Rasio Put/Call Institusional
Selain melaporkan isu ekuitas dan utang standar, institusi dengan aset di bawah manajemen lebih dari 100 juta dolar AS juga harus mengungkapkan kepemilikan opsi put dan call mereka. Karena opsi put umumnya menunjukkan sentimen negatif, dan opsi call menunjukkan sentimen positif, kita dapat mengetahui sentimen institusional secara keseluruhan dengan memplot rasio put terhadap call. Grafik di sebelah kanan memplot rasio put/call historis untuk instrumen ini.
Menggunakan Rasio Put/Call sebagai indikator sentimen investor mengatasi salah satu kekurangan utama dari penggunaan total kepemilikan institusional, yaitu sejumlah besar aset yang dikelola diinvestasikan secara pasif untuk melacak indeks. Dana yang dikelola secara pasif biasanya tidak membeli opsi, sehingga indikator rasio put/call lebih akurat dalam melacak sentimen dana yang dikelola secara aktif.
Pengajuan 13F dan NPORT
Detail pada pengajuan 13F tersedia gratis. Detail pada pengajuan NP memerlukan keanggotaan premium. Baris berwarna hijau menunjukkan posisi baru. Baris berwarna merah menunjukkan posisi yang sudah ditutup. Klik tautan ini ikon untuk melihat riwayat transaksi selengkapnya.
Tingkatkan
untuk membuka data premium dan mengekspor ke Excel ![]() .
.
| Tanggal File | Sumber | Investor | Ketik | Presyo ng Avg (Silangan) |
Saham | Δ Saham (%) |
Dilaporkan Nilai ($1000) |
Nilai Δ (%) |
Alokasi Port (%) |
|
|---|---|---|---|---|---|---|---|---|---|---|
| 2025-08-05 | 13F | GHP Investment Advisors, Inc. | 175 | 9 | ||||||
| 2025-08-11 | 13F | Blue Bell Private Wealth Management, Llc | 1,970 | -0.56 | 105 | 11.83 | ||||
| 2025-07-24 | 13F | Capital Advisors, Ltd. LLC | 1,752 | 79.69 | 0 | |||||
| 2025-07-17 | 13F | HB Wealth Management, LLC | 0 | -100.00 | 0 | |||||
| 2025-07-28 | 13F | Private Wealth Asset Management, LLC | 555 | 30 | ||||||
| 2025-08-06 | 13F | AE Wealth Management LLC | 9,231 | 527.53 | 491 | 611.59 | ||||
| 2025-08-06 | 13F | Mascagni Wealth Management, Inc. | 4,957 | -11.73 | 264 | 0.00 | ||||
| 2025-08-14 | 13F | Valley Financial Group, Inc. | 7,371 | -1.82 | 392 | 11.36 | ||||
| 2025-08-11 | 13F | Y.D. More Investments Ltd | 2,395 | 2.57 | 127 | 16.51 | ||||
| 2025-08-12 | 13F | Coston, McIsaac & Partners | 539 | 0.00 | 0 | |||||
| 2025-08-13 | 13F | Virtue Capital Management, LLC | 0 | -100.00 | 0 | |||||
| 2025-07-15 | 13F | Cora Capital Advisors Llc | 21,228 | -2.18 | 1,130 | 10.79 | ||||
| 2025-08-14 | 13F | Susquehanna International Group, Llp | 6,469 | -24.30 | 344 | -14.21 | ||||
| 2025-07-16 | 13F | Crowley Wealth Management, Inc. | 300 | 0.00 | 16 | 7.14 | ||||
| 2025-05-08 | 13F | Arkadios Wealth Advisors | 0 | -100.00 | 0 | |||||
| 2025-07-15 | 13F | Bfsg, Llc | 237 | 0.00 | 13 | 9.09 | ||||
| 2025-08-07 | 13F | Allworth Financial LP | 1,026 | -18.44 | 55 | -10.00 | ||||
| 2025-08-14 | 13F | BTG Pactual Asset Management US LLC | 500 | 0.00 | 27 | 13.04 | ||||
| 2025-07-29 | 13F | Chicago Partners Investment Group LLC | 14,467 | -1.36 | 764 | 3.66 | ||||
| 2025-08-01 | 13F | Gwn Securities Inc. | 3,998 | 213 | ||||||
| 2025-08-08 | 13F | Glassman Wealth Services | 22 | 0.00 | 1 | 0.00 | ||||
| 2025-08-14 | 13F | Mml Investors Services, Llc | 19,711 | 6.42 | 1 | |||||
| 2025-08-01 | 13F | Centerpoint Advisors, LLC | 100 | 0.00 | 0 | |||||
| 2025-08-12 | 13F | Accredited Wealth Management, LLC | 0 | -100.00 | 0 | |||||
| 2025-07-24 | 13F | Cyndeo Wealth Partners, LLC | 0 | -100.00 | 0 | |||||
| 2025-08-12 | 13F | AlphaCore Capital LLC | 1,100 | 0.00 | 59 | 13.73 | ||||
| 2025-08-14 | 13F | Connecticut Wealth Management, LLC | 0 | -100.00 | 0 | |||||
| 2025-08-07 | 13F | McClarren Financial Advisors, Inc. | 0 | -100.00 | 0 | |||||
| 2025-08-12 | 13F | Global Retirement Partners, LLC | 14,214 | -8.49 | 756 | -0.13 | ||||
| 2025-05-13 | 13F | Watts Gwilliam & Co., LLC | 44,978 | 0.66 | 2,113 | -3.56 | ||||
| 2025-05-15 | 13F | Marshall Wace, Llp | 0 | -100.00 | 0 | |||||
| 2025-08-12 | 13F | MAI Capital Management | 382 | 0.26 | 20 | 17.65 | ||||
| 2025-08-01 | 13F | Envestnet Asset Management Inc | 9,075 | 51.48 | 483 | 71.53 | ||||
| 2025-08-12 | 13F | Steward Partners Investment Advisory, Llc | 31,653 | 3.63 | 1,684 | 17.35 | ||||
| 2025-05-09 | 13F | Fairfield Financial Advisors, LTD | 0 | -100.00 | 0 | |||||
| 2025-07-23 | 13F | Valmark Advisers, Inc. | 3,780 | 201 | ||||||
| 2025-07-31 | 13F | Rational Advisors Llc | 7,816 | -9.94 | 416 | 1.97 | ||||
| 2025-08-13 | 13F | Providence Capital Advisors, LLC | 386 | 21 | ||||||
| 2025-08-07 | 13F | Fountainhead AM, LLC | 7,469 | -4.27 | 397 | 8.47 | ||||
| 2025-08-14 | 13F | Qube Research & Technologies Ltd | 838 | 45 | ||||||
| 2025-08-05 | 13F | Carolinas Wealth Consulting Llc | 0 | -100.00 | 0 | |||||
| 2025-07-29 | 13F | Portland Financial Advisors Inc | 6,105 | 0.41 | 325 | 13.68 | ||||
| 2025-08-14 | 13F | Mariner, LLC | 29,486 | 7.90 | 1,569 | 22.21 | ||||
| 2025-07-25 | 13F | Retirement Planning Group, Llc / Ny | 3,921 | 209 | ||||||
| 2025-05-02 | 13F | Apollon Wealth Management, LLC | 0 | -100.00 | 0 | |||||
| 2025-05-15 | 13F | IHT Wealth Management, LLC | 0 | -100.00 | 0 | |||||
| 2025-07-14 | 13F | Sowell Financial Services LLC | 5,073 | -1.17 | 270 | 11.62 | ||||
| 2025-08-14 | 13F | Wharton Business Group, LLC | 318,135 | -0.08 | 17 | 14.29 | ||||
| 2025-08-12 | 13F | Franklin Resources Inc | 7,381 | 0.01 | 393 | 13.29 | ||||
| 2025-05-12 | 13F | Sandy Spring Bank | 2,497 | 117 | ||||||
| 2025-08-11 | 13F | ICICI Prudential Asset Management Co Ltd | 6,480 | 0.00 | 345 | 13.91 | ||||
| 2025-08-12 | 13F | LPL Financial LLC | 341,669 | 7.39 | 18,180 | 21.64 | ||||
| 2025-08-13 | 13F | Brentview Investment Management LLC | 500 | 0.00 | 27 | 13.04 | ||||
| 2025-08-14 | 13F | Stifel Financial Corp | 52,638 | 3.39 | 2,801 | 17.11 | ||||
| 2025-07-16 | 13F | Signature Resources Capital Management, LLC | 389 | 21 | ||||||
| 2025-08-12 | 13F | Minot DeBlois Advisors LLC | 115 | 0.00 | 6 | 20.00 | ||||
| 2025-04-23 | 13F | Gimbal Financial | 0 | -100.00 | 0 | |||||
| 2025-08-05 | 13F | Bank Of Montreal /can/ | 43,786 | 0.37 | 2,330 | 13.67 | ||||
| 2025-08-05 | 13F | Huntington National Bank | 50 | -39.02 | ||||||
| 2025-08-14 | 13F | Citadel Advisors Llc | 0 | -100.00 | 0 | |||||
| 2025-08-14 | 13F | Citadel Advisors Llc | Call | 0 | -100.00 | 0 | ||||
| 2025-08-11 | 13F | HighTower Advisors, LLC | 129,798 | 2.74 | 6,907 | 16.36 | ||||
| 2025-08-13 | 13F | Kilter Group LLC | 0 | 0 | ||||||
| 2025-08-14 | 13F | Comerica Bank | 11,029 | 1.93 | 587 | 15.35 | ||||
| 2025-08-13 | 13F | Capital Analysts, Inc. | 0 | -100.00 | 0 | |||||
| 2025-08-14 | 13F | Sunbelt Securities, Inc. | 3,542 | 26.50 | 173 | 31.30 | ||||
| 2025-07-25 | 13F | NorthRock Partners, LLC | 147 | 0.00 | 8 | 16.67 | ||||
| 2025-08-14 | 13F/A | Barclays Plc | 741 | -61.82 | 0 | |||||
| 2025-08-08 | 13F | Hartland & Co., LLC | 1,137 | 0.00 | 60 | 13.21 | ||||
| 2025-07-31 | 13F | Cambridge Investment Research Advisors, Inc. | 28,424 | 3.14 | 2 | 0.00 | ||||
| 2025-04-28 | 13F | Buffington Mohr McNeal | 0 | -100.00 | 0 | |||||
| 2025-08-12 | 13F | Titleist Asset Management, Llc | 12,005 | 2.13 | 639 | 15.58 | ||||
| 2025-08-06 | 13F | Csenge Advisory Group | 35,374 | -0.42 | 1,804 | 9.87 | ||||
| 2025-08-13 | 13F | Baird Financial Group, Inc. | 51,752 | 49.71 | 2,754 | 69.52 | ||||
| 2025-08-12 | 13F | Richard W. Paul & Associates, LLC | 182 | 5.20 | 10 | 12.50 | ||||
| 2025-04-21 | 13F | Nelson, Van Denburg & Campbell Wealth Management Group, LLC | 0 | -100.00 | 0 | |||||
| 2025-07-15 | 13F | Mather Group, Llc. | 0 | -100.00 | 0 | |||||
| 2025-08-08 | 13F | Smithfield Trust Co | 485 | 0.00 | 0 | |||||
| 2025-07-21 | 13F | Warner Financial, Inc | 6,747 | -19.34 | 0 | |||||
| 2025-07-25 | 13F | Cwm, Llc | 13,577 | -0.21 | 1 | |||||
| 2025-08-08 | 13F | Creative Planning | 18,292 | -2.03 | 973 | 10.95 | ||||
| 2025-08-08 | 13F | Pnc Financial Services Group, Inc. | 2,174 | -58.44 | 116 | -53.06 | ||||
| 2025-07-23 | 13F | Detalus Advisors, LLC | 4,351 | -3.61 | 232 | 8.96 | ||||
| 2025-08-06 | 13F | Wedbush Securities Inc | 0 | -100.00 | 0 | |||||
| 2025-07-25 | 13F | Stonehage Fleming Financial Services Holdings Ltd | 15,000 | 0.00 | 798 | 13.35 | ||||
| 2025-08-13 | 13F | WCG Wealth Advisors LLC | 21,871 | -3.74 | 1,164 | 9.00 | ||||
| 2025-09-04 | 13F/A | Advisor Group Holdings, Inc. | 146,412 | 189.44 | 7,793 | 227.67 | ||||
| 2025-08-14 | 13F | Integrated Wealth Concepts LLC | 6,085 | 0.00 | 324 | 13.33 | ||||
| 2025-07-29 | NP | EBI - Longview Advantage ETF | 0 | -100.00 | 0 | -100.00 | ||||
| 2025-07-11 | 13F | SILVER OAK SECURITIES, Inc | 8,533 | 5.25 | 454 | 17.62 | ||||
| 2025-08-05 | 13F | C2P Capital Advisory Group, LLC d.b.a. Prosperity Capital Advisors | 8,331 | 22.53 | 443 | 37.58 | ||||
| 2025-08-15 | 13F | Morgan Stanley | 430,947 | -8.73 | 22,931 | 3.37 | ||||
| 2025-07-24 | 13F | Us Bancorp \de\ | 3,228 | 1,334.67 | 172 | 1,610.00 | ||||
| 2025-08-08 | 13F | Larson Financial Group LLC | 93 | 0.00 | 5 | 0.00 | ||||
| 2025-08-08 | 13F | Intrua Financial, LLC | 22,481 | 3.76 | 1,196 | 17.60 | ||||
| 2025-07-17 | 13F | Janney Montgomery Scott LLC | 4,708 | 0 | ||||||
| 2025-07-11 | 13F | Farther Finance Advisors, LLC | 2,378 | 23.34 | 127 | 38.46 | ||||
| 2025-08-11 | 13F/A | Purus Wealth Management, LLC | 6,436 | -0.69 | 342 | 12.50 | ||||
| 2025-08-14 | 13F | Raymond James Financial Inc | 46,182 | 0.64 | 2,457 | 14.01 | ||||
| 2025-08-11 | 13F | VSM Wealth Advisory, LLC | 74 | 0.00 | 4 | 0.00 | ||||
| 2025-07-23 | 13F | West Paces Advisors Inc. | 0 | -100.00 | 0 | |||||
| 2025-08-13 | 13F | Northwestern Mutual Wealth Management Co | 10,823 | 16.85 | 576 | 32.18 | ||||
| 2025-08-14 | 13F | Visionary Wealth Advisors | 15,898 | 4.16 | 846 | 17.85 | ||||
| 2025-08-12 | 13F | O'shaughnessy Asset Management, Llc | 1 | 0.00 | 0 | |||||
| 2025-07-18 | 13F | PFG Investments, LLC | 3,845 | 205 | ||||||
| 2025-08-14 | 13F | Ieq Capital, Llc | 9,411 | 5.98 | 501 | 19.90 | ||||
| 2025-05-12 | 13F | Independent Advisor Alliance | 0 | -100.00 | 0 | |||||
| 2025-08-13 | 13F | Northern Trust Corp | 5,478 | 2.72 | 291 | 16.40 | ||||
| 2025-07-09 | 13F | Bulwark Capital Corp | 11,976 | 637 | ||||||
| 2025-08-15 | 13F | Provenance Wealth Advisors, LLC | 342 | 0.00 | 18 | 12.50 | ||||
| 2025-05-12 | 13F | Kohmann Bosshard Financial Services, LLC | 0 | -100.00 | 0 | |||||
| 2025-08-08 | 13F | Cetera Investment Advisers | 24,405 | 0.33 | 1,299 | 13.66 | ||||
| 2025-05-15 | 13F | Talon Private Wealth, LLC | 0 | -100.00 | 0 | -100.00 | ||||
| 2025-07-28 | 13F | Mowery & Schoenfeld Wealth Management, LLC | 109 | 0.00 | 6 | 0.00 | ||||
| 2025-08-13 | 13F | Crosspoint Financial, Llc | 52,181 | 2.44 | 2,777 | 16.01 | ||||
| 2025-08-06 | 13F/A | Flagship Private Wealth, LLC | 4,161 | 221 | ||||||
| 2025-08-08 | 13F | Avantax Advisory Services, Inc. | 29,474 | 513.28 | 1,568 | 596.89 | ||||
| 2025-07-07 | 13F | Roxbury Financial LLC | 1,810 | -5.14 | 96 | 4.35 | ||||
| 2025-07-17 | 13F | Halbert Hargrove Global Advisors, Llc | 0 | -100.00 | 0 | |||||
| 2025-04-29 | 13F | Lee Danner & Bass Inc | 0 | -100.00 | 0 | -100.00 | ||||
| 2025-08-11 | 13F | Retirement Capital Strategies | 6,015 | 0.00 | 320 | 13.48 | ||||
| 2025-08-04 | 13F | Spire Wealth Management | 32,184 | 1.38 | 1,713 | 14.82 | ||||
| 2025-08-26 | NP | USAF - Atlas America Fund | 4,421 | 235 | ||||||
| 2025-08-13 | 13F | Scotia Capital Inc. | 135,726 | 2,704.84 | 7,222 | 3,081.06 | ||||
| 2025-07-21 | 13F | Ameritas Advisory Services, LLC | 753 | 40 | ||||||
| 2025-07-23 | 13F | Clear Creek Financial Management, LLC | 4,332 | 0.56 | 231 | 13.86 | ||||
| 2025-07-31 | 13F | City State Bank | 7,899 | -7.98 | 420 | 4.22 | ||||
| 2025-08-12 | 13F | Forum Private Client Group LLC | 4,504 | 0.00 | 240 | 13.27 | ||||
| 2025-05-19 | 13F | Heck Capital Advisors, LLC | 0 | -100.00 | 0 | -100.00 | ||||
| 2025-08-14 | 13F/A | Rockefeller Capital Management L.P. | 10,268 | 0.97 | 546 | 14.47 | ||||
| 2025-07-28 | 13F | Harbour Investments, Inc. | 2,065 | 30.45 | 110 | 47.30 | ||||
| 2025-08-04 | 13F | Creative Financial Designs Inc /adv | 251 | 0.40 | 13 | 18.18 | ||||
| 2025-07-07 | 13F | Centurion Wealth Management LLC | 88,568 | 22.26 | 4,713 | 33.33 | ||||
| 2025-08-14 | 13F | Jane Street Group, Llc | 0 | -100.00 | 0 | |||||
| 2025-07-28 | 13F | Moran Wealth Management, LLC | 11,011 | 84.53 | 586 | 108.93 | ||||
| 2025-08-11 | 13F | Private Advisor Group, LLC | 9,127 | 46.50 | 486 | 66.10 | ||||
| 2025-08-12 | 13F | CIBC Private Wealth Group, LLC | 12 | 1 | ||||||
| 2025-04-23 | 13F | Consolidated Portfolio Review Corp | 0 | -100.00 | 0 | |||||
| 2025-07-22 | 13F | Mascoma Wealth Management LLC | 830 | 0.00 | 44 | 15.79 | ||||
| 2025-08-14 | 13F | Federation des caisses Desjardins du Quebec | 3,438 | 2.50 | 183 | 15.92 | ||||
| 2025-08-14 | 13F | Ameriprise Financial Inc | 141,667 | 4.09 | 7,534 | 17.81 | ||||
| 2025-08-29 | 13F | Centaurus Financial, Inc. | 8,645 | -6.20 | 0 | |||||
| 2025-07-08 | 13F | Nbc Securities, Inc. | 309 | 0.00 | 0 | |||||
| 2025-08-14 | 13F | Royal Bank Of Canada | 127,180 | 14.52 | 6,768 | 29.70 | ||||
| 2025-08-05 | 13F | Mountain Hill Investment Partners Corp. | 0 | -100.00 | 0 | |||||
| 2025-07-17 | 13F | Fifth Third Securities, Inc. | 4,855 | 9.22 | 258 | 24.04 | ||||
| 2025-07-22 | 13F | Wealthcare Advisory Partners LLC | 29,430 | 48.66 | 1,566 | 68.28 | ||||
| 2025-08-13 | 13F | Brown Advisory Inc | 4,067 | 216 | ||||||
| 2025-08-14 | 13F | Citadel Advisors Llc | Put | 0 | -100.00 | 0 | ||||
| 2025-07-28 | 13F | BRYN MAWR TRUST Co | 150 | 0.00 | 8 | 0.00 | ||||
| 2025-08-11 | 13F | TD Waterhouse Canada Inc. | 85 | 4 | ||||||
| 2025-08-08 | 13F | POM Investment Strategies, LLC | 221 | 12 | ||||||
| 2025-07-22 | 13F | Penobscot Investment Management Company, Inc. | 9,508 | 0.00 | 506 | 13.23 | ||||
| 2025-08-13 | 13F | Mount Yale Investment Advisors, LLC | 70 | 4 | ||||||
| 2025-07-24 | 13F | IFP Advisors, Inc | 1,919 | -0.10 | 102 | 13.33 | ||||
| 2025-08-13 | 13F | Financial Freedom, LLC | 1,635 | 0.00 | 87 | 13.16 | ||||
| 2025-08-12 | 13F | Proequities, Inc. | 0 | 0 | ||||||
| 2025-07-09 | 13F | Triumph Capital Management | 0 | -100.00 | 0 | -100.00 | ||||
| 2025-07-25 | 13F | Ellis Investment Partners, LLC | 14,944 | 1.50 | 795 | 15.05 | ||||
| 2025-08-15 | 13F | Sugar Maple Asset Management, LLC | 6,043 | 322 | ||||||
| 2025-08-13 | 13F | Lido Advisors, LLC | 32,966 | -30.33 | 1,754 | -21.10 | ||||
| 2025-08-04 | 13F | Pensionmark Financial Group, Llc | 5,749 | 0.44 | 306 | 13.81 | ||||
| 2025-07-18 | 13F | Naples Global Advisors, Llc | 15,460 | 0.98 | 823 | 14.33 | ||||
| 2025-08-13 | 13F | Mackenzie Financial Corp | 5,750 | -6.35 | 306 | 5.90 | ||||
| 2025-08-13 | 13F | Flow Traders U.s. Llc | 5,082 | 0 | ||||||
| 2025-09-02 | 13F | Pvg Asset Management Corp | 7,804 | 415 | ||||||
| 2025-08-14 | 13F | Fmr Llc | 2,295 | -26.21 | 122 | -16.44 | ||||
| 2025-08-15 | 13F | Kestra Advisory Services, LLC | 14,496 | 135.17 | 771 | 166.78 | ||||
| 2025-08-05 | 13F | Simplex Trading, Llc | 270 | 0 | ||||||
| 2025-07-29 | 13F | Private Trust Co Na | 389 | 0.00 | 21 | 11.11 | ||||
| 2025-08-14 | 13F | Gould Capital, LLC | 129 | 2.38 | 7 | 20.00 | ||||
| 2025-08-27 | NP | HDCAX - Rational Equity Armor Fund Class A Shares | 7,816 | -9.94 | 416 | 1.97 | ||||
| 2025-08-14 | 13F | Goldman Sachs Group Inc | 55,144 | 4.93 | 2,934 | 18.88 | ||||
| 2025-08-06 | 13F | Mark Sheptoff Financial Planning, Llc | 28,041 | -1.23 | 1,492 | 11.93 | ||||
| 2025-08-04 | 13F | Assetmark, Inc | 39 | -29.09 | 2 | 0.00 | ||||
| 2025-08-14 | 13F | UBS Group AG | 305,246 | -4.52 | 16,242 | 8.14 | ||||
| 2025-07-16 | 13F | Rainier Family Wealth Inc | 17,896 | 952 | ||||||
| 2025-07-25 | 13F | LRI Investments, LLC | 3,900 | 0.00 | 208 | 13.11 | ||||
| 2025-07-09 | 13F | Krilogy Financial LLC | 33,169 | 7.51 | 1,765 | 21.74 | ||||
| 2025-08-06 | 13F | First Horizon Advisors, Inc. | 1,751 | -0.11 | 93 | 13.41 | ||||
| 2025-07-09 | 13F | Bank of New Hampshire | 200 | 0.00 | 11 | 11.11 | ||||
| 2025-08-14 | 13F | Arete Wealth Advisors, LLC | 0 | -100.00 | 0 | |||||
| 2025-08-19 | 13F | Anchor Investment Management, LLC | 1,970 | 6.78 | 105 | 20.93 | ||||
| 2025-08-15 | 13F | Northeast Financial Consultants Inc | 25,400 | 0.00 | 1,352 | 13.24 | ||||
| 2025-08-14 | 13F | Bnp Paribas | 10,387 | 6.46 | 553 | 20.52 | ||||
| 2025-04-30 | 13F | Phillips Financial Management, Llc | 0 | -100.00 | 0 | |||||
| 2025-08-08 | 13F | TD Capital Management LLC | 206 | 0.00 | 11 | 11.11 | ||||
| 2025-08-07 | 13F | Parkside Financial Bank & Trust | 8 | 0.00 | 0 | |||||
| 2025-08-13 | 13F | PineBridge Investments, L.P. | 18,120 | -14.03 | 964 | -2.63 | ||||
| 2025-08-14 | 13F | Wells Fargo & Company/mn | 1 | -99.88 | 0 | -100.00 | ||||
| 2025-07-29 | 13F | Koa Wealth Management, LLC | 26,804 | -1.17 | 1,426 | 11.93 | ||||
| 2025-07-23 | 13F | Nelson Capital Management, LLC | 89,866 | 2.12 | 4,782 | 15.65 | ||||
| 2025-08-04 | 13F | Integrity Alliance, Llc. | 4,330 | -3.78 | 230 | 9.00 | ||||
| 2025-07-10 | 13F | Wealth Enhancement Advisory Services, Llc | 8,763 | 25.19 | 471 | 43.60 | ||||
| 2025-05-08 | 13F | IFG Advisory, LLC | 0 | -100.00 | 0 | |||||
| 2025-08-14 | 13F | Riggs Asset Managment Co. Inc. | 756 | 0.00 | 40 | 14.29 | ||||
| 2025-07-21 | 13F | Future Financial Wealth Managment LLC | 100 | 0.00 | 5 | 25.00 | ||||
| 2025-08-18 | 13F | Geneos Wealth Management Inc. | 152 | 0.00 | 8 | 14.29 | ||||
| 2025-08-14 | 13F | Aprio Wealth Management, LLC | 52,309 | -25.87 | 2,783 | -16.05 | ||||
| 2025-08-12 | 13F | PSI Advisors, LLC | 0 | -100.00 | 0 | |||||
| 2025-08-14 | 13F | 10Elms LLP | 3,200 | 0.00 | 170 | 13.33 | ||||
| 2025-08-14 | 13F | Pecaut & Co. | 4,580 | -1.25 | 244 | 11.98 | ||||
| 2025-07-08 | 13F | Parallel Advisors, LLC | 77 | 2.67 | 4 | 33.33 | ||||
| 2025-05-27 | 13F | Advisors Capital Management, LLC | 0 | -100.00 | 0 | |||||
| 2025-08-06 | 13F | Commonwealth Equity Services, Llc | 87,372 | -6.28 | 5 | 0.00 | ||||
| 2025-08-05 | 13F | GPS Wealth Strategies Group, LLC | 4,926 | -0.30 | 262 | 12.93 | ||||
| 2025-07-15 | 13F | BostonPremier Wealth LLC | 4,370 | -93.86 | 233 | -93.06 | ||||
| 2025-07-18 | 13F | SOA Wealth Advisors, LLC. | 125 | 0.00 | 7 | 20.00 | ||||
| 2025-08-13 | 13F | Crescent Grove Advisors, LLC | 32,138 | 0.00 | 1,710 | 13.32 | ||||
| 2025-08-01 | 13F | Petra Financial Advisors Inc | 28,215 | 62.42 | 1,501 | 83.95 | ||||
| 2025-07-30 | 13F | Evermay Wealth Management Llc | 300 | 0.00 | 16 | 7.14 | ||||
| 2025-07-23 | 13F | 1 North Wealth Services Llc | 42,171 | 0.16 | 2,244 | 13.45 | ||||
| 2025-08-08 | 13F | Capital Investment Advisory Services, LLC | 200 | -76.19 | 11 | -74.36 | ||||
| 2025-08-14 | 13F | GWM Advisors LLC | 9,305 | 11.87 | 495 | 26.92 | ||||
| 2025-08-14 | 13F | Old Mission Capital Llc | 24,202 | -0.47 | 1,288 | 12.70 | ||||
| 2025-07-15 | 13F | North Star Investment Management Corp. | 1,120 | 1,020.00 | 60 | 1,375.00 | ||||
| 2025-07-18 | 13F | Truist Financial Corp | 14,073 | 9.64 | 749 | 24.05 | ||||
| 2025-08-12 | 13F | Wood Tarver Financial Group, LLC | 60 | 0.00 | 0 | -100.00 | ||||
| 2025-08-11 | 13F | Principal Securities, Inc. | 4,669 | -5.26 | 248 | 3.33 | ||||
| 2025-08-12 | 13F | Jpmorgan Chase & Co | 73 | 4.29 | 4 | 0.00 | ||||
| 2025-07-10 | 13F | Peoples Bank/KS | 0 | -100.00 | 0 | |||||
| 2025-08-14 | 13F | CoreCap Advisors, LLC | 47 | 0.00 | 3 | 0.00 | ||||
| 2025-05-15 | 13F | Hilltop Holdings Inc. | 0 | -100.00 | 0 | |||||
| 2025-08-14 | 13F | Bank Of America Corp /de/ | 1,831,781 | 0.74 | 97,469 | 14.10 | ||||
| 2025-07-22 | 13F | Valeo Financial Advisors, LLC | 3,928 | 209 | ||||||
| 2025-08-13 | 13F | Solutions 4 Wealth, Ltd | 21,932 | 0.00 | 1,167 | 13.30 | ||||
| 2025-08-13 | 13F | Jones Financial Companies Lllp | 60,471 | 32.69 | 3,163 | 45.58 |