Mga Batayang Estadistika
| Pemilik Institusional | 148 total, 148 long only, 0 short only, 0 long/short - change of 6.47% MRQ |
| Alokasi Portofolio Rata-rata | 0.1547 % - change of 11.35% MRQ |
| Saham Institusional (Jangka Panjang) | 8,012,319 (ex 13D/G) - change of -0.65MM shares -7.51% MRQ |
| Nilai Institusional (Jangka Panjang) | $ 365,520 USD ($1000) |
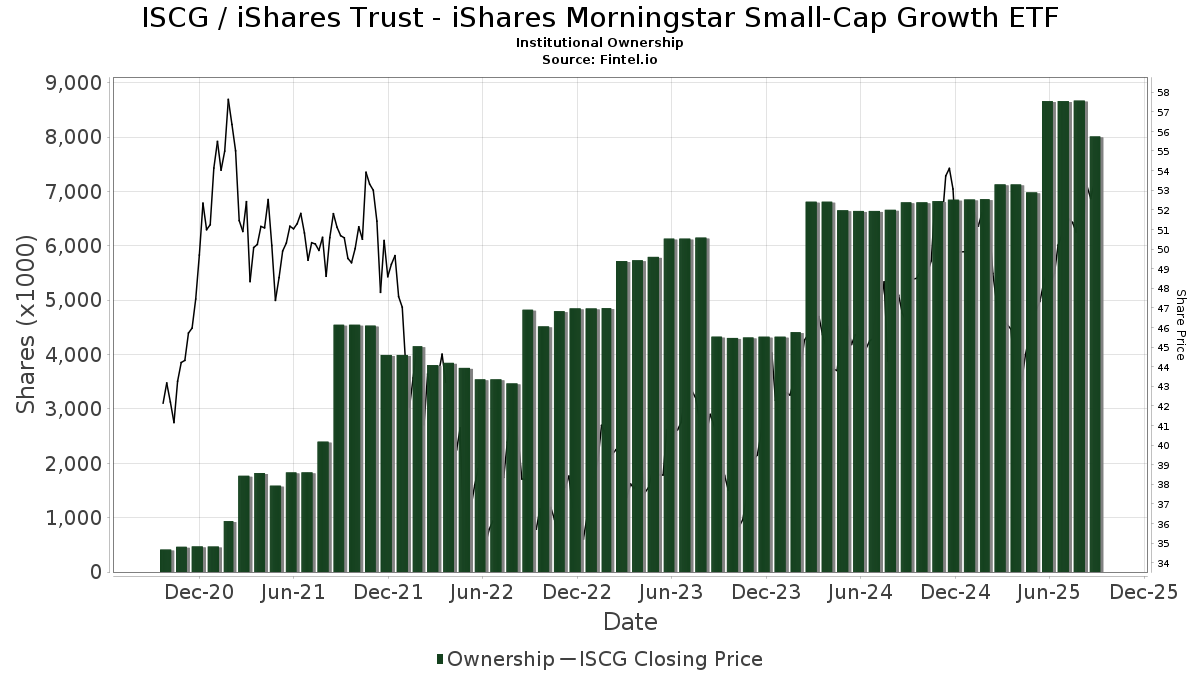
Kepemilikan Institusional dan Pemegang Saham
iShares Trust - iShares Morningstar Small-Cap Growth ETF (US:ISCG) memiliki 148 pemilik institusional dan pemegang saham yang telah mengajukan formulir 13D/G atau 13F kepada Komisi Bursa Efek (Securities Exchange Commission/SEC). Lembaga-lembaga ini memegang total 8,012,319 saham. Pemegang saham terbesar meliputi Colony Group, LLC, Jpmorgan Chase & Co, Northwestern Mutual Wealth Management Co, LPL Financial LLC, Avantax Advisory Services, Inc., Bank Of America Corp /de/, Rockport Wealth LLC, Gallagher Fiduciary Advisors, LLC, Atria Investments Llc, and Cwm, Llc .
Struktur kepemilikan institusional iShares Trust - iShares Morningstar Small-Cap Growth ETF (ARCA:ISCG) menunjukkan posisi terkini di perusahaan oleh institusi dan dana, serta perubahan terbaru dalam ukuran posisi. Pemegang saham utama dapat mencakup investor individu, reksa dana, dana lindung nilai, atau institusi. Jadwal 13D menunjukkan bahwa investor memegang (atau pernah memegang) lebih dari 5% saham perusahaan dan bermaksud (atau pernah bermaksud) untuk secara aktif mengejar perubahan strategi bisnis. Jadwal 13G menunjukkan investasi pasif lebih dari 5%.
The share price as of September 5, 2025 is 53.65 / share. Previously, on September 9, 2024, the share price was 46.05 / share. This represents an increase of 16.50% over that period.
Skor Sentimen Dana
Skor Sentimen Dana (sebelumnya dikenal sebagai Skor Akumulasi Kepemilikan) menemukan saham-saham yang paling banyak dibeli oleh dana. Ini adalah hasil dari model kuantitatif multi-faktor yang canggih yang mengidentifikasi perusahaan dengan tingkat akumulasi institusional tertinggi. Model penilaian menggunakan kombinasi dari total peningkatan pemilik yang diungkapkan, perubahan dalam alokasi portofolio pada pemilik tersebut, dan metrik lainnya. Angka berkisar dari 0 hingga 100, dengan angka yang lebih tinggi menunjukkan tingkat akumulasi yang lebih tinggi dibandingkan dengan perusahaan sejenisnya, dan 50 adalah rata-ratanya.
Frekuensi Pembaruan: Setiap Hari
Lihat Ownership Explorer, yang menyediakan daftar perusahaan dengan peringkat tertinggi.
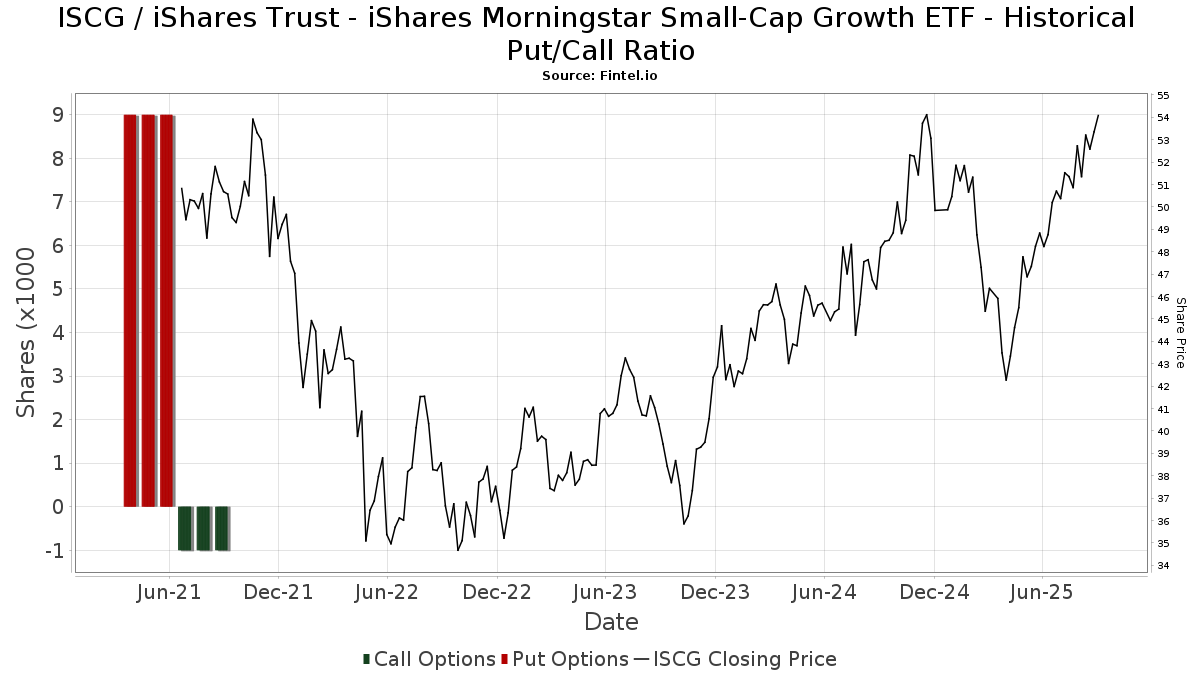
Rasio Put/Call Institusional
Selain melaporkan isu ekuitas dan utang standar, institusi dengan aset di bawah manajemen lebih dari 100 juta dolar AS juga harus mengungkapkan kepemilikan opsi put dan call mereka. Karena opsi put umumnya menunjukkan sentimen negatif, dan opsi call menunjukkan sentimen positif, kita dapat mengetahui sentimen institusional secara keseluruhan dengan memplot rasio put terhadap call. Grafik di sebelah kanan memplot rasio put/call historis untuk instrumen ini.
Menggunakan Rasio Put/Call sebagai indikator sentimen investor mengatasi salah satu kekurangan utama dari penggunaan total kepemilikan institusional, yaitu sejumlah besar aset yang dikelola diinvestasikan secara pasif untuk melacak indeks. Dana yang dikelola secara pasif biasanya tidak membeli opsi, sehingga indikator rasio put/call lebih akurat dalam melacak sentimen dana yang dikelola secara aktif.
Pengajuan 13F dan NPORT
Detail pada pengajuan 13F tersedia gratis. Detail pada pengajuan NP memerlukan keanggotaan premium. Baris berwarna hijau menunjukkan posisi baru. Baris berwarna merah menunjukkan posisi yang sudah ditutup. Klik tautan ini ikon untuk melihat riwayat transaksi selengkapnya.
Tingkatkan
untuk membuka data premium dan mengekspor ke Excel ![]() .
.
| Tanggal File | Sumber | Investor | Ketik | Presyo ng Avg (Silangan) |
Saham | Δ Saham (%) |
Dilaporkan Nilai ($1000) |
Nilai Δ (%) |
Alokasi Port (%) |
|
|---|---|---|---|---|---|---|---|---|---|---|
| 2025-07-15 | 13F | North Star Investment Management Corp. | 234 | 0.43 | 12 | 10.00 | ||||
| 2025-07-15 | 13F | Td Private Client Wealth Llc | 4,157 | -40.78 | 207 | -34.81 | ||||
| 2025-07-09 | 13F | Breakwater Capital Group | 7,210 | -11.99 | 359 | -2.98 | ||||
| 2025-07-07 | 13F | Nova Wealth Management, Inc. | 0 | -100.00 | 0 | |||||
| 2025-07-22 | 13F | VAUGHAN & Co SECURITIES, INC. | 24,995 | 0.00 | 1,244 | 10.39 | ||||
| 2025-08-11 | 13F | Citigroup Inc | 5,021 | -3.42 | 250 | 6.41 | ||||
| 2025-08-12 | 13F | PSI Advisors, LLC | 0 | -100.00 | 0 | |||||
| 2025-08-14 | 13F | Bank Of America Corp /de/ | 344,809 | -7.17 | 17,158 | 2.53 | ||||
| 2025-08-08 | 13F | Cetera Investment Advisers | 41,695 | 32.36 | 2,075 | 46.16 | ||||
| 2025-08-11 | 13F | Synergy Investment Management, LLC | 0 | -100.00 | 0 | |||||
| 2025-08-15 | 13F | Synergy Financial Group, LTD | 7,192 | 0.00 | 358 | 10.19 | ||||
| 2025-08-12 | 13F | LPL Financial LLC | 434,903 | 9.60 | 21,641 | 21.06 | ||||
| 2025-08-11 | 13F | Principal Securities, Inc. | 10,256 | 14.94 | 510 | 15.65 | ||||
| 2025-08-05 | 13F | BEAM Asset Management, LLC | 59,549 | 63.15 | 2,963 | 80.23 | ||||
| 2025-07-21 | 13F | Ameritas Advisory Services, LLC | 293 | 15 | ||||||
| 2025-07-14 | 13F | Signature Securities Group Corporation | 4,719 | 0.11 | 235 | 10.38 | ||||
| 2025-07-31 | 13F | Cambridge Investment Research Advisors, Inc. | 11,149 | -2.28 | 1 | |||||
| 2025-08-13 | 13F | Russell Investments Group, Ltd. | 56 | 3 | ||||||
| 2025-08-14 | 13F | Royal Bank Of Canada | 43,364 | -0.29 | 2,158 | 10.10 | ||||
| 2025-08-15 | 13F | Equitable Holdings, Inc. | 8,830 | 35.24 | 439 | 49.32 | ||||
| 2025-08-14 | 13F | UBS Group AG | 106,795 | 3.67 | 5,314 | 14.53 | ||||
| 2025-07-28 | 13F | Copia Wealth Management | 25 | 0.00 | 1 | 0.00 | ||||
| 2025-08-14 | 13F | MGB Wealth Management, LLC | 200 | 0.00 | 10 | 0.00 | ||||
| 2025-07-24 | 13F | Gilliland Jeter Wealth Management LLC | 10,971 | 8.62 | 546 | 20.04 | ||||
| 2025-08-04 | 13F | Creative Financial Designs Inc /adv | 8,952 | -65.62 | 445 | -62.06 | ||||
| 2025-08-13 | 13F | Twin Peaks Wealth Advisors, LLC | 760 | 39 | ||||||
| 2025-07-24 | 13F | IFP Advisors, Inc | 569 | 0.00 | 28 | 12.00 | ||||
| 2025-08-13 | 13F | Jones Financial Companies Lllp | 6,822 | 42.10 | 338 | 56.48 | ||||
| 2025-07-08 | 13F | Lowe Wealth Advisors, LLC | 210 | 0.00 | 10 | 11.11 | ||||
| 2025-07-30 | 13F | Black Diamond Financial, LLC | 106,873 | -25.44 | 5,318 | -17.64 | ||||
| 2025-04-22 | 13F | Veridan Wealth LLC | 29,689 | 11.40 | 1,337 | -1.40 | ||||
| 2025-08-14 | 13F | Monograph Wealth Advisors, Llc | 4,122 | 205 | ||||||
| 2025-04-22 | 13F | Ellis Investment Partners, LLC | 0 | -100.00 | 0 | |||||
| 2025-08-04 | 13F | Jim Saulnier & Associates, Llc | 4,509 | -15.97 | 224 | -7.05 | ||||
| 2025-08-11 | 13F | HighTower Advisors, LLC | 66,711 | 49.97 | 3,320 | 65.70 | ||||
| 2025-07-30 | 13F | TFB Advisors LLC | 4,766 | -1.12 | 237 | 9.22 | ||||
| 2025-08-12 | 13F | Laurel Wealth Advisors LLC | 70,162 | 4,876.03 | 1 | -98.41 | ||||
| 2025-08-14 | 13F | Financial Engines Advisors L.L.C. | 9,897 | 492 | ||||||
| 2025-08-13 | 13F | Northern Trust Corp | 10,486 | -0.12 | 522 | 10.38 | ||||
| 2025-08-04 | 13F | Spire Wealth Management | 384 | 19 | ||||||
| 2025-08-01 | 13F | Gwn Securities Inc. | 7,618 | 21.00 | 379 | 33.92 | ||||
| 2025-07-11 | 13F | Farther Finance Advisors, LLC | 37,718 | 667.25 | 1,877 | 748.87 | ||||
| 2025-08-19 | 13F | Cape Investment Advisory, Inc. | 2,925 | 0.03 | 146 | 10.69 | ||||
| 2025-07-09 | 13F | Towerpoint Wealth, LLC | 4,374 | 218 | ||||||
| 2025-08-04 | 13F | Flagship Harbor Advisors, Llc | 0 | -100.00 | 0 | |||||
| 2025-08-04 | 13F | Adell Harriman & Carpenter Inc | 8,796 | 0.00 | 438 | 10.35 | ||||
| 2025-07-30 | 13F | D.a. Davidson & Co. | 4,525 | 225 | ||||||
| 2025-08-05 | 13F | Key FInancial Inc | 24,203 | 33.84 | 1,204 | 47.91 | ||||
| 2025-07-16 | 13F | Kendall Capital Management | 23,500 | 1,169 | ||||||
| 2025-08-05 | 13F | Huntington National Bank | 31 | 3,000.00 | 2 | |||||
| 2025-07-17 | 13F | Fifth Third Securities, Inc. | 10,068 | 501 | ||||||
| 2025-08-13 | 13F | Congress Wealth Management LLC / DE / | 0 | -100.00 | 0 | |||||
| 2025-08-13 | 13F | Level Four Advisory Services, Llc | 47,416 | 0.00 | 2,359 | 10.44 | ||||
| 2025-08-14 | 13F | Colony Group, LLC | 1,001,405 | -45.08 | 49,830 | -39.34 | ||||
| 2025-08-08 | 13F | Tortoise Investment Management, LLC | 2,922 | 0.00 | 145 | 10.69 | ||||
| 2025-08-14 | 13F | Raymond James Financial Inc | 117,644 | 0.37 | 5,854 | 10.85 | ||||
| 2025-07-22 | 13F | Wealthcare Advisory Partners LLC | 4,837 | 241 | ||||||
| 2025-07-25 | 13F | Courage Miller Partners, LLC | 13,746 | -3.30 | 684 | 6.88 | ||||
| 2025-08-08 | 13F | Pnc Financial Services Group, Inc. | 0 | -100.00 | 0 | |||||
| 2025-08-12 | 13F | NorthStar Asset Management LLC /NJ/ | 91,296 | 5.33 | 4,543 | 16.34 | ||||
| 2025-08-06 | 13F | Commonwealth Equity Services, Llc | 83,468 | -0.27 | 4 | 33.33 | ||||
| 2025-07-14 | 13F | Opal Wealth Advisors, LLC | 3,146 | 0.00 | 157 | 10.64 | ||||
| 2025-07-25 | 13F | Cwm, Llc | 264,481 | -9.62 | 13 | 0.00 | ||||
| 2025-08-15 | 13F | Asset Allocation Strategies LLC | 13,143 | -13.21 | 654 | -4.11 | ||||
| 2025-08-12 | 13F | Jpmorgan Chase & Co | 948,308 | -10.69 | 47,188 | -1.36 | ||||
| 2025-08-13 | 13F | Rockport Wealth LLC | 324,071 | 16,126 | ||||||
| 2025-07-14 | 13F | UMA Financial Services, Inc. | 1,063 | 0.00 | 53 | 10.64 | ||||
| 2025-08-12 | 13F | Manchester Capital Management LLC | 390 | 0.00 | 19 | 11.76 | ||||
| 2025-07-17 | 13F | Gleason Group, Inc. | 127 | 0.00 | 6 | 20.00 | ||||
| 2025-07-31 | 13F | Whipplewood Advisors, LLC | 3,300 | 2,207.69 | 164 | 10.81 | ||||
| 2025-08-05 | 13F | Cherry Tree Wealth Management, LLC | 76 | 0.00 | 4 | 0.00 | ||||
| 2025-08-13 | 13F | Lido Advisors, LLC | 11,074 | 0.16 | 551 | 10.64 | ||||
| 2025-07-29 | 13F | Private Trust Co Na | 2,771 | 5.76 | 138 | 16.10 | ||||
| 2025-08-14 | 13F | Fmr Llc | 7,967 | -6.30 | 396 | 3.39 | ||||
| 2025-07-10 | 13F | Wealth Enhancement Advisory Services, Llc | 5,888 | 298 | ||||||
| 2025-08-19 | 13F | National Asset Management, Inc. | 0 | -100.00 | 0 | |||||
| 2025-08-14 | 13F | Benjamin Edwards Inc | 4,808 | 0.00 | 239 | 10.65 | ||||
| 2025-08-14 | 13F | CoreCap Advisors, LLC | 1,762 | 88 | ||||||
| 2025-09-04 | 13F/A | Advisor Group Holdings, Inc. | 63,523 | -36.81 | 3,156 | -30.30 | ||||
| 2025-07-16 | 13F | Legend Financial Advisors, Inc. | 135 | 7 | ||||||
| 2025-08-14 | 13F | Smartleaf Asset Management LLC | 2,704 | 13.95 | 134 | 25.23 | ||||
| 2025-08-14 | 13F | Comerica Bank | 5,075 | 0.00 | 253 | 10.53 | ||||
| 2025-08-18 | 13F | Geneos Wealth Management Inc. | 2,421 | 2.85 | 120 | 13.21 | ||||
| 2025-07-31 | 13F | Opes Wealth Management LLC | 127,069 | 7.50 | 6,323 | 18.75 | ||||
| 2025-08-08 | 13F | Creative Planning | 28,341 | 28.79 | 1,410 | 42.28 | ||||
| 2025-08-13 | 13F | IAG Wealth Partners, LLC | 69,317 | -7.46 | 3,449 | 2.22 | ||||
| 2025-07-14 | 13F | Matrix Trust Co | 167,423 | 1.28 | 8 | 14.29 | ||||
| 2025-08-06 | 13F | Savant Capital, LLC | 5,506 | 0.04 | 274 | 10.53 | ||||
| 2025-08-14 | 13F | Goldman Sachs Group Inc | 36,161 | 2.15 | 1,799 | 12.86 | ||||
| 2025-07-29 | 13F | Rodgers & Associates, LTD | 31,858 | 1.82 | 1,585 | 12.49 | ||||
| 2025-07-11 | 13F | SILVER OAK SECURITIES, Inc | 5,382 | 0.15 | 268 | 10.33 | ||||
| 2025-07-10 | 13F | Tompkins Financial Corp | 1,944 | 0.00 | 97 | 10.34 | ||||
| 2025-07-25 | 13F | Atria Wealth Solutions, Inc. | 13,690 | 106.27 | 686 | 130.20 | ||||
| 2025-07-28 | 13F | Harbour Investments, Inc. | 950 | -74.85 | 47 | -72.35 | ||||
| 2025-07-15 | 13F | MCF Advisors LLC | 343 | 0.00 | 17 | 13.33 | ||||
| 2025-07-29 | 13F | Madison Wealth Partners, Inc | 7,368 | 3.24 | 367 | 14.02 | ||||
| 2025-08-12 | 13F | MAI Capital Management | 450 | 0.00 | 22 | 10.00 | ||||
| 2025-08-14 | 13F | Mml Investors Services, Llc | 65,462 | -18.92 | 3 | 0.00 | ||||
| 2025-07-07 | 13F | Investors Research Corp | 72 | 0.00 | 4 | 0.00 | ||||
| 2025-07-22 | 13F | Merit Financial Group, LLC | 4,838 | -2.04 | 241 | 8.11 | ||||
| 2025-07-14 | 13F | AdvisorNet Financial, Inc | 3,709 | -4.26 | 185 | 5.75 | ||||
| 2025-08-12 | 13F | SRS Capital Advisors, Inc. | 1,985 | 99 | ||||||
| 2025-07-17 | 13F | Montis Financial, LLC | 0 | -100.00 | 0 | |||||
| 2025-08-06 | 13F | Prospera Financial Services Inc | 4,318 | 215 | ||||||
| 2025-07-29 | 13F | Creekside Partners | 20,230 | 0.12 | 1,007 | 10.55 | ||||
| 2025-08-11 | 13F | Ritter Daniher Financial Advisory LLC / DE | 4,277 | 40.05 | 213 | 54.74 | ||||
| 2025-07-03 | 13F | City Center Advisors, LLC | 0 | -100.00 | 0 | |||||
| 2025-08-11 | 13F | Strategic Wealth Partners, Ltd. | 2,004 | 100 | ||||||
| 2025-04-14 | 13F | Park Avenue Securities Llc | 0 | -100.00 | 0 | |||||
| 2025-08-12 | 13F | Change Path, LLC | 14,666 | 6.45 | 730 | 17.58 | ||||
| 2025-08-14 | 13F | CIBC World Markets Inc. | 7,942 | 0.00 | 395 | 10.64 | ||||
| 2025-08-11 | 13F | Perennial Investment Advisors, LLC | 30,280 | 33.39 | 1,507 | 47.36 | ||||
| 2025-08-12 | 13F | O'shaughnessy Asset Management, Llc | 1,291 | -37.84 | 64 | -31.18 | ||||
| 2025-08-14 | 13F | Visionary Wealth Advisors | 9,877 | 82.10 | 491 | 101.23 | ||||
| 2025-08-13 | 13F | Crescent Grove Advisors, LLC | 14,337 | 0.00 | 713 | 10.54 | ||||
| 2025-08-14 | 13F | Qube Research & Technologies Ltd | 361 | 38.31 | 18 | 54.55 | ||||
| 2025-08-11 | 13F | WPG Advisers, LLC | 112 | 0.00 | 6 | 0.00 | ||||
| 2025-07-17 | 13F | Nelson, Van Denburg & Campbell Wealth Management Group, LLC | 9,617 | -6.07 | 479 | 3.69 | ||||
| 2025-07-25 | 13F | Concord Wealth Partners | 112 | 6 | ||||||
| 2025-08-12 | 13F | Archer Investment Corp | 1,516 | 0.00 | 75 | 10.29 | ||||
| 2025-08-13 | 13F | Northwestern Mutual Wealth Management Co | 490,694 | 5.45 | 24,417 | 16.47 | ||||
| 2025-08-12 | 13F | Proequities, Inc. | 0 | 0 | ||||||
| 2025-07-15 | 13F | Mather Group, Llc. | 0 | -100.00 | 0 | |||||
| 2025-07-22 | 13F | Steele Capital Management, Inc. | 167,423 | 1.28 | 8,331 | 11.87 | ||||
| 2025-08-08 | 13F | Avantax Advisory Services, Inc. | 378,433 | -5.15 | 18,831 | 4.77 | ||||
| 2025-08-08 | 13F | Phoenix Wealth Advisors | 20,210 | -23.35 | 1,006 | -15.33 | ||||
| 2025-08-14 | 13F | Certified Advisory Corp | 73,332 | 0.40 | 3,649 | 10.88 | ||||
| 2025-08-14 | 13F | GWM Advisors LLC | 15,583 | -16.74 | 775 | -8.07 | ||||
| 2025-08-15 | 13F | CI Private Wealth, LLC | 12,307 | 0.00 | 612 | 10.47 | ||||
| 2025-08-13 | 13F | Flow Traders U.s. Llc | 0 | -100.00 | 0 | |||||
| 2025-08-15 | 13F | Kestra Advisory Services, LLC | 7,931 | -1.88 | 395 | 8.24 | ||||
| 2025-08-14 | 13F | Jane Street Group, Llc | 12,161 | -68.26 | 605 | -64.93 | ||||
| 2025-08-12 | 13F | Steward Partners Investment Advisory, Llc | 4,684 | 84.34 | 233 | 104.39 | ||||
| 2025-08-14 | 13F | Gallagher Fiduciary Advisors, LLC | 299,710 | 4.88 | 14,914 | 15.85 | ||||
| 2025-08-14 | 13F | Citadel Advisors Llc | 18,582 | -53.57 | 925 | -48.72 | ||||
| 2025-08-12 | 13F | Pathstone Holdings, LLC | 38,863 | 88.55 | 1,934 | 108.30 | ||||
| 2025-08-13 | 13F/A | StoneX Group Inc. | 0 | -100.00 | 0 | |||||
| 2025-07-24 | 13F | Blair William & Co/il | 1,062 | 0.00 | 53 | 10.64 | ||||
| 2025-08-14 | 13F | Ameriprise Financial Inc | 107,967 | -1.98 | 5,373 | 8.15 | ||||
| 2025-08-14 | 13F | Mariner, LLC | 66,332 | 18.19 | 3,301 | 30.54 | ||||
| 2025-05-15 | 13F | Advisory Services Network, LLC | 0 | -100.00 | 0 | |||||
| 2025-07-21 | 13F | Ameriflex Group, Inc. | 50 | 0.00 | 2 | 0.00 | ||||
| 2025-08-04 | 13F | Assetmark, Inc | 899 | 121.43 | 45 | 144.44 | ||||
| 2025-08-15 | 13F | Captrust Financial Advisors | 5,649 | 0.00 | 281 | 10.63 | ||||
| 2025-07-02 | 13F | Central Pacific Bank - Trust Division | 48 | 0.00 | 2 | 0.00 | ||||
| 2025-08-01 | 13F | Envestnet Asset Management Inc | 21,270 | -10.87 | 1,058 | -1.58 | ||||
| 2025-05-15 | 13F | CAPROCK Group, Inc. | 5,742 | 259 | ||||||
| 2025-08-15 | 13F | Morgan Stanley | 253,968 | -28.07 | 12,637 | -20.55 | ||||
| 2025-08-13 | 13F | Millstone Evans Group, LLC | 442 | -41.07 | 22 | -36.36 | ||||
| 2025-07-08 | 13F | Nbc Securities, Inc. | 337 | -7.92 | 0 | |||||
| 2025-07-17 | 13F | Smith Chas P & Associates Pa Cpas | 5,029 | -45.06 | 250 | -39.32 | ||||
| 2025-07-22 | 13F | DAVENPORT & Co LLC | 6,200 | 0.00 | 309 | 10.39 | ||||
| 2025-08-06 | 13F | Ipsen Advisor Group LLC | 112,232 | 3.06 | 5,585 | 13.84 | ||||
| 2025-08-11 | 13F | Private Advisor Group, LLC | 11,175 | -48.36 | 556 | -42.92 | ||||
| 2025-08-14 | 13F | Stifel Financial Corp | 0 | -100.00 | 0 | |||||
| 2025-08-14 | 13F | Ieq Capital, Llc | 32,241 | 0.00 | 1,604 | 10.47 | ||||
| 2025-08-14 | 13F | Wells Fargo & Company/mn | 151,370 | 7.32 | 7,532 | 18.56 | ||||
| 2025-07-25 | 13F | LRI Investments, LLC | 46,497 | 0.00 | 2,314 | 10.46 | ||||
| 2025-08-14 | 13F | Susquehanna International Group, Llp | 12,568 | -51.61 | 625 | -46.58 | ||||
| 2025-04-23 | 13F | Valmark Advisers, Inc. | 0 | -100.00 | 0 | |||||
| 2025-07-11 | 13F | Shelton Wealth Management, Llc | 21,698 | -0.82 | 1,080 | 9.54 | ||||
| 2025-08-04 | 13F | Atria Investments Llc | 295,476 | 4.35 | 14,703 | 15.26 | ||||
| 2025-08-12 | 13F | AlphaCore Capital LLC | 20 | 1 | ||||||
| 2025-07-24 | 13F | rebel Financial LLC | 6,683 | 333 | ||||||
| 2025-04-24 | 13F | Tsfg, Llc | 0 | -100.00 | 0 | |||||
| 2025-08-05 | 13F | Integrity Financial Corp /WA | 76 | 0.00 | 4 | 0.00 | ||||
| 2025-08-12 | 13F | Global Retirement Partners, LLC | 10,507 | -14.81 | 523 | -14.29 |