Mga Batayang Estadistika
| Pemilik Institusional | 185 total, 185 long only, 0 short only, 0 long/short - change of 0.00% MRQ |
| Alokasi Portofolio Rata-rata | 0.0368 % - change of -17.71% MRQ |
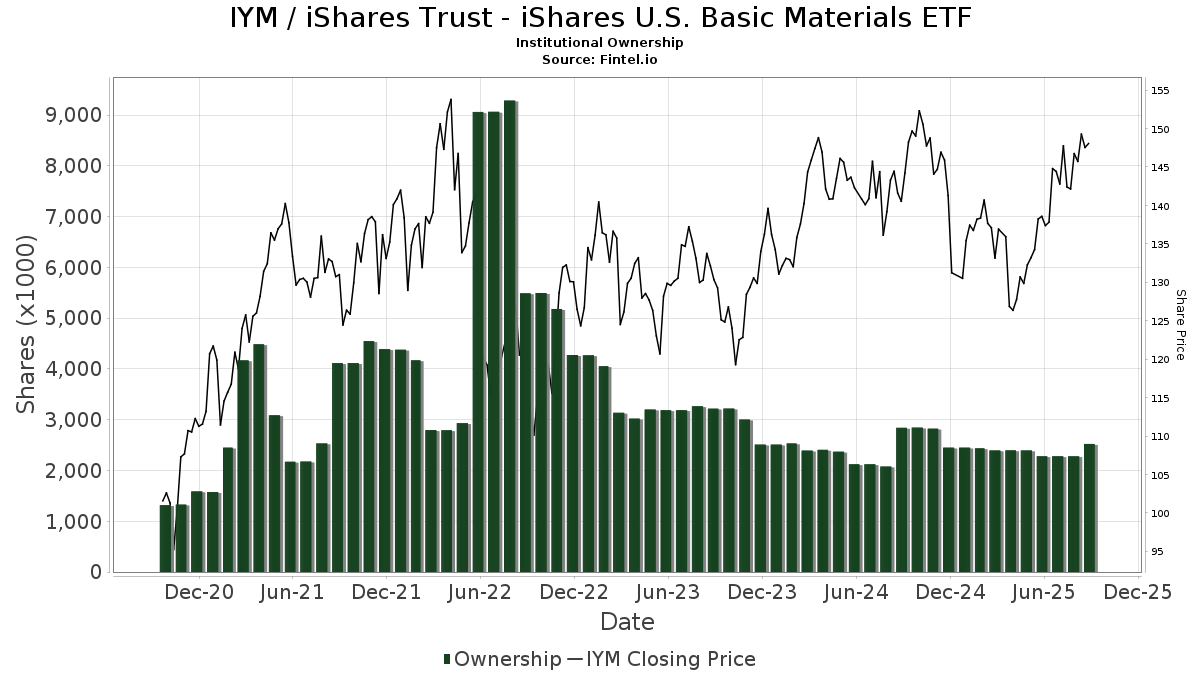
| Saham Institusional (Jangka Panjang) | 2,523,883 (ex 13D/G) - change of 0.24MM shares 10.64% MRQ |
| Nilai Institusional (Jangka Panjang) | $ 341,054 USD ($1000) |
Kepemilikan Institusional dan Pemegang Saham
iShares Trust - iShares U.S. Basic Materials ETF (US:IYM) memiliki 185 pemilik institusional dan pemegang saham yang telah mengajukan formulir 13D/G atau 13F kepada Komisi Bursa Efek (Securities Exchange Commission/SEC). Lembaga-lembaga ini memegang total 2,523,883 saham. Pemegang saham terbesar meliputi Citigroup Inc, Manufacturers Life Insurance Company, The, Green Harvest Asset Management LLC, Morgan Stanley, Bank Of America Corp /de/, Commerce Bank, LPL Financial LLC, UBS Group AG, Wells Fargo & Company/mn, and Northwestern Mutual Wealth Management Co .
Struktur kepemilikan institusional iShares Trust - iShares U.S. Basic Materials ETF (ARCA:IYM) menunjukkan posisi terkini di perusahaan oleh institusi dan dana, serta perubahan terbaru dalam ukuran posisi. Pemegang saham utama dapat mencakup investor individu, reksa dana, dana lindung nilai, atau institusi. Jadwal 13D menunjukkan bahwa investor memegang (atau pernah memegang) lebih dari 5% saham perusahaan dan bermaksud (atau pernah bermaksud) untuk secara aktif mengejar perubahan strategi bisnis. Jadwal 13G menunjukkan investasi pasif lebih dari 5%.
The share price as of September 5, 2025 is 148.69 / share. Previously, on September 6, 2024, the share price was 138.23 / share. This represents an increase of 7.56% over that period.
Skor Sentimen Dana
Skor Sentimen Dana (sebelumnya dikenal sebagai Skor Akumulasi Kepemilikan) menemukan saham-saham yang paling banyak dibeli oleh dana. Ini adalah hasil dari model kuantitatif multi-faktor yang canggih yang mengidentifikasi perusahaan dengan tingkat akumulasi institusional tertinggi. Model penilaian menggunakan kombinasi dari total peningkatan pemilik yang diungkapkan, perubahan dalam alokasi portofolio pada pemilik tersebut, dan metrik lainnya. Angka berkisar dari 0 hingga 100, dengan angka yang lebih tinggi menunjukkan tingkat akumulasi yang lebih tinggi dibandingkan dengan perusahaan sejenisnya, dan 50 adalah rata-ratanya.
Frekuensi Pembaruan: Setiap Hari
Lihat Ownership Explorer, yang menyediakan daftar perusahaan dengan peringkat tertinggi.
Rasio Put/Call Institusional
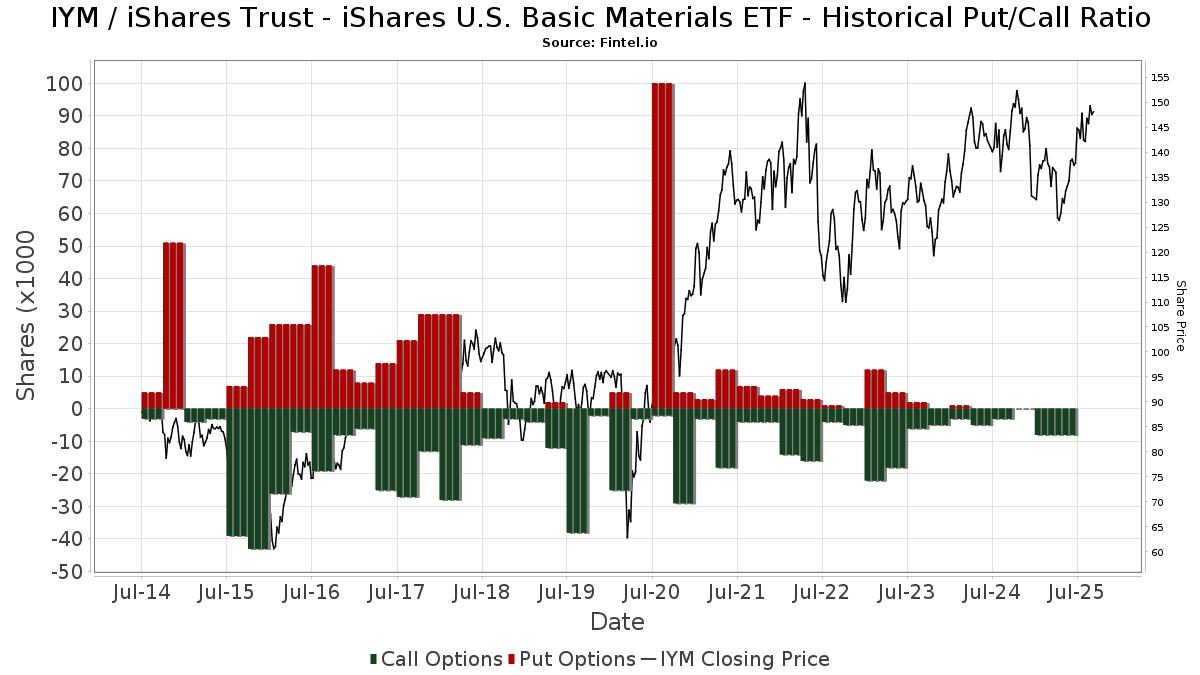
Selain melaporkan isu ekuitas dan utang standar, institusi dengan aset di bawah manajemen lebih dari 100 juta dolar AS juga harus mengungkapkan kepemilikan opsi put dan call mereka. Karena opsi put umumnya menunjukkan sentimen negatif, dan opsi call menunjukkan sentimen positif, kita dapat mengetahui sentimen institusional secara keseluruhan dengan memplot rasio put terhadap call. Grafik di sebelah kanan memplot rasio put/call historis untuk instrumen ini.
Menggunakan Rasio Put/Call sebagai indikator sentimen investor mengatasi salah satu kekurangan utama dari penggunaan total kepemilikan institusional, yaitu sejumlah besar aset yang dikelola diinvestasikan secara pasif untuk melacak indeks. Dana yang dikelola secara pasif biasanya tidak membeli opsi, sehingga indikator rasio put/call lebih akurat dalam melacak sentimen dana yang dikelola secara aktif.
Pengajuan 13F dan NPORT
Detail pada pengajuan 13F tersedia gratis. Detail pada pengajuan NP memerlukan keanggotaan premium. Baris berwarna hijau menunjukkan posisi baru. Baris berwarna merah menunjukkan posisi yang sudah ditutup. Klik tautan ini ikon untuk melihat riwayat transaksi selengkapnya.
Tingkatkan
untuk membuka data premium dan mengekspor ke Excel ![]() .
.
| Tanggal File | Sumber | Investor | Ketik | Presyo ng Avg (Silangan) |
Saham | Δ Saham (%) |
Dilaporkan Nilai ($1000) |
Nilai Δ (%) |
Alokasi Port (%) |
|
|---|---|---|---|---|---|---|---|---|---|---|
| 2025-04-21 | 13F | Beacon Capital Management, LLC | 0 | -100.00 | 0 | |||||
| 2025-08-04 | 13F | Creative Financial Designs Inc /adv | 0 | -100.00 | 0 | |||||
| 2025-08-06 | 13F | Simmons Bank | 4,108 | -2.72 | 575 | 1.05 | ||||
| 2025-07-21 | 13F | HighMark Wealth Management LLC | 6 | 0.00 | 1 | |||||
| 2025-07-16 | 13F | American National Bank | 617 | 0.00 | 86 | 3.61 | ||||
| 2025-07-22 | 13F | Miracle Mile Advisors, LLC | 11,683 | 1,636 | ||||||
| 2025-08-14 | 13F | Citadel Advisors Llc | Call | 3,100 | 6.90 | 434 | 11.28 | |||
| 2025-07-29 | 13F | BKD Wealth Advisors, LLC | 3,878 | -0.77 | 543 | 3.04 | ||||
| 2025-08-05 | 13F | Counterweight Ventures, LLC | 3,857 | -0.44 | 540 | 3.45 | ||||
| 2025-08-14 | 13F | Citadel Advisors Llc | 37,185 | 17.39 | 5,206 | 21.92 | ||||
| 2025-07-25 | 13F | Sequoia Financial Advisors, LLC | 1,705 | -17.63 | 239 | -14.70 | ||||
| 2025-08-14 | 13F | Stifel Financial Corp | 2,773 | 11.63 | 388 | 16.17 | ||||
| 2025-07-28 | 13F | Essex LLC | 3,619 | 3.52 | 507 | 7.43 | ||||
| 2025-07-23 | 13F | Sachetta, LLC | 4,910 | -77.48 | 687 | -76.62 | ||||
| 2025-08-14 | 13F | Synovus Financial Corp | 1,455 | -18.72 | 204 | -15.77 | ||||
| 2025-05-09 | 13F | Fairfield Financial Advisors, LTD | 0 | -100.00 | 0 | |||||
| 2025-05-13 | 13F | Northern Trust Corp | 0 | -100.00 | 0 | |||||
| 2025-05-13 | 13F | Tocqueville Asset Management L.p. | 0 | -100.00 | 0 | |||||
| 2025-07-31 | 13F | Cambridge Investment Research Advisors, Inc. | 3,147 | -17.68 | 0 | |||||
| 2025-08-11 | 13F | Private Advisor Group, LLC | 2,593 | -1.74 | 363 | 2.25 | ||||
| 2025-07-16 | 13F | Magnus Financial Group LLC | 1,944 | 4.07 | 272 | 8.37 | ||||
| 2025-08-14 | 13F | Ameriprise Financial Inc | 5,325 | 0.72 | 746 | 4.63 | ||||
| 2025-07-01 | 13F | Harbor Investment Advisory, Llc | 100 | 0.00 | 14 | 7.69 | ||||
| 2025-08-13 | 13F | Beacon Pointe Advisors, LLC | 2,220 | 0.09 | 311 | 4.03 | ||||
| 2025-08-14 | 13F | Mml Investors Services, Llc | 20,500 | 4.72 | 3 | 0.00 | ||||
| 2025-08-15 | 13F | Kestra Advisory Services, LLC | 3,918 | -0.38 | 549 | 3.40 | ||||
| 2025-08-14 | 13F | GWM Advisors LLC | 159 | 0.00 | 22 | 4.76 | ||||
| 2025-07-11 | 13F | Wealth Management Partners, LLC | 2,450 | -4.26 | 351 | 2.03 | ||||
| 2025-08-05 | 13F | Westside Investment Management, Inc. | 160 | 0.00 | 22 | 4.76 | ||||
| 2025-07-10 | 13F | Wealth Enhancement Advisory Services, Llc | 3,818 | 5.41 | 552 | 13.11 | ||||
| 2025-08-12 | 13F | Ameritas Investment Partners, Inc. | 30 | 0.00 | 4 | 0.00 | ||||
| 2025-08-12 | 13F | Franklin Resources Inc | 4,770 | 0.00 | 668 | 3.89 | ||||
| 2025-08-13 | 13F | Russell Investments Group, Ltd. | 27 | 0.00 | 4 | 0.00 | ||||
| 2025-07-24 | 13F | Us Bancorp \de\ | 1,199 | -7.70 | 168 | -4.57 | ||||
| 2025-05-13 | 13F | Bokf, Na | 0 | -100.00 | 0 | -100.00 | ||||
| 2025-08-14 | 13F | Goldman Sachs Group Inc | 42,570 | 28.89 | 5,960 | 33.87 | ||||
| 2025-07-10 | 13F | Global Financial Private Client, LLC | 0 | -100.00 | 0 | |||||
| 2025-08-14 | 13F | Sunbelt Securities, Inc. | 28 | 21.74 | 4 | 0.00 | ||||
| 2025-07-14 | 13F | AdvisorNet Financial, Inc | 45 | 0.00 | 6 | 0.00 | ||||
| 2025-07-29 | 13F | Empirical Asset Management, LLC | 3,595 | 0.00 | 503 | 3.93 | ||||
| 2025-08-08 | 13F | Smithfield Trust Co | 200 | 0.00 | 0 | |||||
| 2025-08-11 | 13F | HighTower Advisors, LLC | 0 | -100.00 | 0 | |||||
| 2025-07-17 | 13F | Janney Montgomery Scott LLC | 1,465 | -9.06 | 0 | |||||
| 2025-08-12 | 13F | Proequities, Inc. | 0 | 0 | ||||||
| 2025-08-13 | 13F | National Bank Of Canada /fi/ | 0 | -100.00 | 0 | |||||
| 2025-08-05 | 13F | Huntington National Bank | 225 | -16.73 | ||||||
| 2025-07-16 | 13F | Southern Capital Advisors, Llc | 1,635 | 0.37 | 229 | 4.11 | ||||
| 2025-08-14 | 13F | Manufacturers Life Insurance Company, The | 316,252 | 44,278 | ||||||
| 2025-08-05 | 13F | GPS Wealth Strategies Group, LLC | 625 | 0.00 | 88 | 3.57 | ||||
| 2025-07-08 | 13F/A | Salem Investment Counselors Inc | 115 | -14.18 | 16 | -11.11 | ||||
| 2025-08-14 | 13F | RMB Capital Management, LLC | 0 | -100.00 | 0 | |||||
| 2025-08-05 | 13F | Bank Of Montreal /can/ | 7,826 | 11.62 | 1,096 | 15.87 | ||||
| 2025-08-08 | 13F | MTM Investment Management, LLC | 85 | 0.00 | 12 | 0.00 | ||||
| 2025-04-21 | 13F | Ronald Blue Trust, Inc. | 0 | -100.00 | 0 | -100.00 | ||||
| 2025-07-14 | 13F | Proathlete Wealth Management Llc | 2 | 100.00 | 0 | |||||
| 2025-08-14 | 13F | Mercer Global Advisors Inc /adv | 2,324 | -23.70 | 325 | -20.73 | ||||
| 2025-07-25 | 13F | Pathway Financial Advisors LLC | 12,172 | -0.62 | 1,704 | 3.21 | ||||
| 2025-08-04 | 13F | Center for Financial Planning, Inc. | 0 | -100.00 | 0 | |||||
| 2025-08-13 | 13F | Providence Capital Advisors, LLC | 376 | 53 | ||||||
| 2025-08-11 | 13F | TD Waterhouse Canada Inc. | 1 | 0.00 | 0 | |||||
| 2025-08-14 | 13F | Jane Street Group, Llc | 0 | -100.00 | 0 | |||||
| 2025-07-14 | 13F | Park Avenue Securities Llc | 3,278 | 17.16 | 0 | |||||
| 2025-07-11 | 13F | Busey Wealth Management | 1,748 | -5.72 | 245 | -2.01 | ||||
| 2025-08-14 | 13F | Fmr Llc | 2,307 | -1.70 | 323 | 2.22 | ||||
| 2025-08-15 | 13F | CI Private Wealth, LLC | 9,488 | -5.95 | 1,328 | -2.28 | ||||
| 2025-08-14 | 13F | Wells Fargo & Company/mn | 69,423 | -5.06 | 9,720 | -1.40 | ||||
| 2025-07-14 | 13F | Abound Wealth Management | 176 | 0.00 | 25 | 4.35 | ||||
| 2025-08-07 | 13F | Allworth Financial LP | 420 | -3.23 | 59 | 3.57 | ||||
| 2025-08-14 | 13F | Wiley Bros.-aintree Capital, Llc | 6,899 | -5.09 | 961 | -1.44 | ||||
| 2025-08-06 | 13F | Commonwealth Equity Services, Llc | 30,479 | 0.41 | 4 | 0.00 | ||||
| 2025-08-13 | 13F | Navis Wealth Advisors, LLC | 8,021 | 0.35 | 1,123 | 4.18 | ||||
| 2025-08-05 | 13F | Simplex Trading, Llc | 271 | 442.00 | 0 | |||||
| 2025-08-15 | 13F | Captrust Financial Advisors | 3,948 | -9.72 | 553 | -6.28 | ||||
| 2025-08-11 | 13F | Aptus Capital Advisors, LLC | 75 | 0.00 | 10 | 0.00 | ||||
| 2025-08-14 | 13F | Vivaldi Capital Management, LLC | 2,109 | 295 | ||||||
| 2025-07-25 | 13F | NorthRock Partners, LLC | 1,443 | -3.86 | 202 | 0.00 | ||||
| 2025-08-12 | 13F | Change Path, LLC | 1,502 | 210 | ||||||
| 2025-07-24 | 13F | Blair William & Co/il | 59 | 0.00 | 8 | 14.29 | ||||
| 2025-07-23 | 13F | BankPlus Trust Department | 214 | 0.00 | 30 | 3.57 | ||||
| 2025-07-21 | 13F | Ameritas Advisory Services, LLC | 1,031 | 144 | ||||||
| 2025-08-13 | 13F | Colonial Trust Advisors | 236 | 0.00 | 33 | 6.45 | ||||
| 2025-07-31 | 13F | Glass Jacobson Investment Advisors llc | 1,114 | -28.08 | 156 | -22.89 | ||||
| 2025-07-28 | 13F | Harbour Investments, Inc. | 118 | 7.27 | 17 | 14.29 | ||||
| 2025-07-10 | 13F | Sovran Advisors, LLC | 3,830 | 37.08 | 550 | 54.93 | ||||
| 2025-08-06 | 13F | Golden State Wealth Management, LLC | 72 | -30.77 | 10 | -28.57 | ||||
| 2025-07-18 | 13F | Founders Capital Management | 250 | 0.00 | 35 | 6.06 | ||||
| 2025-07-16 | 13F | Dakota Wealth Management | 3,500 | 0.00 | 490 | 4.03 | ||||
| 2025-07-21 | 13F | Old Second National Bank Of Aurora | 0 | -100.00 | 0 | |||||
| 2025-08-12 | 13F | Picton Mahoney Asset Management | 1,000 | 11.11 | 0 | |||||
| 2025-08-12 | 13F | O'shaughnessy Asset Management, Llc | 457 | 0.00 | 64 | 3.28 | ||||
| 2025-07-21 | 13F | Matauro, Llc | 4,526 | -13.08 | 634 | -9.70 | ||||
| 2025-08-14 | 13F | Quantinno Capital Management LP | 1,560 | 219 | ||||||
| 2025-08-07 | 13F | Roberts Glore & Co Inc /il/ | 5,903 | 0.00 | 826 | 3.90 | ||||
| 2025-08-06 | 13F | AE Wealth Management LLC | 15,740 | 9.21 | 2,204 | 13.44 | ||||
| 2025-08-14 | 13F | EP Wealth Advisors, Inc. | 1,264 | -27.31 | 177 | -24.79 | ||||
| 2025-07-31 | 13F | Conservest Capital Advisors, Inc. | 2,310 | 323 | ||||||
| 2025-08-12 | 13F | MAI Capital Management | 1,826 | -7.22 | 256 | -3.77 | ||||
| 2025-05-15 | 13F | EHP Funds Inc. | 0 | -100.00 | 0 | |||||
| 2025-07-28 | 13F | BRYN MAWR TRUST Co | 172 | 0.00 | 24 | 4.35 | ||||
| 2025-08-04 | 13F | Mesirow Financial Investment Management, Inc. | 5,006 | 0.02 | 701 | 3.86 | ||||
| 2025-07-23 | 13F | West Paces Advisors Inc. | 115 | 16 | ||||||
| 2025-08-18 | 13F | Front Row Advisors LLC | 130 | -23.53 | 18 | -18.18 | ||||
| 2025-05-16 | 13F | Empowered Funds, LLC | 0 | -100.00 | 0 | |||||
| 2025-08-15 | 13F | First Heartland Consultants, Inc. | 1,545 | -5.39 | 216 | -1.82 | ||||
| 2025-08-14 | 13F | Citadel Advisors Llc | Put | 0 | -100.00 | 0 | ||||
| 2025-04-11 | 13F | Signal Advisors Wealth, LLC | 0 | -100.00 | 0 | |||||
| 2025-07-29 | 13F | Ifrah Financial Services, Inc. | 1,430 | 200 | ||||||
| 2025-04-11 | 13F | Davis Capital Management | 88 | 0.00 | 12 | 0.00 | ||||
| 2025-08-14 | 13F | Federation des caisses Desjardins du Quebec | 55 | 0.00 | 8 | 0.00 | ||||
| 2025-07-25 | 13F | Atria Wealth Solutions, Inc. | 1,442 | 202 | ||||||
| 2025-07-24 | 13F | IFP Advisors, Inc | 673 | 0.00 | 94 | 4.44 | ||||
| 2025-09-04 | 13F/A | Advisor Group Holdings, Inc. | 18,195 | -18.45 | 2,548 | -15.29 | ||||
| 2025-08-14 | 13F | CoreCap Advisors, LLC | 239 | -15.55 | 33 | -13.16 | ||||
| 2025-08-14 | 13F | UBS Group AG | 79,373 | -7.08 | 11,113 | -3.49 | ||||
| 2025-07-08 | 13F | Nbc Securities, Inc. | 177 | 0.57 | 0 | |||||
| 2025-08-14 | 13F | Mariner, LLC | 2,991 | 19.69 | 419 | 24.40 | ||||
| 2025-08-18 | 13F | Geneos Wealth Management Inc. | 3,516 | 186.32 | 492 | 198.18 | ||||
| 2025-07-28 | 13F | Rosenberg Matthew Hamilton | 230 | 0.00 | 32 | 3.23 | ||||
| 2025-08-13 | 13F | Jones Financial Companies Lllp | 2,491 | -22.95 | 347 | -19.86 | ||||
| 2025-07-16 | 13F/A | CX Institutional | 478 | 0 | ||||||
| 2025-08-01 | 13F | Belvedere Trading LLC | 1,872 | 262 | ||||||
| 2025-08-01 | 13F | Belvedere Trading LLC | Call | 3,900 | 0.00 | 546 | 4.00 | |||
| 2025-07-29 | 13F | Private Trust Co Na | 70 | 0.00 | 10 | 0.00 | ||||
| 2025-08-11 | 13F | Citigroup Inc | 404,744 | -10.60 | 56,668 | -7.15 | ||||
| 2025-08-14 | 13F | Raymond James Financial Inc | 18,307 | 6.24 | 2,563 | 10.38 | ||||
| 2025-08-12 | 13F | CIBC Private Wealth Group, LLC | 83 | 0.00 | 12 | 22.22 | ||||
| 2025-08-11 | 13F | Principal Securities, Inc. | 100 | -93.05 | 14 | -92.47 | ||||
| 2025-08-13 | 13F | StoneX Group Inc. | 2,625 | 26.08 | 367 | 31.07 | ||||
| 2025-08-12 | 13F | Pathstone Holdings, LLC | 3,015 | 0.00 | 422 | 3.94 | ||||
| 2025-08-04 | 13F | Adell Harriman & Carpenter Inc | 1,587 | 0.00 | 222 | 4.23 | ||||
| 2025-08-14 | 13F | Colony Group, LLC | 12,631 | -2.03 | 1,769 | 1.73 | ||||
| 2025-08-05 | 13F | Tsfg, Llc | 27 | 0.00 | 0 | |||||
| 2025-08-08 | 13F | Pnc Financial Services Group, Inc. | 5,355 | 0.00 | 750 | 3.88 | ||||
| 2025-08-01 | 13F | Envestnet Asset Management Inc | 8,356 | -15.39 | 1,170 | -12.17 | ||||
| 2025-08-08 | 13F | Family Firm, Inc. | 0 | -100.00 | 0 | |||||
| 2025-08-14 | 13F | Snowden Capital Advisors LLC | 1,768 | 0.00 | 248 | 3.78 | ||||
| 2025-08-07 | 13F | Legacy Advisors, LLC | 0 | -100.00 | 0 | |||||
| 2025-08-12 | 13F | Laurel Wealth Advisors LLC | 19,602 | 13,901.43 | 0 | -100.00 | ||||
| 2025-05-15 | 13F | Foguth Wealth Management, LLC. | 0 | -100.00 | 0 | |||||
| 2025-08-15 | 13F | Morgan Stanley | 238,644 | -11.23 | 33,413 | -7.80 | ||||
| 2025-08-04 | 13F | Field & Main Bank | 335 | -9.46 | 47 | -6.12 | ||||
| 2025-08-12 | 13F | New Republic Capital, LLC | 180 | 0.00 | 25 | 4.17 | ||||
| 2025-07-17 | 13F | Independence Bank of Kentucky | 1,300 | 5.26 | 182 | 9.64 | ||||
| 2025-07-29 | 13F | Cottonwood Capital Advisors, Llc | 3,659 | -0.14 | 512 | 3.85 | ||||
| 2025-08-11 | 13F | Strategic Wealth Partners, Ltd. | 200 | 28 | ||||||
| 2025-08-12 | 13F | LPL Financial LLC | 89,015 | 6.04 | 12,463 | 10.14 | ||||
| 2025-07-23 | 13F | Clear Creek Financial Management, LLC | 2,108 | 0.24 | 295 | 4.24 | ||||
| 2025-08-14 | 13F | Daiwa Securities Group Inc. | 5,350 | 7.00 | 1 | |||||
| 2025-04-23 | 13F | Financial Life Planners | 0 | -100.00 | 0 | |||||
| 2025-08-14 | 13F | Bank Of America Corp /de/ | 131,814 | 5.16 | 18,455 | 9.22 | ||||
| 2025-07-23 | 13F | REAP Financial Group, LLC | 1 | 0.00 | 0 | |||||
| 2025-08-08 | 13F | Cetera Investment Advisers | 16,692 | 1.24 | 2,337 | 5.18 | ||||
| 2025-07-10 | 13F | Ferguson Wellman Capital Management, Inc | 3,445 | -12.67 | 482 | -9.23 | ||||
| 2025-08-13 | 13F | Truvestments Capital Llc | 475 | 0.00 | 67 | 3.13 | ||||
| 2025-07-17 | 13F | Fifth Third Securities, Inc. | 4,680 | 4.25 | 655 | 8.26 | ||||
| 2025-08-13 | 13F | Bank Of Nova Scotia | 25,400 | -23.26 | 3,556 | -20.29 | ||||
| 2025-08-04 | 13F | Spire Wealth Management | 2,858 | 0.28 | 400 | 4.17 | ||||
| 2025-08-13 | 13F | Baird Financial Group, Inc. | 1,451 | 203 | ||||||
| 2025-08-05 | 13F | Harel Insurance Investments & Financial Services Ltd. | 598 | 0.00 | 0 | |||||
| 2025-07-29 | 13F | Stratos Wealth Advisors, LLC | 5,132 | 8.82 | 719 | 13.07 | ||||
| 2025-08-13 | 13F | Northwestern Mutual Wealth Management Co | 69,330 | -2.56 | 9,707 | 1.20 | ||||
| 2025-07-15 | 13F | Cranbrook Wealth Management, LLC | 902 | -6.04 | 126 | -2.33 | ||||
| 2025-08-04 | 13F | Arkadios Wealth Advisors | 2,563 | -0.74 | 359 | 2.87 | ||||
| 2025-07-10 | 13F | Focus Financial Network, Inc. | 1,850 | 7.12 | 259 | 11.64 | ||||
| 2025-07-10 | 13F | Piscataqua Savings Bank | 1,020 | 0.00 | 143 | 3.65 | ||||
| 2025-08-12 | 13F | Jpmorgan Chase & Co | 1,863 | -29.67 | 261 | -27.17 | ||||
| 2025-07-17 | 13F | Mattern Wealth Management LLC | 2,579 | -4.69 | 361 | -0.82 | ||||
| 2025-07-11 | 13F | Caldwell Securities, Inc | 180 | 0.00 | 25 | 4.17 | ||||
| 2025-08-12 | 13F | BlackRock, Inc. | 410 | 0.00 | 57 | 3.64 | ||||
| 2025-07-08 | 13F | Rise Advisors, LLC | 10 | 1 | ||||||
| 2025-08-08 | 13F | Gts Securities Llc | 24,796 | 146.65 | 3,472 | 156.16 | ||||
| 2025-08-06 | 13F | SOUTH STATE Corp | 30 | 0.00 | 4 | 0.00 | ||||
| 2025-08-06 | 13F | Ethos Financial Group, LLC | 2,042 | -14.81 | 286 | -11.76 | ||||
| 2025-08-12 | 13F | AlphaCore Capital LLC | 784 | 110 | ||||||
| 2025-08-14 | 13F | IHT Wealth Management, LLC | 0 | -100.00 | 0 | |||||
| 2025-08-13 | 13F | Green Harvest Asset Management LLC | 306,221 | 1.42 | 42,874 | 5.34 | ||||
| 2025-08-14 | 13F | Qube Research & Technologies Ltd | 888 | -23.25 | 124 | -20.00 | ||||
| 2025-07-11 | 13F | Farther Finance Advisors, LLC | 282 | 4,600.00 | 39 | |||||
| 2025-08-04 | 13F | IFG Advisory, LLC | 0 | -100.00 | 0 | |||||
| 2025-07-09 | 13F | Gilman Hill Asset Management, LLC | 1,500 | 0.00 | 210 | 3.96 | ||||
| 2025-07-18 | 13F | Bartlett & Co. Wealth Management Llc | 3,618 | 0.00 | 507 | 3.90 | ||||
| 2025-08-07 | 13F | Montag A & Associates Inc | 1,000 | 0.00 | 140 | 4.48 | ||||
| 2025-07-30 | 13F | Whittier Trust Co Of Nevada Inc | 2,500 | 0.00 | 350 | 4.17 | ||||
| 2025-08-07 | 13F | 1620 Investment Advisors, Inc. | 130 | 0.00 | 18 | 5.88 | ||||
| 2025-08-07 | 13F | CENTRAL TRUST Co | 123 | 0.00 | 17 | 6.25 | ||||
| 2025-07-30 | 13F | D.a. Davidson & Co. | 0 | -100.00 | 0 | |||||
| 2025-08-14 | 13F | Coastal Bridge Advisors, LLC | 2,769 | -2.33 | 388 | 1.31 | ||||
| 2025-08-08 | 13F | Capital Investment Advisory Services, LLC | 242 | 476.19 | 34 | 560.00 | ||||
| 2025-08-14 | 13F | Guardian Wealth Advisors, Llc / Nc | 20 | 0.00 | 3 | 0.00 | ||||
| 2025-08-14 | 13F | Susquehanna International Group, Llp | Call | 1,600 | 0.00 | 224 | 4.19 | |||
| 2025-08-14 | 13F | Susquehanna International Group, Llp | 31,722 | 1,008.39 | 4,441 | 1,053.51 | ||||
| 2025-05-14 | 13F | Flow Traders U.s. Llc | 0 | -100.00 | 0 | |||||
| 2025-08-14 | 13F | Two Sigma Investments, Lp | 0 | -100.00 | 0 | |||||
| 2025-07-08 | 13F | Parallel Advisors, LLC | 230 | 0.00 | 32 | 3.23 | ||||
| 2025-07-14 | 13F | Armstrong Advisory Group, Inc | 117 | 48.10 | 16 | 60.00 | ||||
| 2025-08-14 | 13F | Comerica Bank | 2,483 | 1.06 | 348 | 4.83 | ||||
| 2025-07-14 | 13F | Farmers & Merchants Investments Inc | 185 | 0.00 | 26 | 4.17 | ||||
| 2025-07-31 | 13F | Mycio Wealth Partners, Llc | 160 | 0.00 | 22 | 4.76 | ||||
| 2025-08-12 | 13F | Gladstone Institutional Advisory LLC | 8,325 | -1.15 | 1,166 | 2.64 | ||||
| 2025-08-14 | 13F/A | Rockefeller Capital Management L.P. | 10,807 | -4.38 | 1,513 | -0.66 | ||||
| 2025-08-06 | 13F | Stonebridge Financial Planning Group, LLC | 2,942 | -6.66 | 412 | -3.07 | ||||
| 2025-08-14 | 13F | Royal Bank Of Canada | 47,493 | -0.40 | 6,649 | 3.44 | ||||
| 2025-08-19 | 13F | Anchor Investment Management, LLC | 105 | 0.00 | 15 | 0.00 | ||||
| 2025-08-07 | 13F | Commerce Bank | 116,082 | -4.02 | 16,253 | -0.31 | ||||
| 2025-08-12 | 13F | Steward Partners Investment Advisory, Llc | 6,870 | 3.67 | 962 | 7.61 | ||||
| 2025-07-07 | 13F | First Citizens Financial Corp | 9,362 | -17.52 | 1,311 | -14.38 | ||||
| 2025-08-11 | 13F | United Capital Financial Advisers, Llc | 3,037 | -9.15 | 425 | -5.56 | ||||
| 2025-07-25 | 13F | Cwm, Llc | 1,572 | -12.52 | 0 | |||||
| 2025-07-28 | 13F | Mutual Advisors, LLC | 7,750 | 297.64 | 1,148 | 353.75 | ||||
| 2025-07-30 | 13F | Atlantic Edge Private Wealth Management, LLC | 490 | 0.00 | 69 | 3.03 | ||||
| 2025-08-15 | 13F | Tower Research Capital LLC (TRC) | 1,436 | -35.66 | 201 | -25.00 | ||||
| 2025-07-17 | 13F | Halbert Hargrove Global Advisors, Llc | 0 | -100.00 | 0 | |||||
| 2025-07-16 | 13F | Register Financial Advisors LLC | 2 | 0.00 | 0 | |||||
| 2025-08-05 | 13F | HFG Advisors, Inc. | 2,736 | 0.00 | 383 | 4.08 | ||||
| 2025-07-15 | 13F | Patriot Investment Management Inc. | 2,383 | 0.00 | 334 | 3.74 | ||||
| 2025-07-23 | 13F | Trueblood Wealth Management, LLC | 1,435 | 201 | ||||||
| 2025-08-13 | 13F | Colonial Trust Co / SC | 350 | 0.00 | 49 | 4.26 | ||||
| 2025-07-23 | 13F | Lakeshore Capital Group, Inc. | 2,263 | 9.01 | 317 | 13.26 |