Mga Batayang Estadistika
| Pemilik Institusional | 156 total, 156 long only, 0 short only, 0 long/short - change of -1.88% MRQ |
| Alokasi Portofolio Rata-rata | 0.5596 % - change of 1.76% MRQ |
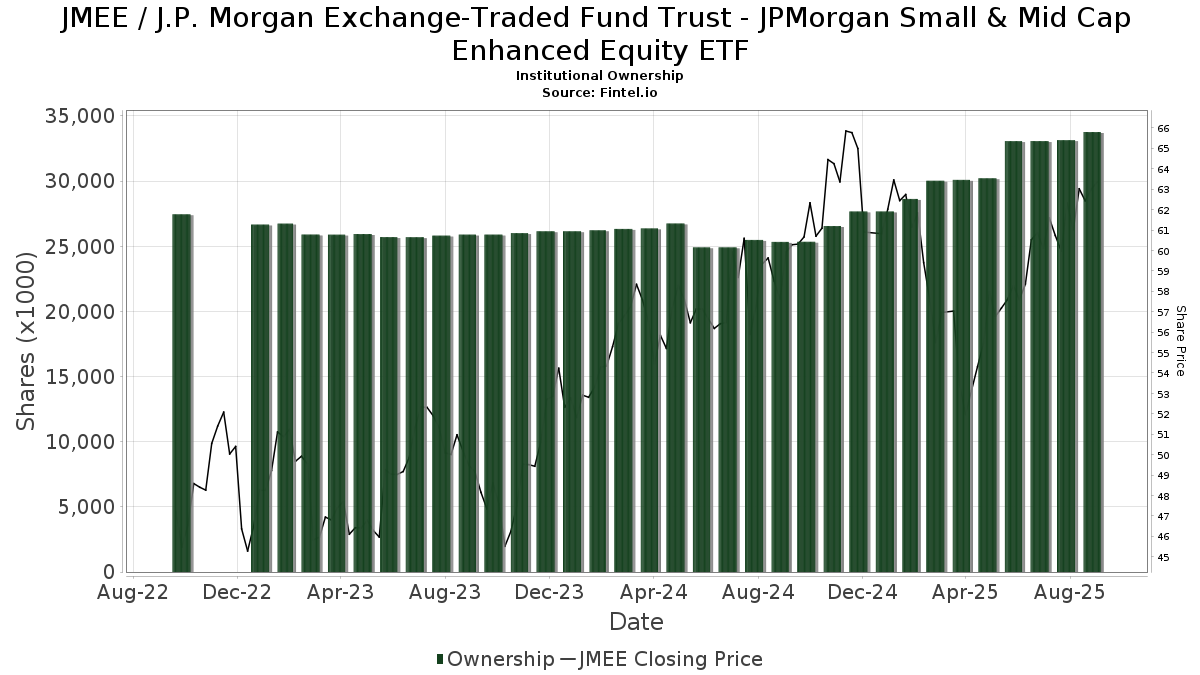
| Saham Institusional (Jangka Panjang) | 33,765,008 (ex 13D/G) - change of 0.70MM shares 2.11% MRQ |
| Nilai Institusional (Jangka Panjang) | $ 1,936,185 USD ($1000) |
Kepemilikan Institusional dan Pemegang Saham
J.P. Morgan Exchange-Traded Fund Trust - JPMorgan Small & Mid Cap Enhanced Equity ETF (US:JMEE) memiliki 156 pemilik institusional dan pemegang saham yang telah mengajukan formulir 13D/G atau 13F kepada Komisi Bursa Efek (Securities Exchange Commission/SEC). Lembaga-lembaga ini memegang total 33,765,008 saham. Pemegang saham terbesar meliputi Jpmorgan Chase & Co, ONIFX - JPMorgan Investor Growth Fund Class I, ONGFX - JPMorgan Investor Growth & Income Fund Class I, OIBFX - JPMorgan Investor Balanced Fund Class I, LPL Financial LLC, Crestwood Advisors Group LLC, Great Valley Advisor Group, Inc., Syntegra Private Wealth Group, LLC, ONCFX - JPMorgan Investor Conservative Growth Fund Class I, and Advisor Group Holdings, Inc. .
Struktur kepemilikan institusional J.P. Morgan Exchange-Traded Fund Trust - JPMorgan Small & Mid Cap Enhanced Equity ETF (ARCA:JMEE) menunjukkan posisi terkini di perusahaan oleh institusi dan dana, serta perubahan terbaru dalam ukuran posisi. Pemegang saham utama dapat mencakup investor individu, reksa dana, dana lindung nilai, atau institusi. Jadwal 13D menunjukkan bahwa investor memegang (atau pernah memegang) lebih dari 5% saham perusahaan dan bermaksud (atau pernah bermaksud) untuk secara aktif mengejar perubahan strategi bisnis. Jadwal 13G menunjukkan investasi pasif lebih dari 5%.
The share price as of September 5, 2025 is 63.66 / share. Previously, on September 6, 2024, the share price was 57.23 / share. This represents an increase of 11.24% over that period.
Skor Sentimen Dana
Skor Sentimen Dana (sebelumnya dikenal sebagai Skor Akumulasi Kepemilikan) menemukan saham-saham yang paling banyak dibeli oleh dana. Ini adalah hasil dari model kuantitatif multi-faktor yang canggih yang mengidentifikasi perusahaan dengan tingkat akumulasi institusional tertinggi. Model penilaian menggunakan kombinasi dari total peningkatan pemilik yang diungkapkan, perubahan dalam alokasi portofolio pada pemilik tersebut, dan metrik lainnya. Angka berkisar dari 0 hingga 100, dengan angka yang lebih tinggi menunjukkan tingkat akumulasi yang lebih tinggi dibandingkan dengan perusahaan sejenisnya, dan 50 adalah rata-ratanya.
Frekuensi Pembaruan: Setiap Hari
Lihat Ownership Explorer, yang menyediakan daftar perusahaan dengan peringkat tertinggi.
Rasio Put/Call Institusional
Selain melaporkan isu ekuitas dan utang standar, institusi dengan aset di bawah manajemen lebih dari 100 juta dolar AS juga harus mengungkapkan kepemilikan opsi put dan call mereka. Karena opsi put umumnya menunjukkan sentimen negatif, dan opsi call menunjukkan sentimen positif, kita dapat mengetahui sentimen institusional secara keseluruhan dengan memplot rasio put terhadap call. Grafik di sebelah kanan memplot rasio put/call historis untuk instrumen ini.
Menggunakan Rasio Put/Call sebagai indikator sentimen investor mengatasi salah satu kekurangan utama dari penggunaan total kepemilikan institusional, yaitu sejumlah besar aset yang dikelola diinvestasikan secara pasif untuk melacak indeks. Dana yang dikelola secara pasif biasanya tidak membeli opsi, sehingga indikator rasio put/call lebih akurat dalam melacak sentimen dana yang dikelola secara aktif.
Pengajuan 13F dan NPORT
Detail pada pengajuan 13F tersedia gratis. Detail pada pengajuan NP memerlukan keanggotaan premium. Baris berwarna hijau menunjukkan posisi baru. Baris berwarna merah menunjukkan posisi yang sudah ditutup. Klik tautan ini ikon untuk melihat riwayat transaksi selengkapnya.
Tingkatkan
untuk membuka data premium dan mengekspor ke Excel ![]() .
.
| Tanggal File | Sumber | Investor | Ketik | Presyo ng Avg (Silangan) |
Saham | Δ Saham (%) |
Dilaporkan Nilai ($1000) |
Nilai Δ (%) |
Alokasi Port (%) |
|
|---|---|---|---|---|---|---|---|---|---|---|
| 2025-07-08 | 13F | Choice Wealth Advisors, LLC | 156,587 | 1.72 | 9,272 | 7.59 | ||||
| 2025-08-11 | 13F | Principal Securities, Inc. | 324 | -50.08 | 19 | -51.28 | ||||
| 2025-08-12 | 13F/A | Cozad Asset Management Inc | 8,228 | -28.81 | 487 | -24.73 | ||||
| 2025-07-28 | 13F | Nestegg Advisors, Inc. | 3,870 | 0.00 | 229 | 6.02 | ||||
| 2025-07-07 | 13F | Global Wealth Strategies & Associates | 0 | -100.00 | 0 | |||||
| 2025-07-28 | 13F | Private Wealth Asset Management, LLC | 238 | 14 | ||||||
| 2025-08-26 | NP | EVCLX - The E-Valuator Conservative (15%-30%) RMS Fund Service Class Shares | 2,534 | -50.16 | 150 | -47.18 | ||||
| 2025-07-14 | 13F | Farmers & Merchants Investments Inc | 1 | 0.00 | 0 | |||||
| 2025-08-14 | 13F | Benjamin Edwards Inc | 13,699 | 0.76 | 811 | 6.57 | ||||
| 2025-08-26 | NP | EVTTX - The E-Valuator Conservative/Moderate (30%-50%) RMS Fund Service Class Shares | 2,747 | -47.47 | 163 | -44.52 | ||||
| 2025-08-12 | 13F | Tradition Wealth Management, LLC | 98,232 | 10.61 | 5,816 | 17.00 | ||||
| 2025-07-10 | 13F | Stewardship Advisors, LLC | 74,076 | 0.95 | 4,386 | 6.79 | ||||
| 2025-07-22 | 13F | Siligmueller & Norvid Wealth Advisors LLC | 19,165 | -15.94 | 1,152 | -9.72 | ||||
| 2025-08-14 | 13F | Sunbelt Securities, Inc. | 41 | 0.00 | 2 | 0.00 | ||||
| 2025-08-04 | 13F | IFG Advisory, LLC | 11,741 | 8.93 | 695 | 15.26 | ||||
| 2025-08-12 | 13F | Jpmorgan Chase & Co | 10,512,654 | 0.10 | 622,454 | 5.88 | ||||
| 2025-08-14 | 13F | D. E. Shaw & Co., Inc. | 3,489 | -61.68 | 207 | -59.53 | ||||
| 2025-07-09 | 13F | Fermata Advisors, LLC | 21,297 | -16.94 | 1,261 | -12.20 | ||||
| 2025-07-15 | 13F | Avaii Wealth Management, Llc | 7,283 | 431 | ||||||
| 2025-08-14 | 13F | Comerica Bank | 1,043 | -52.66 | 62 | -50.41 | ||||
| 2025-08-07 | 13F | Verus Capital Partners, Llc | 132,146 | -6.75 | 7,824 | -1.36 | ||||
| 2025-08-26 | NP | ONIFX - JPMorgan Investor Growth Fund Class I | 4,247,206 | 0.00 | 251,477 | 5.77 | ||||
| 2025-07-10 | 13F | Redhawk Wealth Advisors, Inc. | 0 | -100.00 | 0 | |||||
| 2025-07-11 | 13F | Bond & Devick Financial Network, Inc. | 154,248 | 6.32 | 9,133 | 12.46 | ||||
| 2025-08-15 | 13F | Asset Allocation Strategies LLC | 24,162 | -19.59 | 1,431 | -14.98 | ||||
| 2025-08-26 | NP | ONGFX - JPMorgan Investor Growth & Income Fund Class I | 2,895,844 | 0.00 | 171,463 | 5.77 | ||||
| 2025-05-13 | 13F | Thrivent Financial For Lutherans | 0 | -100.00 | 0 | |||||
| 2025-04-23 | 13F | Spire Wealth Management | 0 | -100.00 | 0 | |||||
| 2025-08-14 | 13F | Visionary Wealth Advisors | 0 | -100.00 | 0 | |||||
| 2025-08-26 | NP | EVMLX - The E-Valuator Moderate (50%-70%) RMS Fund Service Class Shares | 11,868 | -61.56 | 703 | -59.37 | ||||
| 2025-07-10 | 13F | Rockland Trust Co | 9,731 | -4.71 | 576 | 0.88 | ||||
| 2025-08-12 | 13F | Proequities, Inc. | 0 | 0 | ||||||
| 2025-07-31 | 13F | West Michigan Advisors, Llc | 69,047 | 1.03 | 4,088 | 6.85 | ||||
| 2025-08-08 | 13F | Advisory Resource Group | 286,683 | 21.46 | 16,974 | 28.46 | ||||
| 2025-08-11 | 13F | Brown Brothers Harriman & Co | 4,140 | 245 | ||||||
| 2025-07-25 | 13F | Total Clarity Wealth Management, Inc. | 22,670 | 53.36 | 1,342 | 50.28 | ||||
| 2025-08-04 | 13F | Spinnaker Trust | 3,554 | 210 | ||||||
| 2025-07-30 | 13F | Crewe Advisors LLC | 515 | 0.00 | 30 | 7.14 | ||||
| 2025-08-14 | 13F | Qube Research & Technologies Ltd | 353 | 21 | ||||||
| 2025-08-11 | 13F | Private Advisor Group, LLC | 68,860 | 221.09 | 4,077 | 239.75 | ||||
| 2025-08-26 | NP | EVAGX - The E-Valuator Aggressive Growth (85%-99%) RMS Fund Service Class Shares | 27,770 | -58.40 | 1,644 | -56.01 | ||||
| 2025-08-06 | 13F | Mascagni Wealth Management, Inc. | 4,390 | -9.69 | 260 | -4.78 | ||||
| 2025-04-21 | 13F | O'Dell Group, LLC | 0 | -100.00 | 0 | |||||
| 2025-07-22 | 13F | Awm Capital, Llc | 0 | -100.00 | 0 | |||||
| 2025-08-14 | 13F | Schwallier Wealth Management LLC | 120,470 | 26.16 | 7,133 | 33.45 | ||||
| 2025-08-26 | NP | EVGLX - The E-Valuator Growth (70%-85%) RMS Fund Service Class Shares | 34,845 | -59.50 | 2,063 | -57.16 | ||||
| 2025-07-24 | 13F | Leo Wealth, LLC | 18,776 | 1,112 | ||||||
| 2025-04-21 | 13F | Nelson, Van Denburg & Campbell Wealth Management Group, LLC | 0 | -100.00 | 0 | |||||
| 2025-08-15 | 13F | Kestra Advisory Services, LLC | 96,831 | 19.95 | 5,733 | -0.74 | ||||
| 2025-08-14 | 13F | Goldman Sachs Group Inc | 3,989 | 236 | ||||||
| 2025-08-14 | 13F | GWM Advisors LLC | 7,844 | -21.24 | 464 | -16.70 | ||||
| 2025-08-04 | 13F | Creative Financial Designs Inc /adv | 81,215 | -4.35 | 4,809 | 1.16 | ||||
| 2025-08-06 | 13F | Golden State Wealth Management, LLC | 670 | -32.39 | 40 | -29.09 | ||||
| 2025-08-12 | 13F | Global Retirement Partners, LLC | 18,921 | 298.76 | 1,120 | 291.61 | ||||
| 2025-07-07 | 13F | Nova Wealth Management, Inc. | 33 | 10.00 | 2 | 0.00 | ||||
| 2025-07-16 | 13F | Kendall Capital Management | 0 | -100.00 | 0 | |||||
| 2025-08-12 | 13F | Steward Partners Investment Advisory, Llc | 1,421 | 80.10 | 84 | 90.91 | ||||
| 2025-08-14 | 13F | Freedom Financial Partners LLC | 93,241 | 4.25 | 5,520 | 10.25 | ||||
| 2025-09-04 | 13F/A | Advisor Group Holdings, Inc. | 584,916 | 9.44 | 34,638 | 15.75 | ||||
| 2025-08-13 | 13F | Capital Analysts, Inc. | 402 | 0.00 | 0 | |||||
| 2025-07-22 | 13F | Wells Trecaso Financial Group, LLC | 26,064 | 5.42 | 1,543 | 11.57 | ||||
| 2025-08-11 | 13F | PAX Financial Group, LLC | 8,735 | -0.01 | 517 | 5.73 | ||||
| 2025-08-19 | 13F | Advisory Services Network, LLC | 4,920 | 35.91 | 295 | 46.04 | ||||
| 2025-07-31 | 13F | Glass Jacobson Investment Advisors llc | 2,100 | 0.00 | 124 | -1.59 | ||||
| 2025-08-14 | 13F | Stifel Financial Corp | 79,897 | -4.63 | 4,731 | 0.87 | ||||
| 2025-08-26 | NP | OIBFX - JPMorgan Investor Balanced Fund Class I | 2,576,137 | 0.00 | 152,533 | 5.77 | ||||
| 2025-08-15 | 13F | Morgan Stanley | 3,842 | 53.50 | 228 | 62.14 | ||||
| 2025-07-29 | 13F | Stratos Wealth Partners, LTD. | 3,406 | 202 | ||||||
| 2025-09-03 | 13F | American Trust | 75,645 | 4,479 | ||||||
| 2025-08-14 | 13F | Mml Investors Services, Llc | 8,463 | 13.05 | 1 | |||||
| 2025-07-15 | 13F | Financial Management Professionals, Inc. | 50 | 0.00 | 3 | 0.00 | ||||
| 2025-08-14 | 13F | Jane Street Group, Llc | 30,691 | -47.95 | 1,817 | -44.96 | ||||
| 2025-07-08 | 13F | Adamsbrown Wealth Consultants Llc | 0 | -100.00 | 0 | |||||
| 2025-06-11 | 13F | Fortitude Financial, LLC | 67,249 | 1.88 | 3,765 | -5.69 | ||||
| 2025-04-23 | 13F | SFG Wealth Management, LLC. | 0 | -100.00 | 0 | |||||
| 2025-08-11 | 13F | Summit Wealth Partners, LLC | 11,801 | 5.27 | 699 | 11.32 | ||||
| 2025-04-23 | 13F | Bluesphere Advisors, LLC | 0 | -100.00 | 0 | |||||
| 2025-08-14 | 13F | Heritage Wealth Management, Inc. | 5,558 | 39.05 | 329 | 47.53 | ||||
| 2025-07-30 | 13F | Syntegra Private Wealth Group, LLC | 799,983 | 5.84 | 47,367 | 11.94 | ||||
| 2025-08-05 | 13F | Scarborough Advisors, LLC | 83,493 | 29.38 | 4,944 | 36.85 | ||||
| 2025-07-31 | 13F | Cambridge Investment Research Advisors, Inc. | 27,137 | -11.18 | 2 | 0.00 | ||||
| 2025-05-06 | 13F | Assetmark, Inc | 0 | -100.00 | 0 | |||||
| 2025-08-07 | 13F | Lakeridge Wealth Management LLC | 77,720 | 3.10 | 4,602 | 9.05 | ||||
| 2025-08-06 | 13F | Commonwealth Equity Services, Llc | 210,980 | 21.07 | 12 | 33.33 | ||||
| 2025-07-09 | 13F | Dynamic Advisor Solutions LLC | 4,853 | -11.33 | 287 | -6.21 | ||||
| 2025-07-14 | 13F | Rooted Wealth Advisors, Inc. | 16,940 | 8.65 | 1,028 | 29.80 | ||||
| 2025-08-13 | 13F | Baird Financial Group, Inc. | 46,424 | -4.08 | 2,749 | 1.44 | ||||
| 2025-08-04 | 13F | Daymark Wealth Partners, Llc | 14,711 | 1.88 | 871 | 7.80 | ||||
| 2025-07-25 | 13F | NorthRock Partners, LLC | 8 | 0.00 | 0 | |||||
| 2025-08-12 | 13F | Cornerstone Wealth Management, LLC | 5,961 | 0.00 | 353 | 5.71 | ||||
| 2025-08-07 | 13F | Nwam Llc | 10,691 | -73.74 | 649 | -71.52 | ||||
| 2025-07-16 | 13F | RWM Asset Management, LLC | 63,706 | 2.36 | 3,772 | 8.27 | ||||
| 2025-07-28 | 13F | WealthPlan Investment Management, LLC | 11,876 | 703 | ||||||
| 2025-07-29 | 13F | Systelligence, LLC | 80,142 | -58.77 | 4,745 | -56.39 | ||||
| 2025-05-15 | 13F | Talon Private Wealth, LLC | 0 | -100.00 | 0 | -100.00 | ||||
| 2025-08-14 | 13F | Arete Wealth Advisors, LLC | 8,886 | 1.73 | 1 | |||||
| 2025-08-05 | 13F | Prosperity Wealth Management, Inc. | 5,544 | -5.30 | 328 | 0.31 | ||||
| 2025-07-22 | 13F | Merit Financial Group, LLC | 34,273 | -7.17 | 2,029 | -1.79 | ||||
| 2025-08-26 | NP | EVVLX - The E-Valuator Very Conservative (0%-15%) RMS Fund Service Class Shares | 378 | -6.20 | 22 | 0.00 | ||||
| 2025-05-09 | 13F | CoreCap Advisors, LLC | 0 | -100.00 | 0 | |||||
| 2025-07-15 | 13F | Total Wealth Planning, Llc | 442,415 | 11.47 | 26,195 | 17.91 | ||||
| 2025-07-24 | 13F | Us Bancorp \de\ | 28,120 | -0.01 | 1,665 | 5.72 | ||||
| 2025-07-17 | 13F | Janney Montgomery Scott LLC | 56,849 | -33.59 | 3 | -25.00 | ||||
| 2025-08-06 | 13F | AE Wealth Management LLC | 290 | -19.44 | 17 | -15.00 | ||||
| 2025-08-11 | 13F | Aptus Capital Advisors, LLC | 135 | 0.00 | 8 | 14.29 | ||||
| 2025-08-14 | 13F | Sequent Planning LLC | 4,734 | 19.12 | 280 | 26.13 | ||||
| 2025-08-12 | 13F | MAI Capital Management | 4,041 | 423.45 | 239 | 455.81 | ||||
| 2025-08-13 | 13F | Avestar Capital, LLC | 27,155 | 18.94 | 1,608 | 25.74 | ||||
| 2025-05-13 | 13F | Heck Capital Advisors, LLC | 0 | -100.00 | 0 | -100.00 | ||||
| 2025-08-12 | 13F | SRS Capital Advisors, Inc. | 416 | 1,334.48 | 25 | 2,300.00 | ||||
| 2025-05-13 | 13F | Quadrature Capital Ltd | 0 | -100.00 | 0 | -100.00 | ||||
| 2025-08-13 | 13F | Banco de Sabadell, S.A | 517 | 0 | ||||||
| 2025-07-25 | 13F | Concurrent Investment Advisors, LLC | 32,626 | 59.29 | 1,932 | 68.50 | ||||
| 2025-08-13 | 13F | Smith, Moore & Co. | 27,836 | -21.26 | 1,648 | -16.73 | ||||
| 2025-08-07 | 13F | Meridian Financial Partners LLC | 285,065 | 8.81 | 17 | 14.29 | ||||
| 2025-08-18 | 13F/A | National Bank Of Canada /fi/ | 37,388 | -15.92 | 2,214 | -10.87 | ||||
| 2025-08-14 | 13F | Ruggaard & Associates LLC | 28,071 | -11.86 | 1,662 | -6.73 | ||||
| 2025-05-12 | 13F | Citigroup Inc | 0 | -100.00 | 0 | |||||
| 2025-08-13 | 13F | Northwestern Mutual Wealth Management Co | 258,682 | 17.29 | 15,317 | 24.06 | ||||
| 2025-08-14 | 13F | Fmr Llc | 303 | 604.65 | 18 | 750.00 | ||||
| 2025-07-21 | 13F | Greenwood Capital Associates Llc | 18,489 | 20.45 | 1,095 | 27.36 | ||||
| 2025-08-04 | 13F | Center for Financial Planning, Inc. | 1,223 | 0.00 | 72 | 5.88 | ||||
| 2025-08-07 | 13F | Kestra Private Wealth Services, Llc | 18,097 | 15.81 | 1,072 | 22.54 | ||||
| 2025-07-30 | 13F | Wbh Advisory Inc | 19,148 | 1,134 | ||||||
| 2025-08-14 | 13F | Royal Bank Of Canada | 155,929 | 4.05 | 9,232 | 10.04 | ||||
| 2025-07-24 | 13F | Eastern Bank | 0 | -100.00 | 0 | |||||
| 2025-08-14 | 13F | McIlrath & Eck, LLC | 15 | 0.00 | 1 | |||||
| 2025-07-21 | 13F | Ameritas Advisory Services, LLC | 916 | 54 | ||||||
| 2025-08-06 | 13F | Atlas Legacy Advisors, LLC | 45,021 | 6.79 | 2,666 | 10.03 | ||||
| 2025-07-28 | 13F | CGC Financial Services, LLC | 368,650 | 5.55 | 21,828 | 11.64 | ||||
| 2025-08-14 | 13F | Susquehanna International Group, Llp | 0 | -100.00 | 0 | |||||
| 2025-08-14 | 13F | UBS Group AG | 50,255 | -18.13 | 2,976 | -13.42 | ||||
| 2025-07-17 | 13F | Fifth Third Securities, Inc. | 41,172 | 17.12 | 2,438 | 23.89 | ||||
| 2025-04-23 | 13F | Valicenti Advisory Services Inc | 0 | -100.00 | 0 | |||||
| 2025-08-14 | 13F | Ameriprise Financial Inc | 56,348 | -6.12 | 3,336 | -0.71 | ||||
| 2025-08-14 | 13F | Wiley Bros.-aintree Capital, Llc | 12,182 | 6.96 | 731 | 15.30 | ||||
| 2025-08-14 | 13F | Wells Fargo & Company/mn | 0 | 0 | ||||||
| 2025-07-08 | 13F | Legacy Private Trust Co. | 89,163 | 418.87 | 5,279 | 449.32 | ||||
| 2025-07-28 | 13F | Harbour Investments, Inc. | 195 | 10.17 | 12 | 22.22 | ||||
| 2025-07-29 | 13F | Harbor Asset Planning, Inc. | 8,746 | 518 | ||||||
| 2025-04-21 | 13F | MN Wealth Advisors, LLC | 0 | -100.00 | 0 | |||||
| 2025-08-13 | 13F | Balance Wealth, LLC | 0 | -100.00 | 0 | |||||
| 2025-07-09 | 13F | Triumph Capital Management | 0 | -100.00 | 0 | |||||
| 2025-07-17 | 13F | Wagner Wealth Management, Llc | 387,521 | 6.02 | 22,945 | 12.15 | ||||
| 2025-08-05 | 13F | Strategic Financial Concepts, LLC | 0 | -100.00 | 0 | |||||
| 2025-07-25 | 13F | Concord Wealth Partners | 341 | 2.71 | 20 | 11.11 | ||||
| 2025-08-05 | 13F | Flynn Zito Capital Management, Llc | 108,351 | 2.39 | 6,415 | 8.29 | ||||
| 2025-08-08 | 13F | Cetera Investment Advisers | 579,860 | 13.85 | 34,333 | 20.42 | ||||
| 2025-08-11 | 13F | Western Wealth Management, LLC | 10,524 | 8.45 | 623 | 14.73 | ||||
| 2025-07-25 | 13F | Northwest Capital Management Inc | 4,826 | 22.96 | 286 | 30.14 | ||||
| 2025-08-05 | 13F | Crestwood Advisors Group LLC | 859,938 | -24.33 | 50,917 | -19.97 | ||||
| 2025-07-25 | 13F | Hazlett, Burt & Watson, Inc. | 1,885 | 0.00 | 0 | |||||
| 2025-08-07 | 13F | PCG Wealth Advisors, LLC | 0 | -100.00 | 0 | |||||
| 2025-08-14 | 13F | Great Valley Advisor Group, Inc. | 845,752 | 22.45 | 50,077 | 29.51 | ||||
| 2025-08-15 | 13F | Equitable Holdings, Inc. | 52,710 | 17.10 | 3,121 | 23.86 | ||||
| 2025-08-04 | 13F | MeadowBrook Investment Advisors LLC | 0 | -100.00 | 0 | |||||
| 2025-08-04 | 13F | Pensionmark Financial Group, Llc | 5,514 | -1.27 | 326 | 4.49 | ||||
| 2025-08-13 | 13F | Jones Financial Companies Lllp | 288,256 | 41.50 | 17,073 | 50.40 | ||||
| 2025-08-15 | 13F | Tower Research Capital LLC (TRC) | 25,725 | 1,523 | ||||||
| 2025-08-11 | 13F | HighTower Advisors, LLC | 6,119 | -14.94 | 362 | -9.95 | ||||
| 2025-08-12 | 13F | CIBC Private Wealth Group, LLC | 1,535 | 0.00 | 91 | 20.00 | ||||
| 2025-08-13 | 13F | Capital Advisors Wealth Management, LLC | 5,133 | 16.66 | 304 | 23.17 | ||||
| 2025-07-24 | 13F | IFP Advisors, Inc | 913 | 18.11 | 54 | 25.58 | ||||
| 2025-08-12 | 13F | Barnes Pettey Financial Advisors, Llc | 12,811 | 759 | ||||||
| 2025-07-25 | 13F | Envestnet Portfolio Solutions, Inc. | 0 | -100.00 | 0 | |||||
| 2025-08-14 | 13F | Vienna Asset Management LLC | 0 | -100.00 | 0 | |||||
| 2025-07-31 | 13F | B & T Capital Management DBA Alpha Capital Management | 197,209 | -3.41 | 11,677 | 2.16 | ||||
| 2025-07-09 | 13F | Breakwater Capital Group | 0 | -100.00 | 0 | -100.00 | ||||
| 2025-07-21 | 13F | Ashton Thomas Securities, Llc | 28,823 | -18.22 | 1,707 | -13.49 | ||||
| 2025-07-31 | 13F | Oak Harbor Wealth Partners, Llc | 17,227 | 16.23 | 1,020 | 23.04 | ||||
| 2025-07-21 | 13F | Ameriflex Group, Inc. | 0 | -100.00 | 0 | |||||
| 2025-07-25 | 13F | Atria Wealth Solutions, Inc. | 0 | -100.00 | 0 | |||||
| 2025-08-13 | 13F | Elios Financial Group Inc. | 7,543 | 15.74 | 447 | 22.53 | ||||
| 2025-08-06 | 13F | Stone House Investment Management, LLC | 3,246 | 369.75 | 192 | 405.26 | ||||
| 2025-03-18 | 13F/A | Bank Of America Corp /de/ | 0 | -100.00 | 0 | |||||
| 2025-07-07 | 13F | Modus Advisors, LLC | 0 | -100.00 | 0 | |||||
| 2025-07-07 | 13F | Thurston, Springer, Miller, Herd & Titak, Inc. | 38 | 0.00 | 2 | 0.00 | ||||
| 2025-08-14 | 13F | Citadel Advisors Llc | 69,098 | 13.24 | 4,091 | 19.80 | ||||
| 2025-07-10 | 13F | Wealth Enhancement Advisory Services, Llc | 61,922 | -5.38 | 3,777 | 3.08 | ||||
| 2025-04-16 | 13F | Twin Peaks Wealth Advisors, LLC | 0 | -100.00 | 0 | |||||
| 2025-08-08 | 13F | Avantax Advisory Services, Inc. | 49,854 | 46.52 | 2,952 | 54.99 | ||||
| 2025-08-08 | 13F | Thoroughbred Financial Services, Llc | 0 | -100.00 | 0 | |||||
| 2025-07-25 | 13F | Cwm, Llc | 463,991 | 4.65 | 27 | 12.50 | ||||
| 2025-05-12 | 13F | Independent Advisor Alliance | 0 | -100.00 | 0 | |||||
| 2025-08-08 | 13F | Capital Investment Advisory Services, LLC | 53 | 60.61 | 3 | 200.00 | ||||
| 2025-07-29 | 13F | Private Trust Co Na | 5,268 | -4.48 | 312 | 0.97 | ||||
| 2025-08-12 | 13F | LPL Financial LLC | 1,976,433 | 12.98 | 117,025 | 19.50 | ||||
| 2025-07-16 | 13F | Strategic Investment Solutions, Inc. /IL | 216 | 0.00 | 13 | 0.00 | ||||
| 2025-08-08 | 13F | Creative Planning | 6,936 | 0.78 | 411 | 6.49 | ||||
| 2025-07-11 | 13F | Farther Finance Advisors, LLC | 409 | 24 | ||||||
| 2025-08-01 | 13F | Envestnet Asset Management Inc | 140,176 | 12.78 | 8,300 | 19.27 | ||||
| 2025-08-08 | 13F | Pnc Financial Services Group, Inc. | 0 | -100.00 | 0 | |||||
| 2025-08-26 | NP | ONCFX - JPMorgan Investor Conservative Growth Fund Class I | 623,255 | 3.61 | 36,903 | 9.59 | ||||
| 2025-07-25 | 13F | We Are One Seven, LLC | 8,083 | 1.67 | 479 | 7.42 | ||||
| 2025-08-14 | 13F | Raymond James Financial Inc | 408,759 | 18.20 | 24,203 | 25.02 | ||||
| 2025-07-21 | 13F | Triad Wealth Partners, LLC | 6,289 | -35.48 | 372 | -31.74 |