Mga Batayang Estadistika
| Pemilik Institusional | 104 total, 104 long only, 0 short only, 0 long/short - change of 19.54% MRQ |
| Alokasi Portofolio Rata-rata | 0.2675 % - change of 9.24% MRQ |
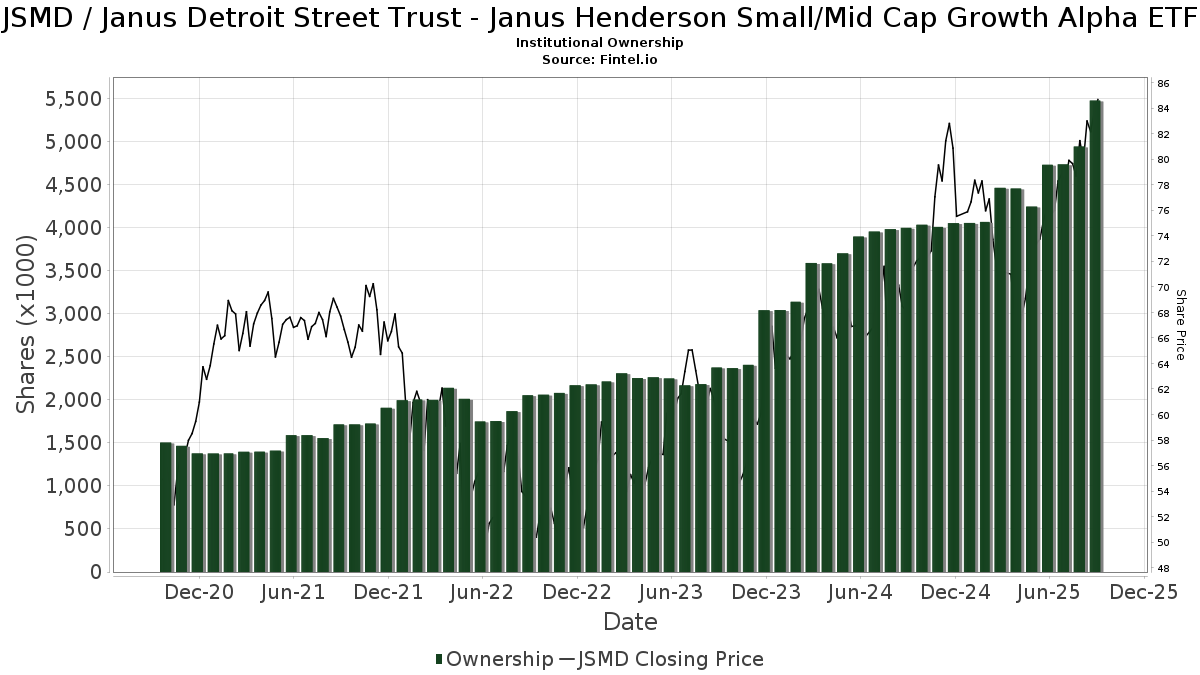
| Saham Institusional (Jangka Panjang) | 5,478,332 (ex 13D/G) - change of 0.75MM shares 15.76% MRQ |
| Nilai Institusional (Jangka Panjang) | $ 390,266 USD ($1000) |
Kepemilikan Institusional dan Pemegang Saham
Janus Detroit Street Trust - Janus Henderson Small/Mid Cap Growth Alpha ETF (US:JSMD) memiliki 104 pemilik institusional dan pemegang saham yang telah mengajukan formulir 13D/G atau 13F kepada Komisi Bursa Efek (Securities Exchange Commission/SEC). Lembaga-lembaga ini memegang total 5,478,332 saham. Pemegang saham terbesar meliputi Bank Of America Corp /de/, Morgan Stanley, LPL Financial LLC, Leelyn Smith, LLC, Cambridge Investment Research Advisors, Inc., Raymond James Financial Inc, Resonant Capital Advisors, LLC, Royal Bank Of Canada, Ameriprise Financial Inc, and Envestnet Asset Management Inc .
Struktur kepemilikan institusional Janus Detroit Street Trust - Janus Henderson Small/Mid Cap Growth Alpha ETF (NasdaqGM:JSMD) menunjukkan posisi terkini di perusahaan oleh institusi dan dana, serta perubahan terbaru dalam ukuran posisi. Pemegang saham utama dapat mencakup investor individu, reksa dana, dana lindung nilai, atau institusi. Jadwal 13D menunjukkan bahwa investor memegang (atau pernah memegang) lebih dari 5% saham perusahaan dan bermaksud (atau pernah bermaksud) untuk secara aktif mengejar perubahan strategi bisnis. Jadwal 13G menunjukkan investasi pasif lebih dari 5%.
The share price as of September 5, 2025 is 83.37 / share. Previously, on September 6, 2024, the share price was 66.99 / share. This represents an increase of 24.46% over that period.
Skor Sentimen Dana
Skor Sentimen Dana (sebelumnya dikenal sebagai Skor Akumulasi Kepemilikan) menemukan saham-saham yang paling banyak dibeli oleh dana. Ini adalah hasil dari model kuantitatif multi-faktor yang canggih yang mengidentifikasi perusahaan dengan tingkat akumulasi institusional tertinggi. Model penilaian menggunakan kombinasi dari total peningkatan pemilik yang diungkapkan, perubahan dalam alokasi portofolio pada pemilik tersebut, dan metrik lainnya. Angka berkisar dari 0 hingga 100, dengan angka yang lebih tinggi menunjukkan tingkat akumulasi yang lebih tinggi dibandingkan dengan perusahaan sejenisnya, dan 50 adalah rata-ratanya.
Frekuensi Pembaruan: Setiap Hari
Lihat Ownership Explorer, yang menyediakan daftar perusahaan dengan peringkat tertinggi.
Rasio Put/Call Institusional
Selain melaporkan isu ekuitas dan utang standar, institusi dengan aset di bawah manajemen lebih dari 100 juta dolar AS juga harus mengungkapkan kepemilikan opsi put dan call mereka. Karena opsi put umumnya menunjukkan sentimen negatif, dan opsi call menunjukkan sentimen positif, kita dapat mengetahui sentimen institusional secara keseluruhan dengan memplot rasio put terhadap call. Grafik di sebelah kanan memplot rasio put/call historis untuk instrumen ini.
Menggunakan Rasio Put/Call sebagai indikator sentimen investor mengatasi salah satu kekurangan utama dari penggunaan total kepemilikan institusional, yaitu sejumlah besar aset yang dikelola diinvestasikan secara pasif untuk melacak indeks. Dana yang dikelola secara pasif biasanya tidak membeli opsi, sehingga indikator rasio put/call lebih akurat dalam melacak sentimen dana yang dikelola secara aktif.
Pengajuan 13F dan NPORT
Detail pada pengajuan 13F tersedia gratis. Detail pada pengajuan NP memerlukan keanggotaan premium. Baris berwarna hijau menunjukkan posisi baru. Baris berwarna merah menunjukkan posisi yang sudah ditutup. Klik tautan ini ikon untuk melihat riwayat transaksi selengkapnya.
Tingkatkan
untuk membuka data premium dan mengekspor ke Excel ![]() .
.
| Tanggal File | Sumber | Investor | Ketik | Presyo ng Avg (Silangan) |
Saham | Δ Saham (%) |
Dilaporkan Nilai ($1000) |
Nilai Δ (%) |
Alokasi Port (%) |
|
|---|---|---|---|---|---|---|---|---|---|---|
| 2025-08-14 | 13F | Bank Of America Corp /de/ | 816,161 | -3.87 | 63,375 | 6.65 | ||||
| 2025-04-29 | 13F | DT Investment Partners, LLC | 0 | -100.00 | 0 | |||||
| 2025-07-17 | 13F | Worth Financial Advisory Group, LLC | 58,644 | 1.55 | 4,554 | 12.67 | ||||
| 2025-08-14 | 13F | Wells Fargo & Company/mn | 72 | 7,100.00 | 6 | |||||
| 2025-08-26 | NP | EVAGX - The E-Valuator Aggressive Growth (85%-99%) RMS Fund Service Class Shares | 39,460 | 3,064 | ||||||
| 2025-07-08 | 13F | Arlington Trust Co LLC | 370 | 0.00 | 29 | 12.00 | ||||
| 2025-08-14 | 13F | Ameriprise Financial Inc | 140,075 | 83.00 | 10,877 | 103.00 | ||||
| 2025-08-26 | NP | EVVLX - The E-Valuator Very Conservative (0%-15%) RMS Fund Service Class Shares | 1,035 | 80 | ||||||
| 2025-08-11 | 13F | NewEdge Wealth, LLC | 13,583 | -3.55 | 1,070 | 8.63 | ||||
| 2025-08-06 | 13F | AE Wealth Management LLC | 43 | 13.16 | 3 | 50.00 | ||||
| 2025-08-13 | 13F | IAG Wealth Partners, LLC | 31,114 | -3.29 | 2,416 | 7.33 | ||||
| 2025-07-23 | 13F | Horizon Advisory Services, Inc. | 6,316 | 8.32 | 490 | 20.10 | ||||
| 2025-07-31 | 13F | Cambridge Investment Research Advisors, Inc. | 297,621 | -0.87 | 23 | 9.52 | ||||
| 2025-08-26 | NP | EVMLX - The E-Valuator Moderate (50%-70%) RMS Fund Service Class Shares | 23,371 | 1,815 | ||||||
| 2025-08-14 | 13F | Peapack Gladstone Financial Corp | 23,339 | 682.93 | 2 | |||||
| 2025-07-09 | 13F | Breakwater Capital Group | 34,191 | 0.33 | 2,655 | 11.28 | ||||
| 2025-07-30 | 13F | Bogart Wealth, LLC | 155 | 0.00 | 12 | 20.00 | ||||
| 2025-08-05 | 13F | EPG Wealth Management LLC | 0 | -100.00 | 0 | |||||
| 2025-08-04 | 13F | IFG Advisory, LLC | 3,330 | -31.76 | 259 | -24.34 | ||||
| 2025-08-13 | 13F | Smith, Moore & Co. | 2,851 | 221 | ||||||
| 2025-07-10 | 13F | Secure Asset Management, LLC | 0 | -100.00 | 0 | |||||
| 2025-08-05 | 13F | Bank Of Montreal /can/ | 22 | 2 | ||||||
| 2025-07-24 | 13F | Us Bancorp \de\ | 1,691 | 0.00 | 131 | 11.02 | ||||
| 2025-07-17 | 13F | Janney Montgomery Scott LLC | 54,634 | 6.63 | 4 | 33.33 | ||||
| 2025-08-14 | 13F | Mml Investors Services, Llc | 2,795 | 0 | ||||||
| 2025-08-04 | 13F | Creative Financial Designs Inc /adv | 2,243 | 1.13 | 174 | 12.26 | ||||
| 2025-08-08 | 13F | New England Capital Financial Advisors LLC | 0 | -100.00 | 0 | |||||
| 2025-08-08 | 13F | Kingsview Wealth Management, LLC | 13,747 | -1.87 | 1,067 | 8.88 | ||||
| 2025-08-14 | 13F | Stifel Financial Corp | 85,932 | 6,673 | ||||||
| 2025-08-08 | 13F | Pnc Financial Services Group, Inc. | 0 | -100.00 | 0 | |||||
| 2025-08-11 | 13F | Cornerstone Planning Group LLC | 16 | 1 | ||||||
| 2025-08-04 | 13F | Assetmark, Inc | 66 | 5 | ||||||
| 2025-07-28 | 13F | Harbour Investments, Inc. | 708 | 0.00 | 55 | 10.20 | ||||
| 2025-07-17 | 13F | Independence Bank of Kentucky | 369 | 29 | ||||||
| 2025-08-14 | 13F | Royal Bank Of Canada | 143,292 | 20.90 | 11,127 | 34.14 | ||||
| 2025-07-07 | 13F | Investors Research Corp | 8,979 | 0.00 | 697 | 10.99 | ||||
| 2025-07-15 | 13F | McCarthy & Cox | 67,129 | 3.52 | 5,213 | 14.85 | ||||
| 2025-08-01 | 13F | Ashton Thomas Private Wealth, LLC | 11,764 | -0.03 | 913 | 10.94 | ||||
| 2025-07-11 | 13F | Pinnacle Bancorp, Inc. | 47 | 4 | ||||||
| 2025-08-06 | 13F | First Horizon Advisors, Inc. | 226 | 18 | ||||||
| 2025-08-11 | 13F | Principal Securities, Inc. | 19,720 | 1,531 | ||||||
| 2025-08-12 | 13F | Jpmorgan Chase & Co | 244 | 82.09 | 19 | 111.11 | ||||
| 2025-08-14 | 13F | UBS Group AG | 59,508 | 2.28 | 4,621 | 13.46 | ||||
| 2025-08-11 | 13F | Private Advisor Group, LLC | 78,145 | 11.09 | 6,068 | 23.24 | ||||
| 2025-08-12 | 13F | Global Retirement Partners, LLC | 1,003 | 78 | ||||||
| 2025-08-14 | 13F | Mariner, LLC | 62,187 | 3.55 | 4,829 | 14.87 | ||||
| 2025-07-21 | 13F | Ameritas Advisory Services, LLC | 8,804 | -31.60 | 684 | -25.19 | ||||
| 2025-08-12 | 13F | Gladstone Institutional Advisory LLC | 17,850 | 171.40 | 1,386 | 201.30 | ||||
| 2025-08-14 | 13F | Clark Capital Management Group, Inc. | 94,977 | 7,375 | ||||||
| 2025-08-14 | 13F | Comerica Bank | 8,908 | 9.76 | 692 | 21.65 | ||||
| 2025-08-18 | 13F | Geneos Wealth Management Inc. | 85 | 0.00 | 7 | 20.00 | ||||
| 2025-08-11 | 13F | Aptus Capital Advisors, LLC | 2,969 | 0.10 | 231 | 11.11 | ||||
| 2025-08-14 | 13F | Guardian Wealth Advisors, Llc / Nc | 2,969 | 0.10 | 231 | 11.11 | ||||
| 2025-07-24 | 13F | Capital Advisors, Ltd. LLC | 1,702 | 6.24 | 0 | |||||
| 2025-09-04 | 13F/A | Advisor Group Holdings, Inc. | 53,216 | 288.66 | 4,132 | 331.32 | ||||
| 2025-07-14 | 13F | Main Line Retirement Advisors, LLC | 3,520 | 273 | ||||||
| 2025-08-14 | 13F | Jane Street Group, Llc | 11,921 | -20.06 | 926 | -11.31 | ||||
| 2025-05-14 | 13F | Bnp Paribas Arbitrage, Sa | 0 | -100.00 | 0 | |||||
| 2025-08-14 | 13F | Raymond James Financial Inc | 296,929 | 2.16 | 23,057 | 13.34 | ||||
| 2025-08-07 | 13F | CENTRAL TRUST Co | 20,131 | 8.02 | 1,563 | 19.86 | ||||
| 2025-05-14 | 13F | Van Hulzen Asset Management, LLC | 0 | -100.00 | 0 | |||||
| 2025-08-19 | 13F | Advisory Services Network, LLC | 36,607 | 9.06 | 2,902 | 23.54 | ||||
| 2025-07-31 | 13F | Leelyn Smith, LLC | 361,166 | 2.20 | 28,045 | 13.39 | ||||
| 2025-07-29 | 13F | Altus Wealth Group LLC | 7,634 | 5.51 | 593 | 17.00 | ||||
| 2025-07-16 | 13F | Moisand Fitzgerald Tamayo, LLC | 37 | 0.00 | 3 | 0.00 | ||||
| 2025-08-26 | NP | EVGLX - The E-Valuator Growth (70%-85%) RMS Fund Service Class Shares | 41,337 | 3,210 | ||||||
| 2025-07-24 | 13F | Blair William & Co/il | 0 | -100.00 | 0 | |||||
| 2025-04-29 | 13F | Capital Investment Advisory Services, LLC | 0 | -100.00 | 0 | -100.00 | ||||
| 2025-08-05 | 13F | Fourth Dimension Wealth, LLC | 0 | -100.00 | 0 | |||||
| 2025-08-26 | NP | EVCLX - The E-Valuator Conservative (15%-30%) RMS Fund Service Class Shares | 3,086 | 240 | ||||||
| 2025-08-14 | 13F | Balanced Rock Investment Advisor | 6,264 | 486 | ||||||
| 2025-08-14 | 13F | Graney & King, LLC | 5,608 | -0.83 | 435 | 10.13 | ||||
| 2025-07-29 | 13F | Liberty Square Wealth Partners Llc | 2,672 | 207 | ||||||
| 2025-08-15 | 13F | Kestra Advisory Services, LLC | 5,322 | 57.04 | 413 | 74.26 | ||||
| 2025-08-11 | 13F | HighTower Advisors, LLC | 8,486 | 19.52 | 659 | 32.66 | ||||
| 2025-07-11 | 13F | Farther Finance Advisors, LLC | 5,166 | 8.26 | 401 | 20.42 | ||||
| 2025-08-04 | 13F | Arkadios Wealth Advisors | 7,035 | 3.09 | 546 | 14.47 | ||||
| 2025-08-06 | 13F | Golden State Wealth Management, LLC | 4,893 | 61.11 | 380 | 78.77 | ||||
| 2025-07-11 | 13F | SILVER OAK SECURITIES, Inc | 8,789 | 0.76 | 682 | 13.29 | ||||
| 2025-08-14 | 13F | Goldman Sachs Group Inc | 10,599 | 0.00 | 823 | 11.07 | ||||
| 2025-07-07 | 13F | Thurston, Springer, Miller, Herd & Titak, Inc. | 16,886 | 685.76 | 1,311 | 774.00 | ||||
| 2025-08-14 | 13F | Citadel Advisors Llc | 6,379 | 495 | ||||||
| 2025-07-31 | 13F | Resonant Capital Advisors, LLC | 234,772 | -0.47 | 18,248 | 10.47 | ||||
| 2025-04-23 | 13F | International Assets Investment Management, Llc | 0 | -100.00 | 0 | |||||
| 2025-07-29 | 13F | Stratos Wealth Partners, LTD. | 7,801 | 43.74 | 606 | 59.63 | ||||
| 2025-07-14 | 13F | Park Avenue Securities Llc | 9,944 | 1 | ||||||
| 2025-07-29 | 13F | AssuredPartners Investment Advisors, LLC | 6,810 | -72.32 | 529 | -69.34 | ||||
| 2025-05-20 | 13F | Blue Rock Wealth Management LLC | 44,276 | 2.11 | 3,099 | -4.82 | ||||
| 2025-08-14 | 13F | Susquehanna International Group, Llp | 14,948 | -16.93 | 1,161 | -7.86 | ||||
| 2025-08-13 | 13F | Townsquare Capital Llc | 0 | -100.00 | 0 | |||||
| 2025-07-28 | 13F | Wealthspan Partners, Llc | 4,341 | -20.20 | 337 | -11.32 | ||||
| 2025-07-29 | 13F | Private Trust Co Na | 928 | 32.76 | 72 | 50.00 | ||||
| 2025-08-07 | 13F | Allworth Financial LP | 133 | 0.00 | 10 | 11.11 | ||||
| 2025-07-24 | 13F | Trust Co Of Toledo Na /oh/ | 173 | 13 | ||||||
| 2025-08-13 | 13F | Northwestern Mutual Wealth Management Co | 29,205 | 489.40 | 2,268 | 555.20 | ||||
| 2025-07-15 | 13F | Norden Group Llc | 3,798 | -79.04 | 295 | -76.81 | ||||
| 2025-08-06 | 13F | Commonwealth Equity Services, Llc | 43,410 | 4.28 | 3 | 50.00 | ||||
| 2025-08-08 | 13F | Avantax Advisory Services, Inc. | 45,332 | -12.92 | 3,520 | -3.38 | ||||
| 2025-08-14 | 13F | Fmr Llc | 1,215 | -6.54 | 94 | 4.44 | ||||
| 2025-08-05 | 13F | Pacific Wealth Strategies Group, Inc. | 0 | -100.00 | 0 | |||||
| 2025-08-08 | 13F | Comprehensive Financial Planning, Inc./PA | 55 | 0.00 | 4 | 33.33 | ||||
| 2025-08-01 | 13F | Envestnet Asset Management Inc | 125,376 | 519.66 | 9,735 | 587.50 | ||||
| 2025-08-11 | 13F | Wealthspire Advisors, LLC | 25,982 | -10.85 | 2,018 | -1.08 | ||||
| 2025-08-12 | 13F | LPL Financial LLC | 655,206 | 21.59 | 50,877 | 34.90 | ||||
| 2025-08-14 | 13F | GWM Advisors LLC | 5,141 | 1,964.66 | 399 | 2,247.06 | ||||
| 2025-07-10 | 13F | Wealth Enhancement Advisory Services, Llc | 38,140 | -17.20 | 3,024 | -6.20 | ||||
| 2025-08-07 | 13F | PFG Advisors | 6,535 | -3.23 | 507 | 7.42 | ||||
| 2025-06-30 | NP | Northern Lights Fund Trust - PFG Janus Henderson(R) Balanced Strategy Class R Shares | 117,510 | 2.77 | 8,121 | -8.78 | ||||
| 2025-08-12 | 13F | Proequities, Inc. | 0 | 0 | ||||||
| 2025-08-14 | 13F | IHT Wealth Management, LLC | 10,343 | 803 | ||||||
| 2025-08-26 | NP | EVTTX - The E-Valuator Conservative/Moderate (30%-50%) RMS Fund Service Class Shares | 3,136 | 244 | ||||||
| 2025-08-15 | 13F | Morgan Stanley | 698,179 | -11.34 | 54,214 | -1.64 | ||||
| 2025-08-12 | 13F | Steward Partners Investment Advisory, Llc | 7 | 1 | ||||||
| 2025-08-08 | 13F | Cetera Investment Advisers | 33,557 | 668.60 | 2,606 | 754.10 | ||||
| 2025-08-12 | 13F | Bokf, Na | 535 | 0.00 | 42 | 10.81 | ||||
| 2025-06-30 | NP | PFTSX - PFG Tactical Income Strategy Fund Class R Shares | 31,323 | 5.41 | 2,165 | -6.44 | ||||
| 2025-07-29 | 13F | Systelligence, LLC | 111,425 | 8,652 | ||||||
| 2025-07-16 | 13F | Signaturefd, Llc | 0 | -100.00 | 0 | |||||
| 2025-07-24 | 13F | IFP Advisors, Inc | 651 | 0.00 | 51 | 11.11 |