Mga Batayang Estadistika
| Pemilik Institusional | 79 total, 78 long only, 0 short only, 1 long/short - change of 6.76% MRQ |
| Alokasi Portofolio Rata-rata | 0.1228 % - change of % MRQ |
| Saham Institusional (Jangka Panjang) | 6,151,241 (ex 13D/G) - change of -0.64MM shares -9.37% MRQ |
| Nilai Institusional (Jangka Panjang) | $ 81,226 USD ($1000) |
Kepemilikan Institusional dan Pemegang Saham
Invesco Exchange-Traded Fund Trust II - Invesco KBW High Dividend Yield Financial ETF (US:KBWD) memiliki 79 pemilik institusional dan pemegang saham yang telah mengajukan formulir 13D/G atau 13F kepada Komisi Bursa Efek (Securities Exchange Commission/SEC). Lembaga-lembaga ini memegang total 6,151,241 saham. Pemegang saham terbesar meliputi LPL Financial LLC, Morgan Stanley, Mission Hills Financial Advisory, LLC, Bank Of America Corp /de/, Wells Fargo & Company/mn, Gradient Investments LLC, ERNZ - TrueShares Active Yield ETF, Raymond James Financial Inc, UBS Group AG, and Commonwealth Equity Services, Llc .
Struktur kepemilikan institusional Invesco Exchange-Traded Fund Trust II - Invesco KBW High Dividend Yield Financial ETF (NasdaqGM:KBWD) menunjukkan posisi terkini di perusahaan oleh institusi dan dana, serta perubahan terbaru dalam ukuran posisi. Pemegang saham utama dapat mencakup investor individu, reksa dana, dana lindung nilai, atau institusi. Jadwal 13D menunjukkan bahwa investor memegang (atau pernah memegang) lebih dari 5% saham perusahaan dan bermaksud (atau pernah bermaksud) untuk secara aktif mengejar perubahan strategi bisnis. Jadwal 13G menunjukkan investasi pasif lebih dari 5%.
The share price as of September 5, 2025 is 14.38 / share. Previously, on September 6, 2024, the share price was 15.10 / share. This represents a decline of 4.77% over that period.

Skor Sentimen Dana
Skor Sentimen Dana (sebelumnya dikenal sebagai Skor Akumulasi Kepemilikan) menemukan saham-saham yang paling banyak dibeli oleh dana. Ini adalah hasil dari model kuantitatif multi-faktor yang canggih yang mengidentifikasi perusahaan dengan tingkat akumulasi institusional tertinggi. Model penilaian menggunakan kombinasi dari total peningkatan pemilik yang diungkapkan, perubahan dalam alokasi portofolio pada pemilik tersebut, dan metrik lainnya. Angka berkisar dari 0 hingga 100, dengan angka yang lebih tinggi menunjukkan tingkat akumulasi yang lebih tinggi dibandingkan dengan perusahaan sejenisnya, dan 50 adalah rata-ratanya.
Frekuensi Pembaruan: Setiap Hari
Lihat Ownership Explorer, yang menyediakan daftar perusahaan dengan peringkat tertinggi.
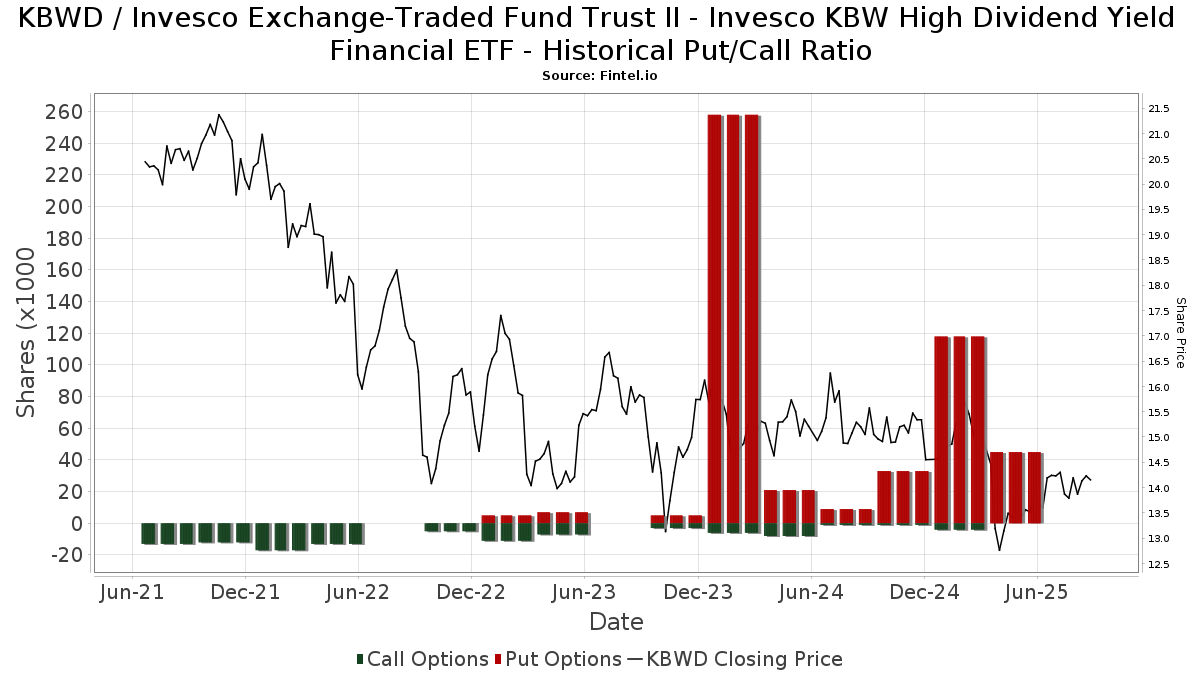
Rasio Put/Call Institusional
Selain melaporkan isu ekuitas dan utang standar, institusi dengan aset di bawah manajemen lebih dari 100 juta dolar AS juga harus mengungkapkan kepemilikan opsi put dan call mereka. Karena opsi put umumnya menunjukkan sentimen negatif, dan opsi call menunjukkan sentimen positif, kita dapat mengetahui sentimen institusional secara keseluruhan dengan memplot rasio put terhadap call. Grafik di sebelah kanan memplot rasio put/call historis untuk instrumen ini.
Menggunakan Rasio Put/Call sebagai indikator sentimen investor mengatasi salah satu kekurangan utama dari penggunaan total kepemilikan institusional, yaitu sejumlah besar aset yang dikelola diinvestasikan secara pasif untuk melacak indeks. Dana yang dikelola secara pasif biasanya tidak membeli opsi, sehingga indikator rasio put/call lebih akurat dalam melacak sentimen dana yang dikelola secara aktif.
Pengajuan 13F dan NPORT
Detail pada pengajuan 13F tersedia gratis. Detail pada pengajuan NP memerlukan keanggotaan premium. Baris berwarna hijau menunjukkan posisi baru. Baris berwarna merah menunjukkan posisi yang sudah ditutup. Klik tautan ini ikon untuk melihat riwayat transaksi selengkapnya.
Tingkatkan
untuk membuka data premium dan mengekspor ke Excel ![]() .
.
| Tanggal File | Sumber | Investor | Ketik | Presyo ng Avg (Silangan) |
Saham | Δ Saham (%) |
Dilaporkan Nilai ($1000) |
Nilai Δ (%) |
Alokasi Port (%) |
|
|---|---|---|---|---|---|---|---|---|---|---|
| 2025-07-08 | 13F | Gradient Investments LLC | 523,842 | 8.31 | 7,266 | 3.96 | ||||
| 2025-08-15 | 13F | Tower Research Capital LLC (TRC) | 24,236 | 336 | ||||||
| 2025-08-14 | 13F | Raymond James Financial Inc | 161,894 | 229.26 | 2,245 | 216.20 | ||||
| 2025-07-17 | 13F | Janney Montgomery Scott LLC | 16,260 | -5.85 | 0 | |||||
| 2025-08-07 | 13F | Parkside Financial Bank & Trust | 0 | -100.00 | 0 | |||||
| 2025-08-01 | 13F | Rossby Financial, LCC | 1,631 | 0.00 | 23 | 4.76 | ||||
| 2025-08-12 | 13F | Founders Financial Alliance, LLC | 7,520 | 0.00 | 104 | -3.70 | ||||
| 2025-07-21 | 13F | Ameritas Advisory Services, LLC | 3,611 | 50 | ||||||
| 2025-07-25 | 13F | We Are One Seven, LLC | 10,716 | 0.00 | 149 | -3.90 | ||||
| 2025-08-14 | 13F | Bnp Paribas Arbitrage, Sa | 22 | 0 | ||||||
| 2025-08-14 | 13F | Qube Research & Technologies Ltd | 582 | 8 | ||||||
| 2025-08-14 | 13F | Wiley Bros.-aintree Capital, Llc | 10,121 | 0.01 | 140 | -3.45 | ||||
| 2025-08-05 | 13F | Simplex Trading, Llc | 2,986 | 0 | ||||||
| 2025-08-12 | 13F | Global Retirement Partners, LLC | 727 | -11.34 | 10 | -16.67 | ||||
| 2025-08-12 | 13F | Change Path, LLC | 14,330 | -50.60 | 199 | -52.74 | ||||
| 2025-08-14 | 13F | Mml Investors Services, Llc | 28,716 | 4.55 | 0 | |||||
| 2025-08-12 | 13F | BlackRock, Inc. | 1,325 | 0.00 | 18 | -5.26 | ||||
| 2025-05-15 | 13F | Talon Private Wealth, LLC | 0 | -100.00 | 0 | -100.00 | ||||
| 2025-07-28 | 13F | Harbour Investments, Inc. | 1,074 | 15 | ||||||
| 2025-08-04 | 13F | Adell Harriman & Carpenter Inc | 13,000 | -18.75 | 180 | -22.08 | ||||
| 2025-08-06 | 13F | Commonwealth Equity Services, Llc | 115,799 | -11.07 | 2 | 0.00 | ||||
| 2025-08-15 | 13F | Morgan Stanley | 858,980 | -7.70 | 11,914 | -11.40 | ||||
| 2025-08-14 | 13F | UBS Group AG | 140,165 | 2.68 | 1,944 | -1.42 | ||||
| 2025-08-08 | 13F | Capital Investment Advisory Services, LLC | 1,812 | 25 | ||||||
| 2025-07-30 | 13F | IMG Wealth Management, Inc. | 1,362 | 13.22 | 19 | 5.88 | ||||
| 2025-04-22 | 13F | Castleview Partners, Llc | 0 | -100.00 | 0 | |||||
| 2025-08-14 | 13F | Comerica Bank | 7,564 | -15.84 | 105 | -19.38 | ||||
| 2025-08-13 | 13F | EverSource Wealth Advisors, LLC | 590 | 0.00 | 8 | 0.00 | ||||
| 2025-05-12 | 13F | Providence First Trust Co | 0 | -100.00 | 0 | |||||
| 2025-08-04 | 13F | Kovack Advisors, Inc. | 12,080 | 0.00 | 168 | -4.02 | ||||
| 2025-05-12 | 13F | National Bank Of Canada /fi/ | 0 | -100.00 | 0 | -100.00 | ||||
| 2025-08-14 | 13F | Two Sigma Investments, Lp | 0 | -100.00 | 0 | |||||
| 2025-07-23 | 13F | Kingswood Wealth Advisors, Llc | 42,441 | 47.64 | 589 | 41.69 | ||||
| 2025-08-08 | 13F | Advyzon Investment Management, LLC | 10,838 | 3.26 | 150 | -0.66 | ||||
| 2025-08-13 | 13F | GeoWealth Management, LLC | 0 | -100.00 | 0 | |||||
| 2025-07-25 | 13F | Cwm, Llc | 28,846 | 3.90 | 0 | |||||
| 2025-07-11 | 13F | Farther Finance Advisors, LLC | 10,181 | 7.59 | 141 | 2.92 | ||||
| 2025-07-29 | 13F | TrueMark Investments, LLC | 0 | -100.00 | 0 | |||||
| 2025-08-14 | 13F | MGB Wealth Management, LLC | 275 | -26.67 | 4 | -40.00 | ||||
| 2025-08-12 | 13F | Waterloo Capital, L.P. | 27,719 | 0.00 | 384 | -4.00 | ||||
| 2025-08-14 | 13F | Citadel Advisors Llc | Put | 45,700 | -61.27 | 634 | -62.87 | |||
| 2025-07-25 | 13F | Atria Wealth Solutions, Inc. | 54,812 | 10.46 | 760 | 6.00 | ||||
| 2025-08-14 | 13F | Citadel Advisors Llc | 13,458 | 58.03 | 187 | 51.22 | ||||
| 2025-08-14 | 13F | Mpwm Advisory Solutions, Llc | 5,600 | 0.00 | 78 | -3.75 | ||||
| 2025-07-24 | 13F | IFP Advisors, Inc | 19,628 | 9.07 | 272 | 4.62 | ||||
| 2025-08-12 | 13F | Jpmorgan Chase & Co | 14,479 | -13.92 | 201 | -17.70 | ||||
| 2025-08-06 | 13F | AE Wealth Management LLC | 1,313 | -0.15 | 18 | -5.26 | ||||
| 2025-07-09 | 13F | Triumph Capital Management | 41,785 | 9.67 | 580 | 5.27 | ||||
| 2025-09-04 | 13F/A | Advisor Group Holdings, Inc. | 35,767 | -14.96 | 496 | -18.29 | ||||
| 2025-05-08 | NP | QALTX - Quantified Alternative Investment Fund Investor Class Shares | 0 | -100.00 | 0 | -100.00 | ||||
| 2025-07-25 | 13F | Endowment Wealth Management, Inc. | 41,152 | 13.63 | 571 | 8.99 | ||||
| 2025-08-13 | 13F | Rsm Us Wealth Management Llc | 45,714 | -20.90 | 634 | -24.07 | ||||
| 2025-07-30 | 13F | Brookstone Capital Management | 30,419 | -17.19 | 422 | -20.57 | ||||
| 2025-08-14 | 13F | GWM Advisors LLC | 756 | 1.20 | 10 | 0.00 | ||||
| 2025-08-14 | 13F | Smartleaf Asset Management LLC | 800 | 11 | ||||||
| 2025-05-08 | 13F | Us Bancorp \de\ | 0 | -100.00 | 0 | |||||
| 2025-08-14 | 13F | Wells Fargo & Company/mn | 529,778 | -48.95 | 7,348 | -51.00 | ||||
| 2025-07-29 | 13F | Stratos Wealth Partners, LTD. | 10,083 | 140 | ||||||
| 2025-08-14 | 13F/A | Rockefeller Capital Management L.P. | 35,665 | 3.38 | 495 | -0.80 | ||||
| 2025-04-22 | 13F | Prairie Wealth Advisors, Inc. | 0 | -100.00 | 0 | -100.00 | ||||
| 2025-08-08 | 13F | Avantax Advisory Services, Inc. | 14,456 | 4.88 | 201 | 0.50 | ||||
| 2025-08-08 | 13F | Pnc Financial Services Group, Inc. | 93,300 | 0.00 | 1,294 | -4.01 | ||||
| 2025-08-13 | 13F | Jones Financial Companies Lllp | 200 | 0.00 | 3 | 0.00 | ||||
| 2025-08-14 | 13F | Harvest Investment Services, LLC | 64,260 | 1.10 | 891 | -2.94 | ||||
| 2025-08-14 | 13F | Jane Street Group, Llc | 37,108 | 515 | ||||||
| 2025-07-10 | 13F | Oliver Lagore Vanvalin Investment Group | 2,400 | 0.00 | 35 | -2.86 | ||||
| 2025-05-09 | 13F | TD Waterhouse Canada Inc. | 0 | -100.00 | 0 | |||||
| 2025-07-16 | 13F | ORG Partners LLC | 0 | -100.00 | 0 | |||||
| 2025-05-06 | 13F | Advisors Preferred, LLC | 0 | -100.00 | 0 | |||||
| 2025-07-31 | 13F | Cambridge Investment Research Advisors, Inc. | 110,874 | 4.23 | 2 | 0.00 | ||||
| 2025-08-05 | 13F | Tsfg, Llc | 1,200 | 0.00 | 0 | |||||
| 2025-08-15 | 13F | WFA of San Diego, LLC | 2,400 | -48.11 | 33 | -52.86 | ||||
| 2025-07-21 | 13F | DHJJ Financial Advisors, Ltd. | 23 | 0.00 | 0 | |||||
| 2025-08-12 | 13F | LPL Financial LLC | 925,509 | 8.16 | 12,837 | 3.82 | ||||
| 2025-08-11 | 13F | Citigroup Inc | 800 | 0.00 | 11 | 0.00 | ||||
| 2025-08-11 | 13F | Principal Securities, Inc. | 87 | -64.49 | 1 | -66.67 | ||||
| 2025-07-28 | 13F | Mission Hills Financial Advisory, LLC | 649,190 | 22.95 | 9,004 | 18.02 | ||||
| 2025-08-14 | 13F | Citadel Advisors Llc | Call | 0 | -100.00 | 0 | ||||
| 2025-08-14 | 13F | CoreCap Advisors, LLC | 4,500 | 0.00 | 62 | -4.62 | ||||
| 2025-08-18 | 13F | Geneos Wealth Management Inc. | 138 | 0.00 | 2 | 0.00 | ||||
| 2025-08-08 | 13F | Good Life Advisors, LLC | 29,442 | 57.64 | 408 | 51.67 | ||||
| 2025-08-15 | 13F | Equitable Holdings, Inc. | 85,878 | 33.23 | 1,191 | 27.93 | ||||
| 2025-05-15 | 13F | Bnp Paribas | 0 | -100.00 | 0 | |||||
| 2025-07-17 | 13F | Sound Income Strategies, LLC | 100 | 0.00 | 1 | 0.00 | ||||
| 2025-08-14 | 13F | Royal Bank Of Canada | 18,818 | 9.78 | 261 | 5.24 | ||||
| 2025-04-09 | 13F | RFG Advisory, LLC | 0 | -100.00 | 0 | |||||
| 2025-08-14 | 13F | Fmr Llc | 226 | -55.95 | 3 | -57.14 | ||||
| 2025-08-08 | 13F | Cetera Investment Advisers | 47,041 | 39.85 | 652 | 34.16 | ||||
| 2025-05-14 | 13F | Northwestern Mutual Wealth Management Co | 0 | -100.00 | 0 | |||||
| 2025-08-12 | 13F | Proequities, Inc. | 0 | 0 | ||||||
| 2025-08-19 | 13F | National Asset Management, Inc. | 24,646 | 342 | ||||||
| 2025-07-29 | 13F | Koshinski Asset Management, Inc. | 18,221 | -0.26 | 253 | -4.18 | ||||
| 2025-07-29 | 13F | Mattson Financial Services, LLC | 0 | -100.00 | 0 | |||||
| 2025-07-29 | 13F | Private Trust Co Na | 651 | 0.00 | 9 | 0.00 | ||||
| 2025-07-30 | 13F | Cullen/frost Bankers, Inc. | 36,861 | -3.88 | 511 | -7.76 | ||||
| 2025-03-12 | 13F | Centaurus Financial, Inc. | 0 | -100.00 | 0 | |||||
| 2025-05-30 | NP | ERNZ - TrueShares Active Yield ETF | 280,134 | 4,048 | ||||||
| 2025-08-08 | 13F | Thrive Capital Management, LLC | 80,795 | 1,121 | ||||||
| 2025-08-04 | 13F | Integrity Alliance, Llc. | 0 | -100.00 | 0 | |||||
| 2025-08-14 | 13F | Bank Of America Corp /de/ | 543,336 | -9.43 | 7,536 | -13.06 | ||||
| 2025-08-01 | 13F | Envestnet Asset Management Inc | 32,298 | 212.30 | 448 | 200.00 | ||||
| 2025-08-12 | 13F | Winnow Wealth Llc | 0 | -100.00 | 0 | -100.00 | ||||
| 2025-05-13 | 13F | Russell Investments Group, Ltd. | 0 | -100.00 | 0 | |||||
| 2025-07-14 | 13F | U.S. Capital Wealth Advisors, LLC | 83,895 | -0.30 | 1,164 | -4.28 |