Mga Batayang Estadistika
| Pemilik Institusional | 81 total, 80 long only, 0 short only, 1 long/short - change of -3.53% MRQ |
| Alokasi Portofolio Rata-rata | 0.5364 % - change of -7.82% MRQ |
| Saham Institusional (Jangka Panjang) | 4,884,484 (ex 13D/G) - change of -1.04MM shares -17.56% MRQ |
| Nilai Institusional (Jangka Panjang) | $ 253,505 USD ($1000) |
Kepemilikan Institusional dan Pemegang Saham
PIMCO ETF Trust - PIMCO 15+ Year U.S. TIPS Index Exchange-Traded Fund (US:LTPZ) memiliki 81 pemilik institusional dan pemegang saham yang telah mengajukan formulir 13D/G atau 13F kepada Komisi Bursa Efek (Securities Exchange Commission/SEC). Lembaga-lembaga ini memegang total 4,884,484 saham. Pemegang saham terbesar meliputi Evoke Wealth, Llc, CENTRAL TRUST Co, Wells Fargo & Company/mn, Northern Trust Corp, GDMA - Gadsden Dynamic Multi-Asset ETF, Avos Capital Management, LLC, Wealthedge Investment Advisors, Llc, Mid-American Wealth Advisory Group, Inc., Sovran Advisors, LLC, and Fermata Advisors, LLC .
Struktur kepemilikan institusional PIMCO ETF Trust - PIMCO 15+ Year U.S. TIPS Index Exchange-Traded Fund (ARCA:LTPZ) menunjukkan posisi terkini di perusahaan oleh institusi dan dana, serta perubahan terbaru dalam ukuran posisi. Pemegang saham utama dapat mencakup investor individu, reksa dana, dana lindung nilai, atau institusi. Jadwal 13D menunjukkan bahwa investor memegang (atau pernah memegang) lebih dari 5% saham perusahaan dan bermaksud (atau pernah bermaksud) untuk secara aktif mengejar perubahan strategi bisnis. Jadwal 13G menunjukkan investasi pasif lebih dari 5%.
The share price as of September 5, 2025 is 52.86 / share. Previously, on September 9, 2024, the share price was 57.49 / share. This represents a decline of 8.05% over that period.

Skor Sentimen Dana
Skor Sentimen Dana (sebelumnya dikenal sebagai Skor Akumulasi Kepemilikan) menemukan saham-saham yang paling banyak dibeli oleh dana. Ini adalah hasil dari model kuantitatif multi-faktor yang canggih yang mengidentifikasi perusahaan dengan tingkat akumulasi institusional tertinggi. Model penilaian menggunakan kombinasi dari total peningkatan pemilik yang diungkapkan, perubahan dalam alokasi portofolio pada pemilik tersebut, dan metrik lainnya. Angka berkisar dari 0 hingga 100, dengan angka yang lebih tinggi menunjukkan tingkat akumulasi yang lebih tinggi dibandingkan dengan perusahaan sejenisnya, dan 50 adalah rata-ratanya.
Frekuensi Pembaruan: Setiap Hari
Lihat Ownership Explorer, yang menyediakan daftar perusahaan dengan peringkat tertinggi.
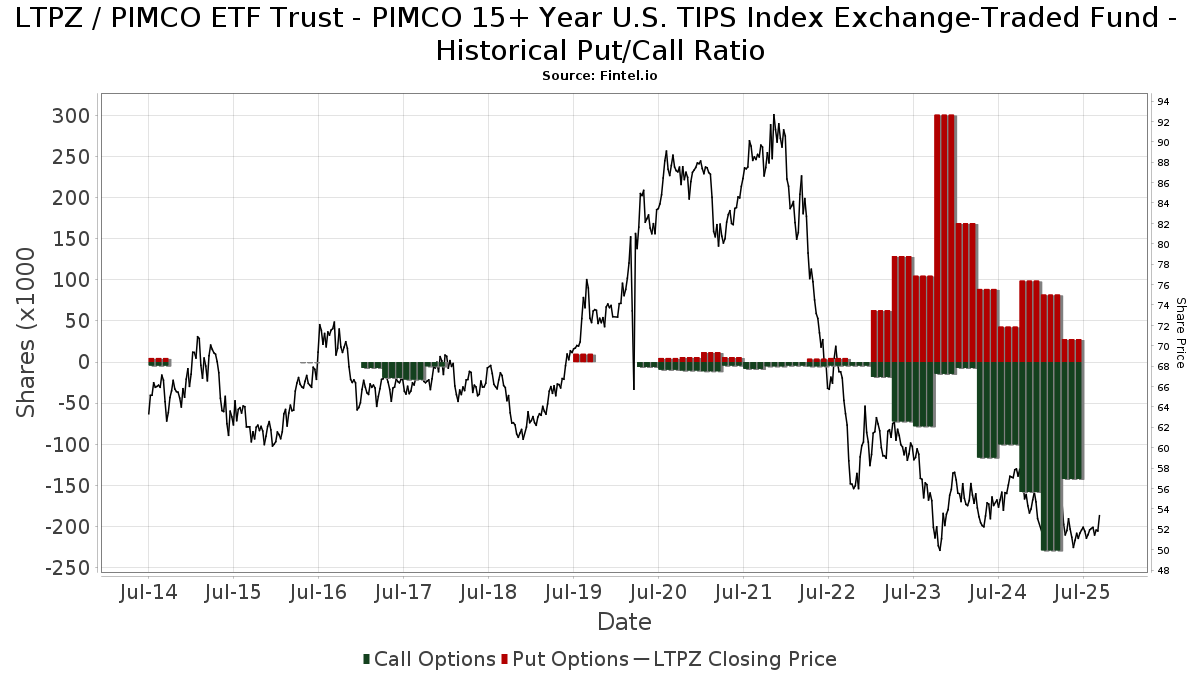
Rasio Put/Call Institusional
Selain melaporkan isu ekuitas dan utang standar, institusi dengan aset di bawah manajemen lebih dari 100 juta dolar AS juga harus mengungkapkan kepemilikan opsi put dan call mereka. Karena opsi put umumnya menunjukkan sentimen negatif, dan opsi call menunjukkan sentimen positif, kita dapat mengetahui sentimen institusional secara keseluruhan dengan memplot rasio put terhadap call. Grafik di sebelah kanan memplot rasio put/call historis untuk instrumen ini.
Menggunakan Rasio Put/Call sebagai indikator sentimen investor mengatasi salah satu kekurangan utama dari penggunaan total kepemilikan institusional, yaitu sejumlah besar aset yang dikelola diinvestasikan secara pasif untuk melacak indeks. Dana yang dikelola secara pasif biasanya tidak membeli opsi, sehingga indikator rasio put/call lebih akurat dalam melacak sentimen dana yang dikelola secara aktif.
Pengajuan 13F dan NPORT
Detail pada pengajuan 13F tersedia gratis. Detail pada pengajuan NP memerlukan keanggotaan premium. Baris berwarna hijau menunjukkan posisi baru. Baris berwarna merah menunjukkan posisi yang sudah ditutup. Klik tautan ini ikon untuk melihat riwayat transaksi selengkapnya.
Tingkatkan
untuk membuka data premium dan mengekspor ke Excel ![]() .
.
| Tanggal File | Sumber | Investor | Ketik | Presyo ng Avg (Silangan) |
Saham | Δ Saham (%) |
Dilaporkan Nilai ($1000) |
Nilai Δ (%) |
Alokasi Port (%) |
|
|---|---|---|---|---|---|---|---|---|---|---|
| 2025-08-13 | 13F | Northern Trust Corp | 346,475 | 11.17 | 18,180 | 6.36 | ||||
| 2025-05-12 | 13F | Richard W. Paul & Associates, LLC | 0 | -100.00 | 0 | -100.00 | ||||
| 2025-08-14 | 13F | Goldman Sachs Group Inc | 9,246 | 0.00 | 485 | -4.34 | ||||
| 2025-07-08 | 13F | Parallel Advisors, LLC | 169 | 0.00 | 9 | -11.11 | ||||
| 2025-08-14 | 13F | Fmr Llc | 0 | -100.00 | 0 | |||||
| 2025-08-14 | 13F | Private Wealth Advisors, LLC | 48,918 | 2.90 | 2,567 | -1.57 | ||||
| 2025-08-01 | 13F | Envestnet Asset Management Inc | 44,335 | 34.39 | 2,326 | 28.58 | ||||
| 2025-04-23 | 13F | B.O.S.S. Retirement Advisors, LLC | 0 | -100.00 | 0 | -100.00 | ||||
| 2025-05-19 | 13F | Heck Capital Advisors, LLC | 0 | -100.00 | 0 | -100.00 | ||||
| 2025-08-12 | 13F | Steward Partners Investment Advisory, Llc | 93 | 2.20 | 5 | 0.00 | ||||
| 2025-07-29 | 13F | Salomon & Ludwin, LLC | 1,404 | 73 | ||||||
| 2025-05-30 | NP | GDMA - Gadsden Dynamic Multi-Asset ETF | 285,894 | 15,678 | ||||||
| 2025-07-11 | 13F | Vanguard Capital Wealth Advisors This fund is a listed as child fund of Vanguard Group Inc and if that institution has disclosed ownership in this security, then these positions will not be double counted when calculating total shares and total value | 10,247 | 538 | ||||||
| 2025-07-31 | 13F | Buckingham Strategic Partners | 18,519 | -8.88 | 972 | -12.84 | ||||
| 2025-08-14 | 13F | Susquehanna International Group, Llp | Call | 109,200 | -35.95 | 5,730 | -38.73 | |||
| 2025-08-14 | 13F | Susquehanna International Group, Llp | Put | 28,800 | -55.62 | 1,511 | -57.54 | |||
| 2025-07-31 | 13F | GenTrust, LLC | 8,232 | -98.69 | 432 | -98.75 | ||||
| 2025-07-14 | 13F | Proathlete Wealth Management Llc | 174 | 0.00 | 9 | 0.00 | ||||
| 2025-08-08 | 13F | Cetera Investment Advisers | 15,140 | 0.69 | 794 | -3.64 | ||||
| 2025-04-30 | 13F | Allworth Financial LP | 0 | -100.00 | 0 | |||||
| 2025-07-24 | 13F | Forefront Analytics, LLC | 0 | -100.00 | 0 | |||||
| 2025-08-14 | 13F | UBS Group AG | 56,058 | -15.84 | 2,941 | -19.47 | ||||
| 2025-05-12 | 13F | Jpmorgan Chase & Co | 0 | -100.00 | 0 | -100.00 | ||||
| 2025-05-15 | 13F | MidWestOne Financial Group, Inc. | 0 | -100.00 | 0 | |||||
| 2025-07-17 | 13F | Nelson, Van Denburg & Campbell Wealth Management Group, LLC | 7,090 | -10.64 | 372 | -14.48 | ||||
| 2025-08-14 | 13F | Mml Investors Services, Llc | 22,567 | 1.26 | 1 | 0.00 | ||||
| 2025-08-08 | 13F | Tortoise Investment Management, LLC | 49,639 | 1,963.99 | 2,605 | 1,887.79 | ||||
| 2025-08-14 | 13F | Hirtle Callaghan & Co LLC | 2,955 | -4.31 | ||||||
| 2025-08-08 | 13F | Gts Securities Llc | 14,444 | -3.57 | 758 | -7.80 | ||||
| 2025-08-08 | 13F | Altfest L J & Co Inc | 64,783 | 3,399 | ||||||
| 2025-08-01 | 13F | Redwood Park Advisors LLC | 146 | 0.69 | 8 | 0.00 | ||||
| 2025-08-05 | 13F | Lord & Richards Wealth Management, LLC | 0 | -100.00 | 0 | |||||
| 2025-08-13 | 13F | Global Endowment Management, LP | 30,000 | 1,574 | ||||||
| 2025-08-12 | 13F | Park Square Financial Group, LLC | 138 | 48.39 | 7 | 40.00 | ||||
| 2025-04-23 | 13F | Bessemer Group Inc | 0 | -100.00 | 0 | |||||
| 2025-08-14 | 13F | Raymond James Financial Inc | 11,446 | -29.55 | 601 | -32.58 | ||||
| 2025-07-24 | 13F | Us Bancorp \de\ | 0 | -100.00 | 0 | |||||
| 2025-08-11 | 13F | Citigroup Inc | 0 | -100.00 | 0 | |||||
| 2025-08-14 | 13F | Citadel Advisors Llc | Call | 33,400 | -42.91 | 1,752 | -45.39 | |||
| 2025-08-04 | 13F | IFG Advisory, LLC | 8,419 | 11.60 | 442 | 6.78 | ||||
| 2025-04-21 | 13F | LifeWealth Investments, LLC | 0 | -100.00 | 0 | |||||
| 2025-05-15 | 13F | Paragon Private Wealth Management, LLC | 0 | -100.00 | 0 | |||||
| 2025-08-11 | 13F | Principal Securities, Inc. | 144 | 0.00 | 8 | 0.00 | ||||
| 2025-07-10 | 13F | Focus Financial Network, Inc. | 0 | -100.00 | 0 | |||||
| 2025-04-30 | 13F | Pineridge Advisors LLC | 0 | -100.00 | 0 | |||||
| 2025-07-10 | 13F | Sovran Advisors, LLC | 161,861 | -2.76 | 8,310 | -3.24 | ||||
| 2025-07-28 | 13F | Harbour Investments, Inc. | 0 | -100.00 | 0 | -100.00 | ||||
| 2025-08-11 | 13F | Addison Capital Co | 3,814 | -0.21 | 200 | -4.31 | ||||
| 2025-07-25 | 13F | Almanack Investment Partners, LLC. | 0 | -100.00 | 0 | |||||
| 2025-08-13 | 13F | Transce3nd, LLC | 167 | 15.17 | 9 | 14.29 | ||||
| 2025-07-09 | 13F | Dynamic Advisor Solutions LLC | 11,946 | 46.27 | 627 | 40.04 | ||||
| 2025-07-15 | 13F | CHB Investment Group, LLC | 40,240 | 3.20 | 2 | 0.00 | ||||
| 2025-07-15 | 13F | Elevated Capital Advisors, LLC | 24,165 | 0.00 | 1,325 | 0.00 | ||||
| 2025-08-07 | 13F | Evoke Wealth, Llc | 961,343 | -10.56 | 50,442 | -14.42 | ||||
| 2025-07-09 | 13F | Fermata Advisors, LLC | 131,430 | -8.40 | 6,896 | -12.35 | ||||
| 2025-08-01 | 13F | Gwn Securities Inc. | 8,390 | 107.21 | 441 | 99.10 | ||||
| 2025-08-12 | 13F | LPL Financial LLC | 42,570 | 35.12 | 2,234 | 29.30 | ||||
| 2025-08-14 | 13F | Bank Of America Corp /de/ | 33,708 | 42.71 | 1,769 | 36.53 | ||||
| 2025-08-14 | 13F | Jane Street Group, Llc | 61,085 | 0.90 | 3,205 | -3.46 | ||||
| 2025-04-24 | 13F | Decker Retirement Planning Inc. | 0 | -100.00 | 0 | |||||
| 2025-04-14 | 13F | One + One Wealth Management, Llc | 0 | -100.00 | 0 | |||||
| 2025-08-14 | 13F | First Manhattan Co | 4,010 | 210 | ||||||
| 2025-08-12 | 13F | Atlas Capital Advisors Llc | 3,800 | -11.63 | 199 | -15.32 | ||||
| 2025-08-14 | 13F | Wells Fargo & Company/mn | 472,036 | 7.36 | 24,768 | 2.72 | ||||
| 2025-07-30 | 13F | Mid-American Wealth Advisory Group, Inc. | 185,581 | 60.22 | 9,737 | 53.31 | ||||
| 2025-07-15 | 13F | Avaii Wealth Management, Llc | 5,246 | 19.44 | 275 | 14.58 | ||||
| 2025-08-14 | 13F | Ancora Advisors, LLC | 44,830 | 5.98 | 2,352 | 1.42 | ||||
| 2025-07-25 | 13F | Cwm, Llc | 0 | -100.00 | 0 | |||||
| 2025-08-14 | 13F | Royal Bank Of Canada | 14,781 | -40.38 | 776 | -42.94 | ||||
| 2025-07-30 | 13F | Bogart Wealth, LLC | 3,640 | 0.00 | 191 | -4.02 | ||||
| 2025-08-04 | 13F | Creative Financial Designs Inc /adv | 187 | 1.63 | 10 | -10.00 | ||||
| 2025-05-02 | 13F | Capital A Wealth Management, LLC | 74 | -86.35 | 4 | -85.71 | ||||
| 2025-05-01 | 13F | Quest 10 Wealth Builders, Inc. | 514 | 292.37 | 28 | 366.67 | ||||
| 2025-07-22 | 13F | Yoder Wealth Management, Inc. | 103,904 | 5.94 | 5,452 | 1.36 | ||||
| 2025-08-13 | 13F | Avos Capital Management, LLC | 278,700 | 36.79 | 14,623 | 30.88 | ||||
| 2025-08-13 | 13F | Kilter Group LLC | 23 | 1 | ||||||
| 2025-08-13 | 13F | Northwestern Mutual Wealth Management Co | 70 | 4 | ||||||
| 2025-08-15 | 13F | Morgan Stanley | 71,186 | 18.79 | 3,735 | 13.66 | ||||
| 2025-07-22 | 13F | MGO Private Wealth, LLC | 22,702 | -55.96 | 1,191 | -57.87 | ||||
| 2025-08-06 | 13F | Modera Wealth Management, LLC | 4,757 | 0.57 | 250 | -3.86 | ||||
| 2025-08-13 | 13F | Wealthedge Investment Advisors, Llc | 263,811 | 20.05 | 13,842 | 14.86 | ||||
| 2025-08-07 | 13F | CENTRAL TRUST Co | 554,344 | 3.14 | 29,086 | -1.32 | ||||
| 2025-08-13 | 13F | Continuum Advisory, LLC | 0 | -100.00 | 0 | |||||
| 2025-08-13 | 13F | Jones Financial Companies Lllp | 8,241 | -7.95 | 429 | -11.75 | ||||
| 2025-08-11 | 13F | Empowered Funds, LLC | 0 | -100.00 | 0 | |||||
| 2025-08-14 | 13F | Balanced Rock Investment Advisor | 51,424 | 53.65 | 2,698 | 47.03 | ||||
| 2025-07-16 | 13F | Lloyd Advisory Services, LLC. | 47,684 | 3.01 | 2,502 | -1.46 | ||||
| 2025-07-31 | 13F | AlTi Global, Inc. | 21,400 | 0.00 | 1,122 | -4.43 | ||||
| 2025-08-12 | 13F | Proequities, Inc. | 0 | 0 | ||||||
| 2025-08-19 | 13F | Advisory Services Network, LLC | 5,285 | 274 | ||||||
| 2025-09-04 | 13F/A | Advisor Group Holdings, Inc. | 1,765 | -5.11 | 93 | -9.80 | ||||
| 2025-08-14 | 13F | Greenline Partners, LLC | 27,208 | 1,428 | ||||||
| 2025-07-11 | 13F | Farther Finance Advisors, LLC | 32 | 0.00 | 2 | 0.00 | ||||
| 2025-08-06 | 13F | North Capital, Inc. | 500 | 0.00 | 26 | -3.70 | ||||
| 2025-07-28 | 13F | Eq Wealth Advisors, Llc | 56 | 0.00 | 3 | -33.33 | ||||
| 2025-04-17 | 13F | Authentikos Wealth Advisory, LLC | 0 | -100.00 | 0 | |||||
| 2025-04-21 | 13F | United Advisor Group, LLC | 0 | -100.00 | 0 | |||||
| 2025-07-21 | 13F | Ameriflex Group, Inc. | 51 | 2.00 | 3 | 0.00 | ||||
| 2025-08-13 | 13F | Quadrature Capital Ltd | 26,730 | 1,402 | ||||||
| 2025-07-17 | 13F | Wolff Wiese Magana Llc | 170 | 0.00 | 9 | -11.11 | ||||
| 2025-04-22 | 13F/A | NorthRock Partners, LLC | 0 | -100.00 | 0 | -100.00 | ||||
| 2025-07-29 | 13F | International Assets Investment Management, Llc | 0 | -100.00 | 0 | |||||
| 2025-08-06 | 13F | AE Wealth Management LLC | 69,170 | 72.44 | 3,629 | 65.03 | ||||
| 2025-05-16 | 13F/A | Kestra Investment Management, LLC | 0 | -100.00 | 0 | |||||
| 2025-07-29 | 13F | Signature Estate & Investment Advisors Llc | 0 | -100.00 | 0 | |||||
| 2025-08-14 | 13F | Citadel Advisors Llc | 0 | -100.00 | 0 | |||||
| 2025-08-14 | 13F | Citadel Advisors Llc | Put | 0 | -100.00 | 0 | ||||
| 2025-08-15 | 13F | Kestra Advisory Services, LLC | 6,372 | -8.98 | 334 | -12.79 | ||||
| 2025-04-30 | 13F | Sofos Investments, Inc. | 0 | -100.00 | 0 | |||||
| 2025-04-17 | 13F | Great Lakes Retirement, Inc. | 0 | -100.00 | 0 | |||||
| 2025-08-29 | 13F | Evolution Wealth Management Inc. | 1,144 | 60 | ||||||
| 2025-05-15 | 13F | Tower Research Capital LLC (TRC) | 0 | -100.00 | 0 | |||||
| 2025-07-25 | 13F | Iron Financial, LLC | 21,454 | 4.69 | 1,126 | 0.18 | ||||
| 2025-08-12 | 13F | Edmond De Rothschild Holding S.a. | 871 | 0.00 | 46 | -4.26 | ||||
| 2025-08-12 | 13F | MAI Capital Management | 1,010 | 0.00 | 53 | -5.45 | ||||
| 2025-07-24 | 13F | IFP Advisors, Inc | 2,500 | 1,096.17 | 131 | 1,090.91 | ||||
| 2025-08-14 | 13F | Comerica Bank | 41 | 720.00 | 2 | |||||
| 2025-08-18 | 13F | Goodman Advisory Group, LLC | 0 | -100.00 | 0 | -100.00 | ||||
| 2025-05-05 | 13F | Csenge Advisory Group | 0 | -100.00 | 0 | |||||
| 2025-08-11 | 13F | Private Advisor Group, LLC | 22,741 | 7.23 | 1,193 | 2.58 | ||||
| 2025-04-17 | 13F | Howard Bailey Securities, Llc | 0 | -100.00 | 0 |
Other Listings
| MX:LTPZ |