Mga Batayang Estadistika
| Pemilik Institusional | 269 total, 269 long only, 0 short only, 0 long/short - change of 0.37% MRQ |
| Alokasi Portofolio Rata-rata | 0.2472 % - change of -16.73% MRQ |
| Saham Institusional (Jangka Panjang) | 42,066,692 (ex 13D/G) - change of -2.98MM shares -6.61% MRQ |
| Nilai Institusional (Jangka Panjang) | $ 471,751 USD ($1000) |
Kepemilikan Institusional dan Pemegang Saham
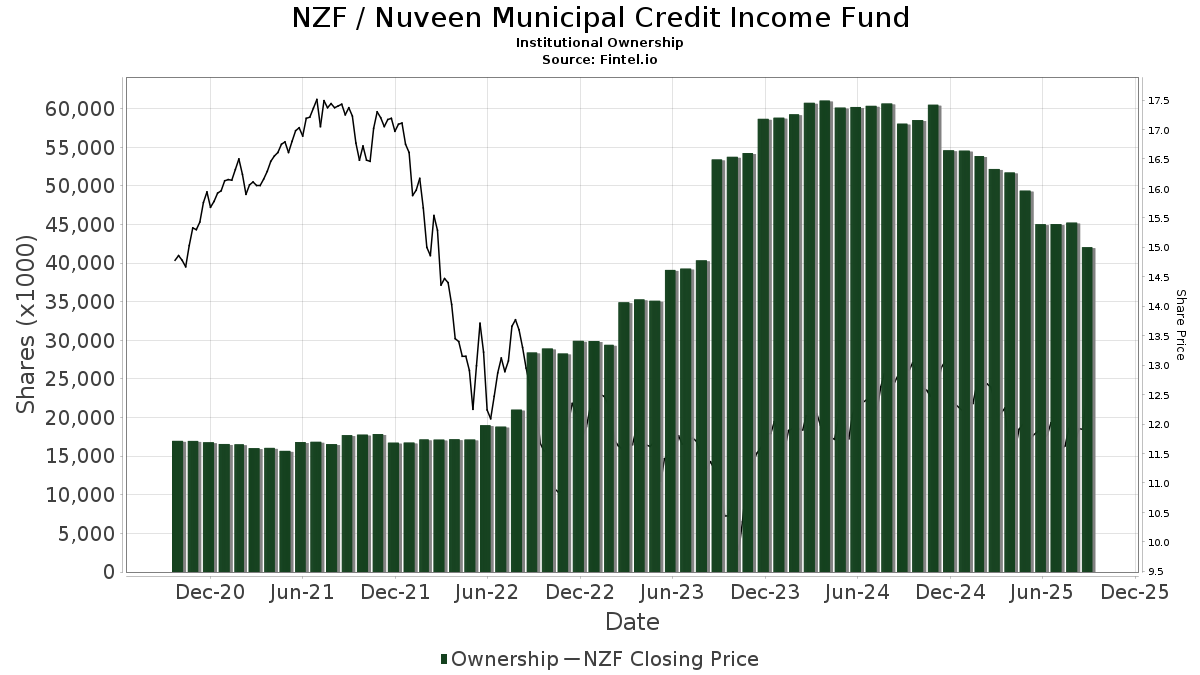
Nuveen Municipal Credit Income Fund (US:NZF) memiliki 269 pemilik institusional dan pemegang saham yang telah mengajukan formulir 13D/G atau 13F kepada Komisi Bursa Efek (Securities Exchange Commission/SEC). Lembaga-lembaga ini memegang total 42,066,692 saham. Pemegang saham terbesar meliputi Morgan Stanley, Mackay Shields Llc, Bank Of America Corp /de/, UBS Group AG, Wells Fargo & Company/mn, Hennion & Walsh Asset Management, Inc., Guggenheim Capital Llc, XMPT - VanEck Vectors CEF Municipal Income ETF, Raymond James Financial Inc, and Van Eck Associates Corp .
Struktur kepemilikan institusional Nuveen Municipal Credit Income Fund (NYSE:NZF) menunjukkan posisi terkini di perusahaan oleh institusi dan dana, serta perubahan terbaru dalam ukuran posisi. Pemegang saham utama dapat mencakup investor individu, reksa dana, dana lindung nilai, atau institusi. Jadwal 13D menunjukkan bahwa investor memegang (atau pernah memegang) lebih dari 5% saham perusahaan dan bermaksud (atau pernah bermaksud) untuk secara aktif mengejar perubahan strategi bisnis. Jadwal 13G menunjukkan investasi pasif lebih dari 5%.
The share price as of September 5, 2025 is 12.19 / share. Previously, on September 9, 2024, the share price was 12.88 / share. This represents a decline of 5.36% over that period.
Skor Sentimen Dana
Skor Sentimen Dana (sebelumnya dikenal sebagai Skor Akumulasi Kepemilikan) menemukan saham-saham yang paling banyak dibeli oleh dana. Ini adalah hasil dari model kuantitatif multi-faktor yang canggih yang mengidentifikasi perusahaan dengan tingkat akumulasi institusional tertinggi. Model penilaian menggunakan kombinasi dari total peningkatan pemilik yang diungkapkan, perubahan dalam alokasi portofolio pada pemilik tersebut, dan metrik lainnya. Angka berkisar dari 0 hingga 100, dengan angka yang lebih tinggi menunjukkan tingkat akumulasi yang lebih tinggi dibandingkan dengan perusahaan sejenisnya, dan 50 adalah rata-ratanya.
Frekuensi Pembaruan: Setiap Hari
Lihat Ownership Explorer, yang menyediakan daftar perusahaan dengan peringkat tertinggi.
Rasio Put/Call Institusional
Selain melaporkan isu ekuitas dan utang standar, institusi dengan aset di bawah manajemen lebih dari 100 juta dolar AS juga harus mengungkapkan kepemilikan opsi put dan call mereka. Karena opsi put umumnya menunjukkan sentimen negatif, dan opsi call menunjukkan sentimen positif, kita dapat mengetahui sentimen institusional secara keseluruhan dengan memplot rasio put terhadap call. Grafik di sebelah kanan memplot rasio put/call historis untuk instrumen ini.
Menggunakan Rasio Put/Call sebagai indikator sentimen investor mengatasi salah satu kekurangan utama dari penggunaan total kepemilikan institusional, yaitu sejumlah besar aset yang dikelola diinvestasikan secara pasif untuk melacak indeks. Dana yang dikelola secara pasif biasanya tidak membeli opsi, sehingga indikator rasio put/call lebih akurat dalam melacak sentimen dana yang dikelola secara aktif.
Pengajuan 13D/G
Kami menyajikan pengajuan 13D/G secara terpisah dari pengajuan 13F karena perlakuan yang berbeda oleh SEC. Pengajuan 13D/G dapat diajukan oleh kelompok investor (dengan satu pemimpin), sedangkan pengajuan 13F tidak bisa. Hal ini mengakibatkan situasi di mana seorang investor dapat mengajukan 13D/G yang melaporkan satu nilai untuk total saham (mewakili semua saham yang dimiliki oleh kelompok investor), tetapi kemudian mengajukan 13F yang melaporkan nilai yang berbeda untuk total saham (mewakili kepemilikan mereka sendiri). Ini berarti bahwa kepemilikan saham dari pengajuan 13D/G dan pengajuan 13F seringkali tidak dapat dibandingkan secara langsung, sehingga kami menyajikannya secara terpisah.
Catatan: Mulai 16 Mei 2021, kami tidak lagi menampilkan pemilik yang belum mengajukan 13D/G dalam setahun terakhir. Sebelumnya, kami menampilkan riwayat lengkap pengajuan 13D/G. Secara umum, entitas yang diwajibkan untuk mengajukan pengajuan 13D/G harus mengajukan setidaknya setiap tahun sebelum mengirimkan pengajuan penutupan. Namun, terkadang dana keluar dari posisi tanpa mengirimkan pengajuan penutupan (misalnya, mereka menghentikan operasi), sehingga menampilkan riwayat lengkap terkadang menyebabkan kebingungan tentang kepemilikan saat ini. Untuk mencegah kebingungan, kami sekarang hanya menampilkan pemilik 'saat ini' - yaitu - pemilik yang telah mengajukan dalam setahun terakhir.
Upgrade to unlock premium data.
| Tanggal File | Formulir | Investor | Sebelumnya Saham |
Terbaru Saham |
Δ Saham (Persen) |
Kepemilikan (Persen) |
Δ Pagmamay-ari (Persen) |
|
|---|---|---|---|---|---|---|---|---|
| 2024-12-13 | BANK OF AMERICA CORP /DE/ | 2,622 | 2,622 | 0.00 | 19.90 | 3.81 |
Pengajuan 13F dan NPORT
Detail pada pengajuan 13F tersedia gratis. Detail pada pengajuan NP memerlukan keanggotaan premium. Baris berwarna hijau menunjukkan posisi baru. Baris berwarna merah menunjukkan posisi yang sudah ditutup. Klik tautan ini ikon untuk melihat riwayat transaksi selengkapnya.
Tingkatkan
untuk membuka data premium dan mengekspor ke Excel ![]() .
.
| Tanggal File | Sumber | Investor | Ketik | Presyo ng Avg (Silangan) |
Saham | Δ Saham (%) |
Dilaporkan Nilai ($1000) |
Nilai Δ (%) |
Alokasi Port (%) |
|
|---|---|---|---|---|---|---|---|---|---|---|
| 2025-08-01 | 13F | James Investment Research Inc | 18,248 | 0.00 | 218 | -2.69 | ||||
| 2025-08-29 | NP | PIMCO Flexible Municipal Income Fund | 462,380 | 0.00 | 5,512 | -2.53 | ||||
| 2025-07-21 | 13F | River Street Advisors LLC | 21,431 | 255 | ||||||
| 2025-05-29 | NP | HCIMX - The Intermediate Term Municipal Bond Portfolio HC Strategic Shares | 214,282 | -18.37 | 2,621 | -17.97 | ||||
| 2025-08-14 | 13F | Modern Wealth Management, LLC | 22,696 | 0.00 | 271 | -2.53 | ||||
| 2025-07-30 | 13F | Meadow Creek Wealth Advisors Llc | 17,425 | 0.00 | 208 | -2.82 | ||||
| 2025-05-02 | 13F | Dakota Wealth Management | 0 | -100.00 | 0 | |||||
| 2025-08-14 | 13F | Royal Bank Of Canada | 933,138 | 21.64 | 11,123 | 18.56 | ||||
| 2025-05-13 | 13F | Bokf, Na | 0 | -100.00 | 0 | -100.00 | ||||
| 2025-04-30 | 13F | Cerity Partners LLC | 0 | -100.00 | 0 | |||||
| 2025-05-28 | NP | RDFI - RAREVIEW DYNAMIC FIXED INCOME ETF | 169,127 | -1.69 | 2,068 | -1.19 | ||||
| 2025-07-11 | 13F | Lantz Financial LLC | 13,401 | 0.00 | 160 | -2.45 | ||||
| 2025-08-18 | 13F | Geneos Wealth Management Inc. | 18,623 | -3.71 | 222 | -6.36 | ||||
| 2025-08-12 | 13F | Wealth Dimensions Group, Ltd. | 17,900 | 0.00 | 213 | -2.29 | ||||
| 2025-07-24 | 13F | Bernard Wealth Management Corp. | 2,500 | 30 | ||||||
| 2025-08-14 | 13F | GWM Advisors LLC | 78,893 | -8.64 | 940 | -10.98 | ||||
| 2025-08-06 | 13F | Csenge Advisory Group | 32,092 | 0.00 | 381 | 2.42 | ||||
| 2025-07-24 | 13F | IFP Advisors, Inc | 2,660 | -53.00 | 32 | -55.07 | ||||
| 2025-08-14 | 13F | Integrated Wealth Concepts LLC | 17,714 | -5.76 | 211 | -7.86 | ||||
| 2025-08-11 | 13F | Kim, Llc | 250,000 | 0.00 | 2,980 | -2.52 | ||||
| 2025-04-11 | 13F | Permanent Capital Management, LP | 11,381 | -8.28 | 140 | -7.28 | ||||
| 2025-07-31 | 13F | Curio Wealth, Llc | 1,798 | 179,700.00 | 21 | 0.00 | ||||
| 2025-08-12 | 13F | Advisors Asset Management, Inc. | 522,984 | -0.44 | 6,234 | -2.97 | ||||
| 2025-07-31 | 13F | Linden Thomas Advisory Services, LLC | 20,000 | 238 | ||||||
| 2025-04-09 | 13F | Integrated Capital Management, Inc. | 0 | -100.00 | 0 | |||||
| 2025-07-07 | 13F | Wesbanco Bank Inc | 13,662 | 0.00 | 163 | -2.99 | ||||
| 2025-07-24 | 13F | Accredited Investor Services, Llc | 19,592 | -1.28 | 234 | -3.72 | ||||
| 2025-07-08 | 13F | Melone Private Wealth, LLC | 778,579 | 1.58 | 9,242 | -1.41 | ||||
| 2025-08-05 | 13F | Carolinas Wealth Consulting Llc | 0 | -100.00 | 0 | -100.00 | ||||
| 2025-08-26 | 13F/A | Thrivent Financial For Lutherans | 0 | -100.00 | 0 | |||||
| 2025-08-15 | 13F | Provenance Wealth Advisors, LLC | 0 | -100.00 | 0 | -100.00 | ||||
| 2025-08-08 | 13F | Creative Planning | 38,924 | 3.57 | 464 | 0.87 | ||||
| 2025-04-24 | 13F | Sunbelt Securities, Inc. | 0 | -100.00 | 0 | |||||
| 2025-07-31 | 13F | United Community Bank | 5 | 0.00 | 0 | |||||
| 2025-08-13 | 13F | Rinkey Investments | 40,925 | 0.00 | 488 | -2.60 | ||||
| 2025-07-14 | 13F | Sowell Financial Services LLC | 17,976 | -2.60 | 214 | -4.89 | ||||
| 2025-08-15 | 13F | Equitable Holdings, Inc. | 11,606 | 14.14 | 138 | 11.29 | ||||
| 2025-07-31 | 13F | Whipplewood Advisors, LLC | 42,661 | -37.70 | 509 | -1.93 | ||||
| 2025-08-14 | 13F | Van Eck Associates Corp | 947,023 | -1.04 | 11 | 0.00 | ||||
| 2025-08-11 | 13F | Traub Capital Management LLC | 3,100 | 37 | ||||||
| 2025-08-13 | 13F | Cary Street Partners Financial Llc | 28,905 | 345 | ||||||
| 2025-08-14 | 13F | CF Capital LLC | 152,326 | -10.00 | 1,817 | -9.33 | ||||
| 2025-08-14 | 13F | Vista Investment Management | 16,067 | 0.00 | 192 | -2.55 | ||||
| 2025-07-09 | 13F | VisionPoint Advisory Group, LLC | 22,901 | 31.14 | 273 | 27.70 | ||||
| 2025-08-13 | 13F | Walleye Capital LLC | 0 | -100.00 | 0 | |||||
| 2025-08-15 | 13F | Tower Research Capital LLC (TRC) | 10 | 0.00 | 0 | |||||
| 2025-08-08 | 13F | Fiera Capital Corp | 411,745 | -1.49 | 4,908 | -3.97 | ||||
| 2025-08-06 | 13F | North Capital, Inc. | 5,026 | -4.34 | 60 | -7.81 | ||||
| 2025-08-12 | 13F | Proequities, Inc. | 0 | 0 | ||||||
| 2025-08-12 | 13F | AlphaCore Capital LLC | 30,565 | 1.99 | 367 | -0.54 | ||||
| 2025-07-17 | 13F | Coastline Trust Co | 6,975 | 0.00 | 83 | -2.35 | ||||
| 2025-08-13 | 13F | StoneX Group Inc. | 367,800 | 14.61 | 4,385 | 11.75 | ||||
| 2025-08-15 | 13F | Kestra Advisory Services, LLC | 366,353 | -6.14 | 4,367 | -8.53 | ||||
| 2025-08-07 | 13F | Ibex Wealth Advisors | 37,326 | 0.00 | 445 | -2.63 | ||||
| 2025-08-15 | 13F | Captrust Financial Advisors | 58,302 | -13.50 | 695 | -15.78 | ||||
| 2025-07-25 | NP | PMSAX - Global Multi-Strategy Fund Class A | 22,907 | 0.00 | 272 | -6.21 | ||||
| 2025-05-07 | 13F | Sheaff Brock Investment Advisors, LLC | 11,784 | 0.00 | 144 | 0.70 | ||||
| 2025-07-08 | 13F | Nbc Securities, Inc. | 2,698 | 0.52 | 0 | |||||
| 2025-05-12 | 13F | Sandy Spring Bank | 2,977 | 36 | ||||||
| 2025-08-08 | 13F | Tortoise Investment Management, LLC | 1,945 | 0.00 | 23 | 0.00 | ||||
| 2025-08-07 | 13F | Sound View Wealth Advisors Group, LLC | 12,664 | -2.85 | 151 | -5.66 | ||||
| 2025-08-14 | 13F | Westchester Capital Management, LLC | 0 | -100.00 | 0 | |||||
| 2025-08-15 | 13F | CI Private Wealth, LLC | 33,362 | 398 | ||||||
| 2025-07-17 | 13F | Janney Montgomery Scott LLC | 64,587 | -12.96 | 1 | |||||
| 2025-08-12 | 13F | Steward Partners Investment Advisory, Llc | 160,860 | 4.12 | 1,917 | 1.48 | ||||
| 2025-07-18 | 13F | Bartlett & Co. Wealth Management Llc | 1,066 | 0.00 | 13 | -7.69 | ||||
| 2025-07-31 | 13F | Trademark Financial Management, LLC | 11,167 | -19.08 | 133 | -20.83 | ||||
| 2025-08-14 | 13F | Wiley Bros.-aintree Capital, Llc | 70,722 | 4.37 | 843 | 2.93 | ||||
| 2025-07-17 | 13F | Venture Visionary Partners LLC | 58,421 | 0.08 | 696 | -2.38 | ||||
| 2025-04-28 | 13F | Strategic Financial Concepts, LLC | 0 | -100.00 | 0 | -100.00 | ||||
| 2025-05-12 | 13F | Kohmann Bosshard Financial Services, LLC | 0 | -100.00 | 0 | |||||
| 2025-07-25 | 13F | We Are One Seven, LLC | 20,919 | -4.10 | 249 | -6.39 | ||||
| 2025-08-14 | 13F | Gould Capital, LLC | 75,615 | -0.93 | 901 | -3.43 | ||||
| 2025-08-08 | 13F | Larson Financial Group LLC | 5,000 | -0.16 | 60 | -3.28 | ||||
| 2025-08-14 | 13F | Goldman Sachs Group Inc | 90,100 | -47.63 | 1,074 | -49.00 | ||||
| 2025-06-25 | NP | XMPT - VanEck Vectors CEF Municipal Income ETF | 962,855 | 1.64 | 11,468 | -3.78 | ||||
| 2025-08-14 | 13F | Citadel Advisors Llc | 0 | -100.00 | 0 | |||||
| 2025-08-07 | 13F | Montag A & Associates Inc | 873 | 0.00 | 10 | 0.00 | ||||
| 2025-08-01 | 13F | Envestnet Asset Management Inc | 145,730 | 50.91 | 1,737 | 47.08 | ||||
| 2025-08-12 | 13F | LPL Financial LLC | 539,255 | -20.08 | 6,428 | -22.12 | ||||
| 2025-07-22 | 13F | Kercheville Advisors, LLC | 11,000 | -8.33 | 131 | -10.27 | ||||
| 2025-07-22 | 13F | Powell Investment Advisors, LLC | 12,576 | 1.78 | 151 | -1.32 | ||||
| 2025-05-16 | 13F | Capital & Planning, Llc | 0 | -100.00 | 0 | |||||
| 2025-08-13 | 13F | Invesco Ltd. | 184,132 | 6.49 | 2,195 | 3.78 | ||||
| 2025-08-18 | 13F | Hollencrest Capital Management | 21,260 | 0.00 | 253 | -2.69 | ||||
| 2025-07-31 | 13F | Cambridge Investment Research Advisors, Inc. | 278,678 | 22.48 | 3 | 50.00 | ||||
| 2025-08-05 | 13F | Plante Moran Financial Advisors, LLC | 2,358 | 28 | ||||||
| 2025-07-25 | NP | MFLX - First Trust Municipal CEF Income Opportunity ETF This fund is a listed as child fund of First Trust Advisors Lp and if that institution has disclosed ownership in this security, then these positions will not be double counted when calculating total shares and total value | 6,626 | 0.00 | 79 | -7.14 | ||||
| 2025-04-02 | 13F | Kera Capital Partners, Inc. | 0 | -100.00 | 0 | |||||
| 2025-08-08 | 13F | Hartland & Co., LLC | 693 | 0.00 | 8 | 0.00 | ||||
| 2025-08-14 | 13F | Jane Street Group, Llc | 12,325 | 147 | ||||||
| 2025-07-17 | 13F | Melfa Wealth Management, Llc | 29,490 | 0.00 | 352 | -2.50 | ||||
| 2025-08-11 | 13F | Cornerstone Planning Group LLC | 3,445 | 0.00 | 41 | 2.56 | ||||
| 2025-08-13 | 13F | Lido Advisors, LLC | 132,003 | 0.00 | 1,584 | -2.52 | ||||
| 2025-08-14 | 13F | Robinson Capital Management, Llc | 202,535 | -27.79 | 2,414 | -29.62 | ||||
| 2025-08-05 | 13F | Bank Of Montreal /can/ | 31,090 | 2.53 | 371 | 0.00 | ||||
| 2025-08-14 | 13F/A | Rockefeller Capital Management L.P. | 386,879 | -1.82 | 4,612 | -4.32 | ||||
| 2025-08-13 | 13F | Townsquare Capital Llc | 0 | -100.00 | 0 | |||||
| 2025-08-27 | NP | ROBAX - Robinson Tax Advantaged Income Fund Class A Shares | 202,535 | -27.79 | 2,414 | -29.62 | ||||
| 2025-07-21 | 13F | Hudson Valley Investment Advisors Inc /adv | 10,500 | 0.00 | 125 | -2.34 | ||||
| 2025-08-07 | 13F | Kestra Private Wealth Services, Llc | 24,889 | 1.05 | 297 | -1.66 | ||||
| 2025-05-09 | 13F | Pathway Financial Advisers, LLC | 0 | -100.00 | 0 | |||||
| 2025-07-25 | 13F | Commonwealth Financial Services, LLC | 11,164 | 0.00 | 133 | -2.21 | ||||
| 2025-08-14 | 13F | Ancora Advisors, LLC | 3,199 | 0.00 | 38 | -2.56 | ||||
| 2025-07-29 | 13F | Tradewinds Capital Management, LLC | 11,508 | 0.00 | 137 | -2.14 | ||||
| 2025-08-14 | 13F | Wells Fargo & Company/mn | 1,668,609 | -2.59 | 19,890 | -5.06 | ||||
| 2025-04-15 | 13F | Noble Wealth Management PBC | 54,222 | -5.73 | 663 | -5.15 | ||||
| 2025-07-28 | 13F | BRYN MAWR TRUST Co | 10,000 | 0.00 | 119 | -2.46 | ||||
| 2025-07-28 | 13F | Axxcess Wealth Management, Llc | 29,604 | 0.00 | 353 | -2.76 | ||||
| 2025-08-13 | 13F | First Trust Advisors Lp | 13,377 | -1.68 | 159 | -4.22 | ||||
| 2025-08-04 | 13F | Spire Wealth Management | 1,860 | 0.00 | 22 | 0.00 | ||||
| 2025-08-06 | 13F | Commonwealth Equity Services, Llc | 263,265 | -2.38 | 3 | 0.00 | ||||
| 2025-05-15 | 13F | Nomura Holdings Inc | 0 | -100.00 | 0 | |||||
| 2025-08-04 | 13F | Bay Colony Advisory Group, Inc d/b/a Bay Colony Advisors | 0 | -100.00 | 0 | -100.00 | ||||
| 2025-08-07 | 13F | Commerce Bank | 13,580 | 17.27 | 162 | 14.18 | ||||
| 2025-05-15 | 13F | Occidental Asset Management, LLC | 0 | -100.00 | 0 | |||||
| 2025-08-05 | 13F | Bank of New York Mellon Corp | 12,113 | -53.81 | 144 | -55.00 | ||||
| 2025-08-04 | 13F | Kovack Advisors, Inc. | 0 | -100.00 | 0 | |||||
| 2025-07-29 | 13F | Burford Brothers, Inc. | 22,850 | 75.77 | 272 | 72.15 | ||||
| 2025-07-31 | 13F | Pacitti Group Inc. | 23,701 | -12.03 | 283 | -14.29 | ||||
| 2025-04-28 | 13F | Keybank National Association/oh | 0 | -100.00 | 0 | |||||
| 2025-04-15 | 13F | Murphy, Middleton, Hinkle & Parker, Inc. | 0 | -100.00 | 0 | |||||
| 2025-08-25 | 13F | Silverlake Wealth Management Llc | 57,882 | 3.50 | 690 | 0.88 | ||||
| 2025-07-14 | 13F | Gridiron Partners, LLC | 271,681 | 0.00 | 3,238 | -2.53 | ||||
| 2025-05-29 | NP | JNL SERIES TRUST - JNL/Westchester Capital Event Driven Fund (A) | 15,624 | 0.00 | 191 | 0.53 | ||||
| 2025-07-10 | 13F | Wealth Enhancement Advisory Services, Llc | 58,952 | 0.29 | 707 | -1.53 | ||||
| 2025-07-29 | 13F | Chicago Partners Investment Group LLC | 26,670 | 1.34 | 309 | -2.22 | ||||
| 2025-08-15 | 13F | Hayek Kallen Investment Management | 24,528 | 38.48 | 0 | |||||
| 2025-08-14 | 13F | Summit Trail Advisors, Llc | 10,395 | 125 | ||||||
| 2025-08-14 | 13F | Bank Of America Corp /de/ | 2,959,153 | 1.73 | 35,273 | -0.85 | ||||
| 2025-08-19 | 13F | Newbridge Financial Services Group, Inc. | 1,386 | 17 | ||||||
| 2025-08-13 | 13F | Rsm Us Wealth Management Llc | 37,858 | -1.02 | 454 | -3.40 | ||||
| 2025-07-31 | 13F | Optimum Investment Advisors | 6,686 | 0.00 | 80 | -2.47 | ||||
| 2025-08-12 | 13F | SRS Capital Advisors, Inc. | 7,053 | 2.00 | 84 | 0.00 | ||||
| 2025-08-14 | 13F | Mercer Global Advisors Inc /adv | 14,119 | 22.75 | 168 | 20.00 | ||||
| 2025-08-28 | NP | RiverNorth Managed Duration Municipal Income Fund, Inc. | 286,174 | -44.08 | 3,411 | -45.49 | ||||
| 2025-08-14 | 13F | Mariner, LLC | 30,096 | 4.18 | 359 | 1.42 | ||||
| 2025-08-12 | 13F | Park Square Financial Group, LLC | 3,253 | -3.61 | 39 | -7.32 | ||||
| 2025-08-14 | 13F | UBS Group AG | 2,697,412 | -1.96 | 32,153 | -4.44 | ||||
| 2025-08-27 | 13F/A | Brinker Capital Investments, LLC | 21,061 | 251 | ||||||
| 2025-07-28 | 13F | Eq Wealth Advisors, Llc | 17,697 | 0.00 | 211 | -2.78 | ||||
| 2025-08-08 | 13F | Kingsview Wealth Management, LLC | 11,356 | 135 | ||||||
| 2025-08-05 | 13F | GHP Investment Advisors, Inc. | 917 | 0.00 | 11 | -9.09 | ||||
| 2025-08-13 | 13F | Beacon Pointe Advisors, LLC | 0 | -100.00 | 0 | |||||
| 2025-07-30 | 13F | D.a. Davidson & Co. | 27,516 | 1.43 | 328 | -1.21 | ||||
| 2025-07-24 | 13F | Mackay Shields Llc | 2,972,732 | -0.23 | 35,435 | -2.76 | ||||
| 2025-07-25 | 13F | Cwm, Llc | 796 | 0.00 | 0 | |||||
| 2025-08-11 | 13F | Edgemoor Investment Advisors, Inc. | 199,882 | 5.03 | 2,383 | 2.36 | ||||
| 2025-04-17 | 13F | Bayshore Asset Management, Llc | 0 | -100.00 | 0 | |||||
| 2025-07-07 | 13F | Wealth Alliance Advisory Group, LLC | 66,321 | 1.53 | 791 | -1.00 | ||||
| 2025-08-14 | 13F | MGB Wealth Management, LLC | 30,000 | -34.78 | 358 | -36.36 | ||||
| 2025-08-08 | 13F | Avantax Advisory Services, Inc. | 26,811 | 1.33 | 320 | -1.24 | ||||
| 2025-07-22 | 13F | Compass Financial Group, INC/SD | 162,205 | 96.88 | 1,933 | 91.96 | ||||
| 2025-05-13 | 13F | Russell Investments Group, Ltd. | 0 | -100.00 | 0 | -100.00 | ||||
| 2025-07-16 | 13F | Novem Group | 12,500 | 0.00 | 149 | -1.97 | ||||
| 2025-08-04 | 13F | Savvy Advisors, Inc. | 25,901 | 12.35 | 309 | 9.61 | ||||
| 2025-07-28 | 13F | Harbour Investments, Inc. | 32,173 | 0.00 | 384 | -2.54 | ||||
| 2025-07-31 | 13F | Oppenheimer & Co Inc | 17,281 | -30.17 | 206 | -32.12 | ||||
| 2025-05-14 | 13F | Thomas J. Herzfeld Advisors, Inc. | 0 | -100.00 | 0 | |||||
| 2025-05-28 | NP | RTAI - RAREVIEW TAX ADVANTAGED INCOME ETF | 218,922 | -3.24 | 2,677 | -2.76 | ||||
| 2025-07-17 | 13F | Beacon Capital Management, LLC | 5,790 | 0.00 | 69 | -1.43 | ||||
| 2025-07-25 | 13F | Allspring Global Investments Holdings, LLC | 179,052 | -31.57 | 2,134 | -33.31 | ||||
| 2025-08-14 | 13F | Advisor OS, LLC | 10,747 | -12.97 | 128 | -15.23 | ||||
| 2025-04-17 | 13F | North Star Investment Management Corp. | 0 | 0 | ||||||
| 2025-07-29 | 13F | Private Trust Co Na | 4,837 | 0.00 | 58 | -3.39 | ||||
| 2025-08-13 | 13F | Baird Financial Group, Inc. | 55,930 | 1.96 | 667 | -0.60 | ||||
| 2025-05-16 | 13F | Coppell Advisory Solutions LLC | 0 | -100.00 | 0 | |||||
| 2025-08-07 | 13F | Hennion & Walsh Asset Management, Inc. | 1,528,015 | -4.47 | 18,214 | -6.89 | ||||
| 2025-08-05 | 13F | C2P Capital Advisory Group, LLC d.b.a. Prosperity Capital Advisors | 0 | -100.00 | 0 | |||||
| 2025-07-23 | 13F | Prime Capital Investment Advisors, LLC | 21,148 | 0.00 | 252 | -2.33 | ||||
| 2025-08-05 | 13F | Huntington National Bank | 746 | 0.00 | 9 | -11.11 | ||||
| 2025-08-11 | 13F | HighTower Advisors, LLC | 462,448 | 3.74 | 5,512 | 1.12 | ||||
| 2025-07-10 | 13F | Tompkins Financial Corp | 0 | -100.00 | 0 | |||||
| 2025-08-14 | 13F | Hrt Financial Lp | 32,099 | 0 | ||||||
| 2025-04-09 | 13F | Milestone Asset Management, Llc | 0 | -100.00 | 0 | |||||
| 2025-08-11 | 13F | Elequin Capital Lp | 42,314 | 413.83 | 504 | 404.00 | ||||
| 2025-08-13 | 13F | Northern Trust Corp | 24,039 | -53.52 | 287 | -54.75 | ||||
| 2025-08-04 | 13F | Daymark Wealth Partners, Llc | 23,121 | 2.21 | 276 | -0.36 | ||||
| 2025-08-05 | 13F | GPS Wealth Strategies Group, LLC | 310 | 0.00 | 4 | 0.00 | ||||
| 2025-07-22 | 13F | Fortitude Advisory Group L.L.C. | 52,453 | 0.00 | 625 | 3.31 | ||||
| 2025-08-12 | 13F | NWF Advisory Services Inc. | 19,800 | 242 | ||||||
| 2025-05-27 | NP | WCERX - WCM Alternatives: Event-Driven Fund - Investor Class Shares | 44,153 | 0.00 | 540 | 0.37 | ||||
| 2025-07-23 | 13F | Tyche Wealth Partners LLC | 77,079 | -5.58 | 919 | -8.02 | ||||
| 2025-08-07 | 13F | Atala Financial Inc | 78,556 | -46.04 | 936 | -47.42 | ||||
| 2025-08-12 | 13F | MAI Capital Management | 22,654 | 0.04 | 270 | -2.17 | ||||
| 2025-08-13 | 13F | EverSource Wealth Advisors, LLC | 3,300 | 0.00 | 39 | -2.50 | ||||
| 2025-05-09 | 13F | Atria Wealth Solutions, Inc. | 0 | -100.00 | 0 | |||||
| 2025-07-29 | 13F | Stratos Wealth Partners, LTD. | 29,786 | -1.74 | 355 | -4.05 | ||||
| 2025-07-28 | 13F | Duncker Streett & Co Inc | 40,409 | 482 | ||||||
| 2025-08-08 | 13F | City Of London Investment Management Co Ltd | 0 | -100.00 | 0 | |||||
| 2025-08-14 | 13F | Karpus Management, Inc. | 25,203 | -52.91 | 300 | -54.13 | ||||
| 2025-07-08 | 13F | FF Advisors,LLC | 85,039 | 0.00 | 1,014 | -0.59 | ||||
| 2025-08-14 | 13F | Comerica Bank | 24,716 | 0.13 | 295 | -2.33 | ||||
| 2025-08-12 | 13F | Pathstone Holdings, LLC | 0 | -100.00 | 0 | |||||
| 2025-07-24 | 13F | Us Bancorp \de\ | 38,007 | 0.00 | 453 | -2.37 | ||||
| 2025-07-25 | 13F | Sequoia Financial Advisors, LLC | 55,087 | 657 | ||||||
| 2025-07-17 | 13F | Presper Financial Architects, LLC | 24,966 | 0 | ||||||
| 2025-08-05 | 13F | Aviance Capital Partners, LLC | 27,767 | 9.55 | 331 | 6.80 | ||||
| 2025-05-05 | 13F | Transce3nd, LLC | 0 | -100.00 | 0 | |||||
| 2025-07-18 | 13F | Truist Financial Corp | 202,857 | 159.55 | 2,418 | 153.19 | ||||
| 2025-08-14 | 13F | Hancock Whitney Corp | 12,297 | 0.00 | 147 | -2.67 | ||||
| 2025-08-01 | 13F | Ashton Thomas Private Wealth, LLC | 14,900 | 0.00 | 179 | -2.73 | ||||
| 2025-07-15 | 13F | Financial Management Professionals, Inc. | 1,954 | 2.04 | 23 | 0.00 | ||||
| 2025-08-14 | 13F | CoreCap Advisors, LLC | 3,065 | 0.00 | 37 | -2.70 | ||||
| 2025-08-14 | 13F | Novus Advisors, Llc | 0 | -100.00 | 0 | |||||
| 2025-08-11 | 13F | WPG Advisers, LLC | 1,470 | -35.30 | 18 | -37.04 | ||||
| 2025-08-07 | 13F | King Luther Capital Management Corp | 171 | -2.29 | ||||||
| 2025-05-29 | NP | RYMSX - Guggenheim Multi-Hedge Strategies Fund Class P | 240 | -74.68 | 3 | -83.33 | ||||
| 2025-07-29 | 13F | Signature Estate & Investment Advisors Llc | 23,152 | 0.57 | 276 | -2.14 | ||||
| 2025-07-01 | 13F | Harbor Investment Advisory, Llc | 6,244 | 19.07 | 74 | 15.63 | ||||
| 2025-08-12 | 13F | Intellus Advisors LLC | 85,383 | 0.87 | 1,018 | -1.74 | ||||
| 2025-04-25 | 13F | WASHINGTON TRUST Co | 0 | -100.00 | 0 | |||||
| 2025-08-14 | 13F | Ameriprise Financial Inc | 172,450 | 3.27 | 2,056 | 0.64 | ||||
| 2025-08-14 | 13F | Arete Wealth Advisors, LLC | 21,540 | -0.41 | 0 | |||||
| 2025-08-14 | 13F | Cohen & Steers, Inc. | 376,295 | -7.72 | 4 | 0.00 | ||||
| 2025-08-06 | 13F | Moors & Cabot, Inc. | 18,148 | -9.42 | 216 | -11.84 | ||||
| 2025-07-30 | 13F | Cullen/frost Bankers, Inc. | 0 | -100.00 | 0 | |||||
| 2025-07-09 | 13F | Summit Financial Consulting LLC | 23,596 | 13.22 | 281 | 10.63 | ||||
| 2025-07-18 | 13F | PFG Investments, LLC | 31,993 | 0.36 | 381 | -2.06 | ||||
| 2025-07-29 | 13F | Koshinski Asset Management, Inc. | 32,847 | -4.58 | 392 | -7.13 | ||||
| 2025-08-06 | 13F | Prospera Financial Services Inc | 168,362 | 33.50 | 2,007 | 30.09 | ||||
| 2025-07-24 | 13F | Trust Co Of Toledo Na /oh/ | 1,791 | 21 | ||||||
| 2025-08-05 | 13F | Fourth Dimension Wealth, LLC | 4,267 | 0.00 | 51 | -3.85 | ||||
| 2025-08-13 | 13F | Truvestments Capital Llc | 1,000 | 0.00 | 12 | -8.33 | ||||
| 2025-08-04 | 13F | Simon Quick Advisors, Llc | 16,319 | 2.24 | 195 | -0.51 | ||||
| 2025-08-08 | 13F | Cetera Investment Advisers | 513,512 | 8.06 | 6,121 | 5.33 | ||||
| 2025-08-14 | 13F | Raymond James Financial Inc | 957,530 | 10.32 | 11,414 | 7.53 | ||||
| 2025-07-15 | 13F | Fifth Third Bancorp | 3,168 | 0.00 | 38 | -2.63 | ||||
| 2025-08-11 | 13F | Private Advisor Group, LLC | 62,835 | -11.82 | 749 | -14.12 | ||||
| 2025-08-11 | 13F | Regal Investment Advisors LLC | 33,423 | -0.52 | 398 | -2.93 | ||||
| 2025-08-13 | 13F | Northwestern Mutual Wealth Management Co | 119,615 | -2.23 | 1,426 | -4.75 | ||||
| 2025-08-01 | 13F | Motco | 6,189 | 72 | ||||||
| 2025-08-05 | 13F | Wakefield Asset Management LLLP | 145,938 | -1.53 | 1,740 | -4.03 | ||||
| 2025-08-14 | 13F | Sit Investment Associates Inc | 307,593 | -4.65 | 4 | 0.00 | ||||
| 2025-08-07 | 13F | Allworth Financial LP | 37,251 | 1,729.62 | 444 | 1,830.43 | ||||
| 2025-05-14 | 13F | Mml Investors Services, Llc | 0 | -100.00 | 0 | |||||
| 2025-08-05 | 13F | Uniting Wealth Partners, LLC | 10,138 | 0.75 | 121 | -2.44 | ||||
| 2025-04-17 | 13F | Warther Private Wealth, LLC | 0 | -100.00 | 0 | -100.00 | ||||
| 2025-04-21 | 13F | Nelson, Van Denburg & Campbell Wealth Management Group, LLC | 0 | -100.00 | 0 | |||||
| 2025-07-30 | 13F | Greatmark Investment Partners, Inc. | 322,050 | 6.53 | 3,839 | 3.81 | ||||
| 2025-05-30 | NP | RiverNorth Flexible Municipal Income Fund II, Inc. | 50,107 | 0.00 | 613 | 0.49 | ||||
| 2025-05-29 | NP | RYDEX VARIABLE TRUST - Multi-Hedge Strategies Fund Variable Annuity | 312 | -48.00 | 4 | -57.14 | ||||
| 2025-08-12 | 13F | Coldstream Capital Management Inc | 0 | -100.00 | 0 | |||||
| 2025-08-12 | 13F | Sfmg, Llc | 12,680 | 0.00 | 151 | -2.58 | ||||
| 2025-07-24 | 13F | Eastern Bank | 1,218 | 0.00 | 15 | 0.00 | ||||
| 2025-08-05 | 13F | Scarborough Advisors, LLC | 547 | 7 | ||||||
| 2025-08-06 | 13F | Wedbush Securities Inc | 74,077 | 136.09 | 1 | |||||
| 2025-07-11 | 13F | Congress Park Capital LLC | 590,000 | -7.45 | 7,033 | -9.80 | ||||
| 2025-07-09 | 13F | Sunpointe, LLC | 53,225 | -0.18 | 639 | -2.74 | ||||
| 2025-08-08 | 13F | Pnc Financial Services Group, Inc. | 44,383 | -21.97 | 529 | -23.88 | ||||
| 2025-08-15 | 13F | Morgan Stanley | 4,463,182 | 7.13 | 53,201 | 4.41 | ||||
| 2025-05-14 | 13F | Main Street Group, LTD | 0 | -100.00 | 0 | |||||
| 2025-07-10 | 13F | Piscataqua Savings Bank | 4,760 | 0.00 | 57 | -3.45 | ||||
| 2025-07-22 | 13F | Mascoma Wealth Management LLC | 1,069 | 0.00 | 13 | -7.69 | ||||
| 2025-08-04 | 13F | Assetmark, Inc | 182 | 2 | ||||||
| 2025-07-10 | 13F | Ahl Investment Management, Inc. | 207,067 | -0.12 | 2,468 | -2.64 | ||||
| 2025-06-24 | NP | MMHVX - MainStay MacKay High Yield Municipal Bond Fund Investor Class | 721,308 | 0.00 | 8,591 | -5.33 | ||||
| 2025-07-17 | 13F | Park Place Capital Corp | 64,484 | -23.88 | 773 | -25.48 | ||||
| 2025-09-04 | 13F/A | Advisor Group Holdings, Inc. | 230,525 | 10.44 | 2,748 | 7.64 | ||||
| 2025-07-28 | 13F | Allianz Asset Management GmbH | 462,380 | 0.00 | 5,512 | -2.53 | ||||
| 2025-07-17 | 13F/A | Capital Investment Advisors, LLC | 169,285 | -8.37 | 2,018 | -10.71 | ||||
| 2025-08-14 | 13F | Susquehanna International Group, Llp | 0 | -100.00 | 0 | |||||
| 2025-08-28 | NP | RiverNorth Opportunistic Municipal Income Fund, Inc. | 102,470 | -42.14 | 1,221 | -43.63 | ||||
| 2025-08-11 | 13F | Brass Tax Wealth Management, Inc | 30,830 | 0.00 | 367 | -2.65 | ||||
| 2025-07-22 | 13F | Coastal Investment Advisors, Inc. | 20,502 | 0.00 | 244 | -2.40 | ||||
| 2025-08-05 | 13F | Palogic Value Management, L.P. | 41,710 | 0.00 | 497 | -2.55 | ||||
| 2025-07-11 | 13F | UMA Financial Services, Inc. | 0 | -100.00 | 0 | |||||
| 2025-05-14 | 13F | Landscape Capital Management, L.l.c. | 0 | -100.00 | 0 | |||||
| 2025-07-29 | 13F | Stratos Wealth Advisors, LLC | 65,855 | -2.26 | 785 | -4.85 | ||||
| 2025-05-14 | 13F | Van Hulzen Asset Management, LLC | 0 | -100.00 | 0 | -100.00 | ||||
| 2025-07-15 | 13F | Shulman DeMeo Asset Management LLC | 16,450 | -0.07 | 196 | -2.49 | ||||
| 2025-08-11 | 13F | Walter & Keenan Financial Consulting Co /mi/ /adv | 40,742 | -40.04 | 486 | -41.57 | ||||
| 2025-08-14 | 13F | Quantinno Capital Management LP | 12,496 | 1.99 | 149 | -0.67 | ||||
| 2025-08-01 | 13F | Chilton Capital Management Llc | 2,633 | 0.00 | 31 | -3.12 | ||||
| 2025-07-15 | 13F | SJS Investment Consulting Inc. | 2,581 | 0.00 | 31 | -3.23 | ||||
| 2025-05-12 | 13F | Independent Advisor Alliance | 0 | -100.00 | 0 | |||||
| 2025-08-08 | 13F | Islay Capital Management, Llc | 8,000 | 0.00 | 95 | -2.06 | ||||
| 2025-08-11 | 13F | Lake Street Financial Llc | 208,900 | 48.42 | 2,490 | 44.68 | ||||
| 2025-04-29 | 13F | Brookstone Capital Management | 0 | -100.00 | 0 | |||||
| 2025-05-07 | 13F | WMS Partners, LLC | 0 | -100.00 | 0 | |||||
| 2025-07-16 | 13F/A | CX Institutional | 27,200 | 0.00 | 0 | |||||
| 2025-07-30 | 13F | St. Johns Investment Management Company, LLC | 1,058 | 0.00 | 13 | 0.00 | ||||
| 2025-08-05 | 13F | Mountain Hill Investment Partners Corp. | 11,319 | 0.00 | 135 | -2.90 | ||||
| 2025-08-13 | 13F | Plan Group Financial, LLC | 33,380 | 398 | ||||||
| 2025-08-11 | 13F | Synergy Investment Management, LLC | 0 | -100.00 | 0 | |||||
| 2025-04-21 | 13F | PSI Advisors, LLC | 0 | -100.00 | 0 | |||||
| 2025-08-01 | 13F | Petra Financial Advisors Inc | 119,698 | 1.27 | 1,427 | -1.31 | ||||
| 2025-08-28 | NP | RiverNorth Managed Duration Municipal Income Fund II, Inc. | 80,922 | -36.34 | 965 | -37.97 | ||||
| 2025-05-15 | 13F | Buckingham Strategic Partners | 0 | -100.00 | 0 | |||||
| 2025-07-30 | 13F | FNY Investment Advisers, LLC | 1,600 | 0.00 | 0 | |||||
| 2025-08-19 | 13F | Advisory Services Network, LLC | 39,627 | 464 | ||||||
| 2025-07-24 | 13F | Jfs Wealth Advisors, Llc | 4,140 | 2.00 | 49 | 0.00 | ||||
| 2025-08-13 | 13F | Guggenheim Capital Llc | 1,456,992 | 12.91 | 17,367 | 10.06 | ||||
| 2025-08-12 | 13F | Jpmorgan Chase & Co | 869 | 10 | ||||||
| 2025-07-22 | 13F | Iron Horse Wealth Management, LLC | 3,201 | 0.00 | 38 | -2.56 | ||||
| 2025-08-13 | 13F | McGowan Group Asset Management, Inc. | 381,053 | 4.53 | 4,542 | 1.88 | ||||
| 2025-07-21 | 13F | Catalina Capital Group, LLC | 31,191 | 0.00 | 372 | -2.62 | ||||
| 2025-07-25 | 13F | Concurrent Investment Advisors, LLC | 12,596 | 25.01 | 150 | 21.95 | ||||
| 2025-04-29 | 13F | Hm Payson & Co | 2,517 | -39.74 | 31 | -40.00 | ||||
| 2025-08-04 | 13F | Creekmur Asset Management LLC | 463 | 0.00 | 6 | 0.00 | ||||
| 2025-08-12 | 13F | Global Retirement Partners, LLC | 5,051 | 40.31 | 60 | 39.53 | ||||
| 2025-08-27 | NP | RMMBX - Aspiriant Risk-Managed Municipal Bond Fund | 36,371 | 0.00 | 434 | -2.48 | ||||
| 2025-08-28 | NP | RiverNorth Flexible Municipal Income Fund, Inc. | 155,340 | -31.50 | 1,852 | -33.25 | ||||
| 2025-05-30 | NP | Rivernorth Opportunities Fund, Inc. | 165,021 | -49.31 | 2,018 | -49.05 | ||||
| 2025-08-05 | 13F | Carson Advisory Inc. | 137,038 | -3.99 | 1,633 | -6.42 | ||||
| 2025-08-28 | NP | RNDLX - RiverNorth/DoubleLine Strategic Income Fund Class R | 185,540 | -62.89 | 2,212 | -63.84 | ||||
| 2025-08-14 | 13F | Stifel Financial Corp | 576,183 | -12.26 | 6,868 | -14.48 | ||||
| 2025-08-28 | NP | Cohen & Steers Closed-end Opportunity Fund, Inc. | 225,560 | -12.25 | 2,689 | -14.48 | ||||
| 2025-08-11 | 13F | Principal Securities, Inc. | 629 | 3.28 | 7 | 0.00 | ||||
| 2025-05-30 | NP | RNCOX - RiverNorth Core Opportunity Fund Class R | 27,121 | -60.98 | 332 | -60.83 | ||||
| 2025-07-17 | 13F | Camelot Portfolios, LLC | 23,242 | 6.49 | 277 | 4.14 | ||||
| 2025-07-14 | 13F | Park Avenue Securities Llc | 15,141 | -14.88 | 0 | |||||
| 2025-08-11 | 13F | Rothschild Investment Llc | 11,279 | -90.05 | 134 | -90.34 | ||||
| 2025-07-22 | 13F | Merit Financial Group, LLC | 24,473 | -6.62 | 292 | -9.06 | ||||
| 2025-07-11 | 13F | Farther Finance Advisors, LLC | 144 | 0.00 | 2 | 0.00 | ||||
| 2025-08-14 | 13F | Archetype Wealth Partners | 42,174 | -28.05 | 1 | |||||
| 2025-07-29 | 13F | Primoris Wealth Advisors, Llc | 60,755 | -7.60 | 724 | -9.95 | ||||
| 2025-08-12 | 13F | Horizon Kinetics Asset Management Llc | 38,952 | 0.00 | 464 | -2.52 | ||||
| 2025-08-14 | 13F | Rivernorth Capital Management, Llc | 810,446 | -65.00 | 9,661 | -65.89 | ||||
| 2025-08-14 | 13F | Family Management Corp | 14,889 | 0.00 | 177 | -2.75 | ||||
| 2025-08-05 | 13F | Rareview Capital LLC | 10,442 | -97.38 | 124 | -97.46 | ||||
| 2025-08-08 | 13F | ProVise Management Group, LLC | 17,422 | 0.00 | 208 | -2.82 | ||||
| 2025-08-25 | NP | QWVQX - Clearwater Tax-Exempt Bond Fund | 92,222 | 0.00 | 1,099 | -2.48 | ||||
| 2025-08-08 | 13F | Renasant Bank | 70,284 | -21.05 | 838 | -23.07 | ||||
| 2025-08-12 | 13F | J.w. Cole Advisors, Inc. | 29,237 | 31.96 | 349 | 28.89 |