Mga Batayang Estadistika
| Pemilik Institusional | 114 total, 113 long only, 0 short only, 1 long/short - change of -5.79% MRQ |
| Alokasi Portofolio Rata-rata | 0.0083 % - change of -20.10% MRQ |
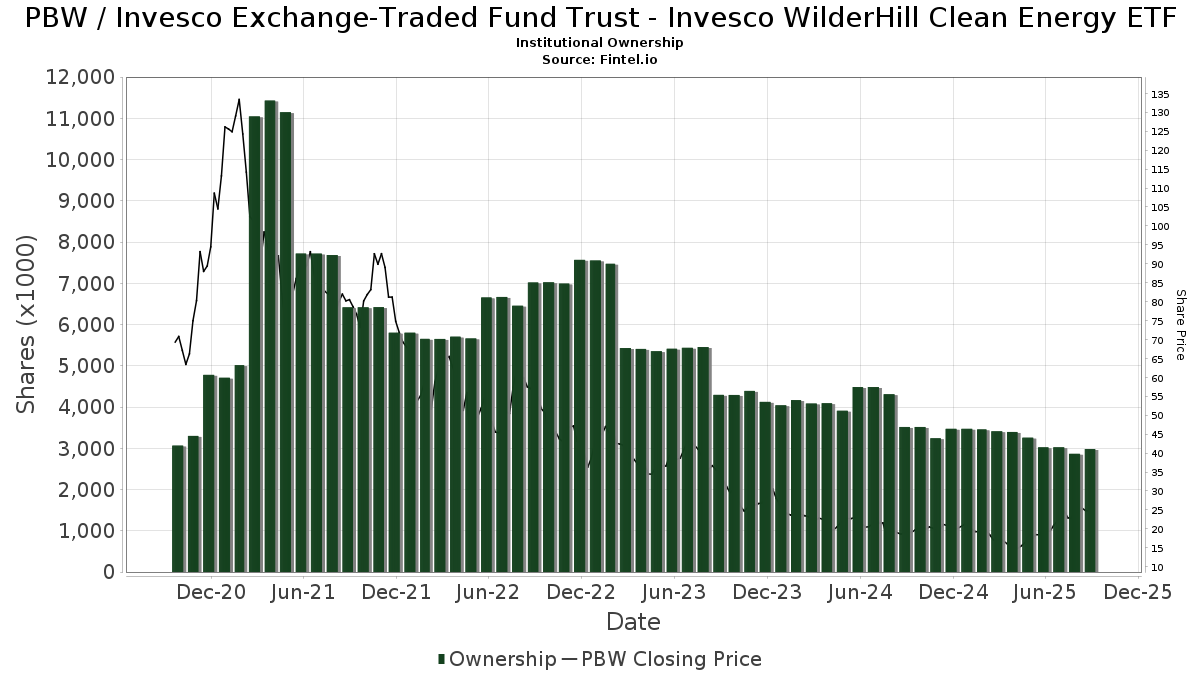
| Saham Institusional (Jangka Panjang) | 2,982,920 (ex 13D/G) - change of -0.04MM shares -1.33% MRQ |
| Nilai Institusional (Jangka Panjang) | $ 58,906 USD ($1000) |
Kepemilikan Institusional dan Pemegang Saham
Invesco Exchange-Traded Fund Trust - Invesco WilderHill Clean Energy ETF (US:PBW) memiliki 114 pemilik institusional dan pemegang saham yang telah mengajukan formulir 13D/G atau 13F kepada Komisi Bursa Efek (Securities Exchange Commission/SEC). Lembaga-lembaga ini memegang total 2,982,920 saham. Pemegang saham terbesar meliputi Morgan Stanley, Bank Of America Corp /de/, Bnp Paribas Arbitrage, Sa, Allianz Se, Goldman Sachs Group Inc, Raymond James Financial Inc, Susquehanna International Group, Llp, Envestnet Portfolio Solutions, Inc., UBS Group AG, and Family Firm, Inc. .
Struktur kepemilikan institusional Invesco Exchange-Traded Fund Trust - Invesco WilderHill Clean Energy ETF (ARCA:PBW) menunjukkan posisi terkini di perusahaan oleh institusi dan dana, serta perubahan terbaru dalam ukuran posisi. Pemegang saham utama dapat mencakup investor individu, reksa dana, dana lindung nilai, atau institusi. Jadwal 13D menunjukkan bahwa investor memegang (atau pernah memegang) lebih dari 5% saham perusahaan dan bermaksud (atau pernah bermaksud) untuk secara aktif mengejar perubahan strategi bisnis. Jadwal 13G menunjukkan investasi pasif lebih dari 5%.
The share price as of September 5, 2025 is 25.52 / share. Previously, on September 9, 2024, the share price was 17.81 / share. This represents an increase of 43.29% over that period.
Skor Sentimen Dana
Skor Sentimen Dana (sebelumnya dikenal sebagai Skor Akumulasi Kepemilikan) menemukan saham-saham yang paling banyak dibeli oleh dana. Ini adalah hasil dari model kuantitatif multi-faktor yang canggih yang mengidentifikasi perusahaan dengan tingkat akumulasi institusional tertinggi. Model penilaian menggunakan kombinasi dari total peningkatan pemilik yang diungkapkan, perubahan dalam alokasi portofolio pada pemilik tersebut, dan metrik lainnya. Angka berkisar dari 0 hingga 100, dengan angka yang lebih tinggi menunjukkan tingkat akumulasi yang lebih tinggi dibandingkan dengan perusahaan sejenisnya, dan 50 adalah rata-ratanya.
Frekuensi Pembaruan: Setiap Hari
Lihat Ownership Explorer, yang menyediakan daftar perusahaan dengan peringkat tertinggi.
Rasio Put/Call Institusional
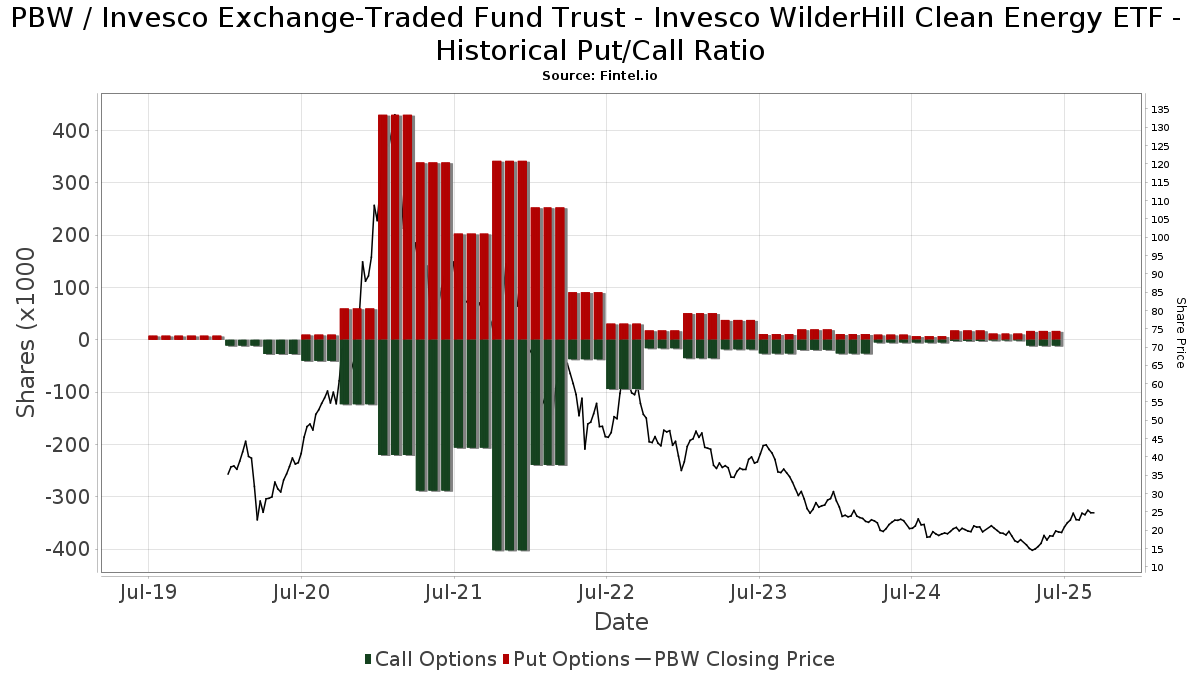
Selain melaporkan isu ekuitas dan utang standar, institusi dengan aset di bawah manajemen lebih dari 100 juta dolar AS juga harus mengungkapkan kepemilikan opsi put dan call mereka. Karena opsi put umumnya menunjukkan sentimen negatif, dan opsi call menunjukkan sentimen positif, kita dapat mengetahui sentimen institusional secara keseluruhan dengan memplot rasio put terhadap call. Grafik di sebelah kanan memplot rasio put/call historis untuk instrumen ini.
Menggunakan Rasio Put/Call sebagai indikator sentimen investor mengatasi salah satu kekurangan utama dari penggunaan total kepemilikan institusional, yaitu sejumlah besar aset yang dikelola diinvestasikan secara pasif untuk melacak indeks. Dana yang dikelola secara pasif biasanya tidak membeli opsi, sehingga indikator rasio put/call lebih akurat dalam melacak sentimen dana yang dikelola secara aktif.
Pengajuan 13F dan NPORT
Detail pada pengajuan 13F tersedia gratis. Detail pada pengajuan NP memerlukan keanggotaan premium. Baris berwarna hijau menunjukkan posisi baru. Baris berwarna merah menunjukkan posisi yang sudah ditutup. Klik tautan ini ikon untuk melihat riwayat transaksi selengkapnya.
Tingkatkan
untuk membuka data premium dan mengekspor ke Excel ![]() .
.
| Tanggal File | Sumber | Investor | Ketik | Presyo ng Avg (Silangan) |
Saham | Δ Saham (%) |
Dilaporkan Nilai ($1000) |
Nilai Δ (%) |
Alokasi Port (%) |
|
|---|---|---|---|---|---|---|---|---|---|---|
| 2025-08-18 | 13F | Geneos Wealth Management Inc. | 126 | 0.00 | 3 | 100.00 | ||||
| 2025-08-04 | 13F | Center for Financial Planning, Inc. | 160 | 0.00 | 3 | 50.00 | ||||
| 2025-08-07 | 13F | LFA - Lugano Financial Advisors SA | 0 | -100.00 | 0 | |||||
| 2025-08-07 | 13F | Flagship Wealth Advisors, Llc | 580 | 104.23 | 12 | 175.00 | ||||
| 2025-03-12 | 13F/A | Private Capital Management Llc | 134 | 0.00 | 3 | -33.33 | ||||
| 2025-08-12 | 13F | LPL Financial LLC | 52,579 | 5.83 | 1,047 | 33.89 | ||||
| 2025-08-14 | 13F | Wells Fargo & Company/mn | 30,909 | -20.71 | 616 | 0.33 | ||||
| 2025-08-18 | 13F | Pacific Center for Financial Services | 201 | 0.00 | 4 | 33.33 | ||||
| 2025-05-14 | 13F | Stifel Financial Corp | 0 | -100.00 | 0 | |||||
| 2025-07-25 | 13F | NorthRock Partners, LLC | 850 | 0.00 | 17 | 23.08 | ||||
| 2025-08-08 | 13F | Emerald Investment Partners, Llc | 124 | 0.00 | 2 | 100.00 | ||||
| 2025-08-12 | 13F | BlackRock, Inc. | 6,408 | 148.18 | 128 | 217.50 | ||||
| 2025-08-15 | 13F | Morgan Stanley | 747,941 | 2.02 | 14,899 | 29.12 | ||||
| 2025-04-01 | 13F | Modus Advisors, LLC | 0 | -100.00 | 0 | -100.00 | ||||
| 2025-08-14 | 13F | Bnp Paribas Arbitrage, Sa | 299,315 | 106.99 | 5,962 | 161.95 | ||||
| 2025-07-25 | 13F | Community Bank, N.A. | 323 | 0.00 | 6 | 20.00 | ||||
| 2025-08-14 | 13F | Comerica Bank | 2,984 | 63.87 | 59 | 110.71 | ||||
| 2025-08-14 | 13F | Royal Bank Of Canada | 46,150 | 95.27 | 919 | 147.04 | ||||
| 2025-04-29 | 13F | Hm Payson & Co | 1,004 | 0.00 | 16 | -25.00 | ||||
| 2025-07-24 | 13F | Jfs Wealth Advisors, Llc | 0 | -100.00 | 0 | |||||
| 2025-08-14 | 13F | GWM Advisors LLC | 188 | 0.00 | 4 | 50.00 | ||||
| 2025-08-08 | 13F | MTM Investment Management, LLC | 55 | 0.00 | 1 | |||||
| 2025-05-13 | 13F | Aptus Capital Advisors, LLC | 0 | -100.00 | 0 | |||||
| 2025-08-08 | 13F | Glassman Wealth Services | 572 | 11 | ||||||
| 2025-07-24 | 13F | IFP Advisors, Inc | 758 | 2.85 | 15 | 36.36 | ||||
| 2025-07-25 | 13F | Natural Investments, Llc | 0 | -100.00 | 0 | |||||
| 2025-05-14 | 13F | Jane Street Group, Llc | 0 | -100.00 | 0 | |||||
| 2025-08-12 | 13F | MAI Capital Management | 5,296 | -19.39 | 106 | 1.94 | ||||
| 2025-07-15 | 13F | North Star Investment Management Corp. | 1,470 | 0.00 | 29 | 26.09 | ||||
| 2025-08-07 | 13F | CENTRAL TRUST Co | 200 | 0.00 | 4 | 0.00 | ||||
| 2025-08-05 | 13F | EPG Wealth Management LLC | 0 | -100.00 | 0 | |||||
| 2025-08-12 | 13F | Global Retirement Partners, LLC | 256 | 0.00 | 5 | 0.00 | ||||
| 2025-08-14 | 13F | Goldman Sachs Group Inc | 261,750 | 10.17 | 5,214 | 39.45 | ||||
| 2025-07-08 | 13F | Prism Advisors, Inc. | 10,638 | 3.18 | 212 | 30.25 | ||||
| 2025-07-10 | 13F | Piscataqua Savings Bank | 71 | 0.00 | 1 | 0.00 | ||||
| 2025-08-08 | 13F | Pnc Financial Services Group, Inc. | 1,929 | 0.00 | 38 | 26.67 | ||||
| 2025-08-12 | 13F | Jpmorgan Chase & Co | 1,415 | 42.93 | 28 | 86.67 | ||||
| 2025-08-06 | 13F | S&t Bank/pa | 140 | 0.00 | 3 | 0.00 | ||||
| 2025-08-08 | 13F | Hartland & Co., LLC | 100 | 0.00 | 2 | 0.00 | ||||
| 2025-08-07 | 13F | 1620 Investment Advisors, Inc. | 351 | 0.00 | 7 | 20.00 | ||||
| 2025-08-12 | 13F | Ameritas Investment Partners, Inc. | 197 | 0.00 | 4 | 0.00 | ||||
| 2025-08-14 | 13F | UBS Group AG | 69,598 | 102.67 | 1,386 | 156.67 | ||||
| 2025-08-11 | 13F | Citigroup Inc | 29,118 | 24.71 | 580 | 58.04 | ||||
| 2025-08-18 | 13F/A | National Bank Of Canada /fi/ | 2,592 | 22.55 | 52 | 54.55 | ||||
| 2025-07-07 | 13F | Thurston, Springer, Miller, Herd & Titak, Inc. | 30 | 0.00 | 1 | |||||
| 2025-07-08 | 13F | Parallel Advisors, LLC | 3 | -96.34 | 0 | -100.00 | ||||
| 2025-08-08 | 13F | Your Advocates Ltd., LLP | 131 | 0.00 | 3 | 0.00 | ||||
| 2025-07-31 | 13F | Wealthfront Advisers Llc | 24,644 | -13.34 | 491 | 9.62 | ||||
| 2025-08-11 | 13F | Wealthspire Advisors, LLC | 10,295 | -23.38 | 205 | -2.84 | ||||
| 2025-08-14 | 13F | Bank Of America Corp /de/ | 399,923 | -6.36 | 7,966 | 18.51 | ||||
| 2025-08-15 | 13F | Provenance Wealth Advisors, LLC | 0 | -100.00 | 0 | -100.00 | ||||
| 2025-08-08 | 13F | Fortis Group Advisors, LLC | 133 | 0.00 | 3 | 0.00 | ||||
| 2025-08-11 | 13F | Rothschild Investment Llc | 15 | 0.00 | 0 | |||||
| 2025-08-08 | 13F | Tanglewood Legacy Advisors, LLC | 1,223 | 0.16 | 24 | 26.32 | ||||
| 2025-08-14 | 13F | Federation des caisses Desjardins du Quebec | 1,205 | -10.41 | 24 | 14.29 | ||||
| 2025-08-08 | 13F | Cetera Investment Advisers | 13,880 | 8.97 | 276 | 38.00 | ||||
| 2025-07-24 | 13F | Stonebridge Financial Group, LLC | 0 | -100.00 | 0 | |||||
| 2025-08-13 | 13F | Kayne Anderson Rudnick Investment Management Llc | 125 | 0.00 | 2 | 100.00 | ||||
| 2025-08-08 | 13F | Family Firm, Inc. | 59,559 | -5.55 | 1,186 | 19.56 | ||||
| 2025-08-29 | 13F | Evolution Wealth Management Inc. | 311 | 6 | ||||||
| 2025-08-14 | 13F | Susquehanna International Group, Llp | Put | 17,700 | 353 | |||||
| 2025-08-14 | 13F | Susquehanna International Group, Llp | 73,535 | 28.20 | 1,465 | 62.31 | ||||
| 2025-05-15 | 13F | D. E. Shaw & Co., Inc. | 0 | -100.00 | 0 | |||||
| 2025-08-14 | 13F | Susquehanna International Group, Llp | Call | 11,600 | 231 | |||||
| 2025-07-10 | 13F | Moller Financial Services | 37,709 | 13.44 | 751 | 43.59 | ||||
| 2025-08-13 | 13F | Quadrant Capital Group Llc | 0 | -100.00 | 0 | |||||
| 2025-08-15 | 13F | Tower Research Capital LLC (TRC) | 43,126 | 859 | ||||||
| 2025-08-14 | 13F | Citadel Advisors Llc | Put | 0 | -100.00 | 0 | ||||
| 2025-05-12 | 13F | Founders Financial Alliance, LLC | 0 | -100.00 | 0 | |||||
| 2025-07-21 | 13F | Ameritas Advisory Services, LLC | 180 | 4 | ||||||
| 2025-07-15 | 13F | Retirement Income Solutions, Inc | 0 | -100.00 | 0 | |||||
| 2025-08-12 | 13F | Proequities, Inc. | 0 | 0 | ||||||
| 2025-04-29 | 13F | Harel Insurance Investments & Financial Services Ltd. | 0 | -100.00 | 0 | |||||
| 2025-05-14 | 13F | Legend Financial Advisors, Inc. | 0 | -100.00 | 0 | |||||
| 2025-07-15 | 13F | Financial Management Professionals, Inc. | 15 | 0.00 | 0 | |||||
| 2025-08-08 | 13F | Allianz Se | 264,068 | 20.54 | 5,260 | 52.55 | ||||
| 2025-08-11 | 13F | Principal Securities, Inc. | 25 | 0.00 | 0 | |||||
| 2025-08-13 | 13F | Northwestern Mutual Wealth Management Co | 3,236 | -9.30 | 64 | 14.29 | ||||
| 2025-08-14 | 13F | Citadel Advisors Llc | Call | 0 | -100.00 | 0 | ||||
| 2025-07-03 | 13F | Garde Capital, Inc. | 11 | 0.00 | 0 | |||||
| 2025-07-31 | 13F | Sage Mountain Advisors LLC | 4 | 0.00 | 0 | |||||
| 2025-08-14 | 13F/A | Barclays Plc | 770 | 0.00 | 0 | |||||
| 2025-07-21 | 13F | Mirae Asset Global Investments Co., Ltd. | 4,400 | 88 | ||||||
| 2025-07-23 | 13F | Hager Investment Management Services, Llc | 167 | 0.00 | 3 | 50.00 | ||||
| 2025-08-01 | 13F | Envestnet Asset Management Inc | 13,656 | -3.58 | 272 | 22.52 | ||||
| 2025-08-07 | 13F | Allworth Financial LP | 1,746 | 1,095.89 | 35 | 1,600.00 | ||||
| 2025-04-30 | 13F | Cerity Partners LLC | 0 | -100.00 | 0 | |||||
| 2025-07-11 | 13F | Farther Finance Advisors, LLC | 66 | 0.00 | 1 | 0.00 | ||||
| 2025-07-17 | 13F | City Holding Co | 0 | -100.00 | 0 | |||||
| 2025-07-14 | 13F | UMA Financial Services, Inc. | 736 | 5.29 | 15 | 27.27 | ||||
| 2025-07-17 | 13F | Elwood & Goetz Wealth Advisory Group, LLC | 17,316 | 345 | ||||||
| 2025-04-29 | 13F | Capital Investment Advisory Services, LLC | 0 | -100.00 | 0 | |||||
| 2025-07-16 | 13F/A | CX Institutional | 8,935 | -80.83 | 0 | |||||
| 2025-05-09 | 13F | Evolution Wealth Advisors, LLC | 0 | -100.00 | 0 | |||||
| 2025-07-14 | 13F | Armstrong Advisory Group, Inc | 30 | 0.00 | 1 | |||||
| 2025-07-24 | 13F | Trust Co Of Toledo Na /oh/ | 24 | 0 | ||||||
| 2025-09-04 | 13F/A | Advisor Group Holdings, Inc. | 39,829 | 3.89 | 793 | 31.51 | ||||
| 2025-07-09 | 13F | Breakwater Investment Management | 331 | 0.00 | 7 | 20.00 | ||||
| 2025-07-29 | 13F | Activest Wealth Management | 300 | 0.00 | 6 | 25.00 | ||||
| 2025-08-14 | 13F | Raymond James Financial Inc | 116,310 | -14.94 | 2,317 | 7.62 | ||||
| 2025-08-14 | 13F | Fmr Llc | 225 | -80.33 | 4 | -77.78 | ||||
| 2025-08-05 | 13F | Simplex Trading, Llc | 0 | -100.00 | 0 | |||||
| 2025-08-06 | 13F | First Horizon Advisors, Inc. | 712 | -10.33 | 14 | 16.67 | ||||
| 2025-08-11 | 13F | Tidemark, LLC | 0 | -100.00 | 0 | |||||
| 2025-07-16 | 13F | TigerOak Management, L.L.C. | 18,079 | -3.71 | 360 | 22.03 | ||||
| 2025-04-23 | 13F | Spire Wealth Management | 0 | -100.00 | 0 | |||||
| 2025-07-28 | 13F | BRYN MAWR TRUST Co | 188 | -34.72 | 4 | -25.00 | ||||
| 2025-05-15 | 13F | Alpine Global Management, LLC | 0 | -100.00 | 0 | -100.00 | ||||
| 2025-08-06 | 13F | SOUTH STATE Corp | 134 | 0.00 | 3 | 0.00 | ||||
| 2025-08-05 | 13F | Bank Of Montreal /can/ | 96 | 2 | ||||||
| 2025-08-18 | 13F | Hollencrest Capital Management | 35 | 0.00 | 1 | |||||
| 2025-08-06 | 13F | Commonwealth Equity Services, Llc | 16,595 | -59.90 | 0 | |||||
| 2025-07-29 | 13F | Private Trust Co Na | 0 | -100.00 | 0 | |||||
| 2025-07-18 | 13F | Bartlett & Co. Wealth Management Llc | 0 | -100.00 | 0 | |||||
| 2025-04-22 | 13F | Cambridge Investment Research Advisors, Inc. | 0 | -100.00 | 0 | |||||
| 2025-05-05 | 13F | Nwam Llc | 0 | -100.00 | 0 | |||||
| 2025-07-17 | 13F | Vermillion Wealth Management, Inc. | 464 | 0.22 | 9 | 28.57 | ||||
| 2025-08-08 | 13F | Gts Securities Llc | 44,093 | 878 | ||||||
| 2025-07-18 | 13F | SOA Wealth Advisors, LLC. | 368 | 0.27 | 7 | 40.00 | ||||
| 2025-07-24 | 13F | Us Bancorp \de\ | 114 | -24.00 | 2 | 0.00 | ||||
| 2025-08-13 | 13F | Quadrature Capital Ltd | 0 | -100.00 | 0 | |||||
| 2025-08-13 | 13F | Continuum Advisory, LLC | 0 | -100.00 | 0 | |||||
| 2025-07-21 | 13F | Kennebec Savings Bank | 303 | 0.00 | 6 | 50.00 | ||||
| 2025-08-13 | 13F | Mount Yale Investment Advisors, LLC | 260 | 5 | ||||||
| 2025-08-14 | 13F | Hrt Financial Lp | 0 | -100.00 | 0 | |||||
| 2025-08-13 | 13F | Millstone Evans Group, LLC | 357 | 0.00 | 7 | 40.00 | ||||
| 2025-08-06 | 13F | AE Wealth Management LLC | 10 | -98.31 | 0 | -100.00 | ||||
| 2025-08-12 | 13F | Steward Partners Investment Advisory, Llc | 3,505 | 0.00 | 70 | 25.45 | ||||
| 2025-07-30 | 13F | Financial Perspectives, Inc | 581 | 0.00 | 12 | 22.22 | ||||
| 2025-08-14 | 13F | McIlrath & Eck, LLC | 590 | 0.17 | 12 | 22.22 | ||||
| 2025-08-19 | 13F | Newbridge Financial Services Group, Inc. | 7 | 0.00 | 0 | |||||
| 2025-07-16 | 13F | Register Financial Advisors LLC | 65 | 0.00 | 1 | 0.00 | ||||
| 2025-07-17 | 13F | Albion Financial Group /ut | 1,397 | 0.00 | 28 | 28.57 | ||||
| 2025-08-14 | 13F | Ameriprise Financial Inc | 18,329 | -21.96 | 365 | -1.08 | ||||
| 2025-07-24 | 13F | Bernard Wealth Management Corp. | 12 | -40.00 | 0 | |||||
| 2025-05-15 | 13F | Citadel Advisors Llc | 0 | -100.00 | 0 | |||||
| 2025-05-15 | 13F | Bnp Paribas | 0 | -100.00 | 0 | |||||
| 2025-08-05 | 13F | GPS Wealth Strategies Group, LLC | 314 | -11.55 | 6 | 20.00 | ||||
| 2025-08-13 | 13F | Johnson Financial Group, Inc. | 2,087 | 42 | ||||||
| 2025-08-14 | 13F | EP Wealth Advisors, Inc. | 7,217 | -4.75 | 144 | 20.17 | ||||
| 2025-07-10 | 13F | Tompkins Financial Corp | 0 | -100.00 | 0 | |||||
| 2025-08-12 | 13F | Tradition Wealth Management, LLC | 11,949 | -5.42 | 238 | 20.20 | ||||
| 2025-08-12 | 13F | New Republic Capital, LLC | 41 | 0.00 | 1 | |||||
| 2025-07-16 | 13F | Townsend Asset Management Corp /nc/ /adv | 740 | -73.17 | 15 | -67.44 | ||||
| 2025-07-29 | 13F | John G Ullman & Associates Inc | 0 | -100.00 | 0 | |||||
| 2025-07-10 | 13F | Wealth Enhancement Advisory Services, Llc | 34,623 | 37.13 | 749 | 88.41 | ||||
| 2025-07-28 | 13F | Harbour Investments, Inc. | 158 | -16.40 | 3 | 50.00 | ||||
| 2025-08-01 | 13F | Motco | 2,245 | 0.00 | 51 | 45.71 | ||||
| 2025-08-19 | 13F | Asset Dedication, LLC | 46 | 0.00 | 1 | |||||
| 2025-07-25 | 13F | Envestnet Portfolio Solutions, Inc. | 70,530 | -15.37 | 1,405 | 7.09 | ||||
| 2025-08-12 | 13F | Howe & Rusling Inc | 4,060 | -35.55 | 81 | -19.19 | ||||
| 2025-08-11 | 13F | TD Waterhouse Canada Inc. | 54 | 0.00 | 1 | |||||
| 2025-07-18 | 13F | Truist Financial Corp | 27,824 | 7.83 | 554 | 36.45 | ||||
| 2025-08-12 | 13F | Wood Tarver Financial Group, LLC | 29 | 0.00 | 0 |
Other Listings
| MX:PBW |