Mga Batayang Estadistika
| Pemilik Institusional | 127 total, 127 long only, 0 short only, 0 long/short - change of -3.79% MRQ |
| Alokasi Portofolio Rata-rata | 0.2090 % - change of -18.02% MRQ |
| Saham Institusional (Jangka Panjang) | 7,420,192 (ex 13D/G) - change of -0.83MM shares -10.11% MRQ |
| Nilai Institusional (Jangka Panjang) | $ 345,454 USD ($1000) |
Kepemilikan Institusional dan Pemegang Saham
Invesco Exchange-Traded Fund Trust - Invesco Dividend Achievers ETF (US:PFM) memiliki 127 pemilik institusional dan pemegang saham yang telah mengajukan formulir 13D/G atau 13F kepada Komisi Bursa Efek (Securities Exchange Commission/SEC). Lembaga-lembaga ini memegang total 7,420,192 saham. Pemegang saham terbesar meliputi LPL Financial LLC, Raymond James Financial Inc, Morgan Stanley, Hartland & Co., LLC, Bank Of America Corp /de/, Wells Fargo & Company/mn, Jones Financial Companies Lllp, Royal Bank Of Canada, Citizens Financial Group Inc/ri, and NFP Retirement, Inc. .
Struktur kepemilikan institusional Invesco Exchange-Traded Fund Trust - Invesco Dividend Achievers ETF (NasdaqGM:PFM) menunjukkan posisi terkini di perusahaan oleh institusi dan dana, serta perubahan terbaru dalam ukuran posisi. Pemegang saham utama dapat mencakup investor individu, reksa dana, dana lindung nilai, atau institusi. Jadwal 13D menunjukkan bahwa investor memegang (atau pernah memegang) lebih dari 5% saham perusahaan dan bermaksud (atau pernah bermaksud) untuk secara aktif mengejar perubahan strategi bisnis. Jadwal 13G menunjukkan investasi pasif lebih dari 5%.
The share price as of September 5, 2025 is 49.74 / share. Previously, on September 9, 2024, the share price was 45.19 / share. This represents an increase of 10.08% over that period.

Skor Sentimen Dana
Skor Sentimen Dana (sebelumnya dikenal sebagai Skor Akumulasi Kepemilikan) menemukan saham-saham yang paling banyak dibeli oleh dana. Ini adalah hasil dari model kuantitatif multi-faktor yang canggih yang mengidentifikasi perusahaan dengan tingkat akumulasi institusional tertinggi. Model penilaian menggunakan kombinasi dari total peningkatan pemilik yang diungkapkan, perubahan dalam alokasi portofolio pada pemilik tersebut, dan metrik lainnya. Angka berkisar dari 0 hingga 100, dengan angka yang lebih tinggi menunjukkan tingkat akumulasi yang lebih tinggi dibandingkan dengan perusahaan sejenisnya, dan 50 adalah rata-ratanya.
Frekuensi Pembaruan: Setiap Hari
Lihat Ownership Explorer, yang menyediakan daftar perusahaan dengan peringkat tertinggi.
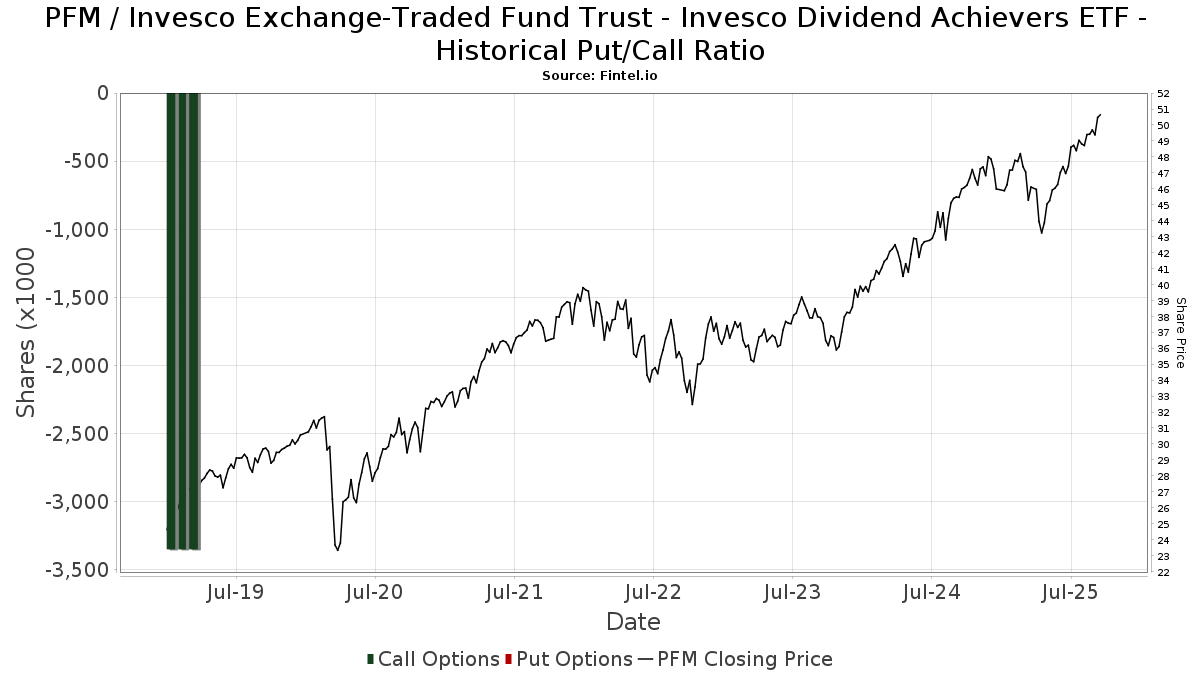
Rasio Put/Call Institusional
Selain melaporkan isu ekuitas dan utang standar, institusi dengan aset di bawah manajemen lebih dari 100 juta dolar AS juga harus mengungkapkan kepemilikan opsi put dan call mereka. Karena opsi put umumnya menunjukkan sentimen negatif, dan opsi call menunjukkan sentimen positif, kita dapat mengetahui sentimen institusional secara keseluruhan dengan memplot rasio put terhadap call. Grafik di sebelah kanan memplot rasio put/call historis untuk instrumen ini.
Menggunakan Rasio Put/Call sebagai indikator sentimen investor mengatasi salah satu kekurangan utama dari penggunaan total kepemilikan institusional, yaitu sejumlah besar aset yang dikelola diinvestasikan secara pasif untuk melacak indeks. Dana yang dikelola secara pasif biasanya tidak membeli opsi, sehingga indikator rasio put/call lebih akurat dalam melacak sentimen dana yang dikelola secara aktif.
Pengajuan 13F dan NPORT
Detail pada pengajuan 13F tersedia gratis. Detail pada pengajuan NP memerlukan keanggotaan premium. Baris berwarna hijau menunjukkan posisi baru. Baris berwarna merah menunjukkan posisi yang sudah ditutup. Klik tautan ini ikon untuk melihat riwayat transaksi selengkapnya.
Tingkatkan
untuk membuka data premium dan mengekspor ke Excel ![]() .
.
| Tanggal File | Sumber | Investor | Ketik | Presyo ng Avg (Silangan) |
Saham | Δ Saham (%) |
Dilaporkan Nilai ($1000) |
Nilai Δ (%) |
Alokasi Port (%) |
|
|---|---|---|---|---|---|---|---|---|---|---|
| 2025-07-28 | 13F | Nestegg Advisors, Inc. | 51,325 | -1.42 | 2,472 | 3.73 | ||||
| 2025-07-10 | 13F | Wealth Enhancement Advisory Services, Llc | 10,147 | 17.36 | 496 | 25.57 | ||||
| 2025-07-17 | 13F | PMG Wealth Management, Inc. | 6,485 | -2.99 | 312 | 1.96 | ||||
| 2025-08-15 | 13F | Tower Research Capital LLC (TRC) | 0 | -100.00 | 0 | |||||
| 2025-08-13 | 13F | Rsm Us Wealth Management Llc | 105,410 | -0.11 | 5,078 | 5.11 | ||||
| 2025-07-07 | 13F | Nova Wealth Management, Inc. | 2,258 | -10.72 | 109 | -6.09 | ||||
| 2025-08-08 | 13F | Creative Planning | 9,404 | 1.72 | 453 | 6.86 | ||||
| 2025-08-11 | 13F | Aptus Capital Advisors, LLC | 9,040 | 0.00 | 435 | 5.33 | ||||
| 2025-08-04 | 13F | Assetmark, Inc | 111 | 5 | ||||||
| 2025-08-12 | 13F | Change Path, LLC | 69,363 | 9.29 | 3,341 | 15.01 | ||||
| 2025-08-14 | 13F | IHT Wealth Management, LLC | 8,754 | 13.66 | 422 | 19.60 | ||||
| 2025-07-15 | 13F | Bfsg, Llc | 293 | 14 | ||||||
| 2025-07-24 | 13F | Advanced Asset Management Advisors Inc | 1,380 | 0.00 | 66 | 4.76 | ||||
| 2025-08-14 | 13F | Susquehanna International Group, Llp | 5,454 | 263 | ||||||
| 2025-06-26 | NP | DWTFX - ARROW DWA TACTICAL FUND CLASS A SHARES | 71,347 | -4.10 | 3,214 | -8.95 | ||||
| 2025-08-08 | 13F | Capital Investment Advisory Services, LLC | 1,950 | 0.00 | 94 | 4.49 | ||||
| 2025-08-08 | 13F | Cetera Investment Advisers | 53,841 | -30.67 | 2,594 | -27.04 | ||||
| 2025-08-14 | 13F | Financial Network Wealth Advisors LLC | 0 | -100.00 | 0 | |||||
| 2025-08-15 | 13F | Kestra Advisory Services, LLC | 6,646 | -4.06 | 320 | 0.95 | ||||
| 2025-07-23 | 13F | Steel Peak Wealth Management LLC | 17,283 | -88.66 | 833 | -88.08 | ||||
| 2025-07-11 | 13F | Farther Finance Advisors, LLC | 3,991 | 0.00 | 192 | 5.49 | ||||
| 2025-08-11 | 13F | HighTower Advisors, LLC | 36,301 | -0.71 | 1,749 | 4.48 | ||||
| 2025-08-08 | 13F | Capital Investment Counsel, Inc | 0 | -100.00 | 0 | |||||
| 2025-08-14 | 13F | First Manhattan Co | 6,400 | 0.00 | 308 | 5.48 | ||||
| 2025-08-14 | 13F | Mercer Global Advisors Inc /adv | 5,186 | -0.10 | 250 | 5.06 | ||||
| 2025-08-14 | 13F | Hilton Capital Management, LLC | 20,056 | 0.00 | 966 | 5.23 | ||||
| 2025-08-15 | 13F | Equitable Holdings, Inc. | 53,110 | 2.97 | 2,558 | 8.34 | ||||
| 2025-08-04 | 13F | Flagship Harbor Advisors, Llc | 17,755 | 3.12 | 855 | 8.50 | ||||
| 2025-07-31 | 13F | Briaud Financial Planning, Inc | 3,890 | 0 | ||||||
| 2025-08-12 | 13F | Steward Partners Investment Advisory, Llc | 45,402 | 3.63 | 2,187 | 9.03 | ||||
| 2025-07-17 | 13F | XML Financial, LLC | 5,056 | -5.21 | 244 | -0.41 | ||||
| 2025-08-11 | 13F | Dorsey Wright & Associates | 0 | -100.00 | 0 | |||||
| 2025-08-11 | 13F | Private Advisor Group, LLC | 47,373 | 55.85 | 2,282 | 63.98 | ||||
| 2025-05-16 | 13F | Coppell Advisory Solutions LLC | 0 | -100.00 | 0 | |||||
| 2025-07-30 | 13F | Wbh Advisory Inc | 10,461 | -6.76 | 504 | -1.95 | ||||
| 2025-08-07 | 13F | Ibex Wealth Advisors | 8,461 | 408 | ||||||
| 2025-08-13 | 13F | Sanibel Captiva Trust Company, Inc. | 10,850 | -13.60 | 523 | -9.06 | ||||
| 2025-07-11 | 13F | Bond & Devick Financial Network, Inc. | 13,561 | 0.00 | 653 | 5.32 | ||||
| 2025-08-08 | 13F | Good Life Advisors, LLC | 7,234 | 14.30 | 348 | 20.42 | ||||
| 2025-07-17 | 13F | Wagner Wealth Management, Llc | 18 | 0.00 | 1 | |||||
| 2025-08-18 | 13F | Geneos Wealth Management Inc. | 1,425 | 0.00 | 69 | 4.62 | ||||
| 2025-07-22 | 13F | Brown Miller Wealth Management, LLC | 0 | -100.00 | 0 | |||||
| 2025-07-22 | 13F | Iron Horse Wealth Management, LLC | 204 | 0.00 | 10 | 0.00 | ||||
| 2025-04-09 | 13F | St Germain D J Co Inc | 0 | -100.00 | 0 | |||||
| 2025-07-08 | 13F | Webster Bank, N. A. | 570 | 0.00 | 27 | 3.85 | ||||
| 2025-08-11 | 13F | Citigroup Inc | 2,977 | 0.00 | 143 | 5.15 | ||||
| 2025-08-14 | 13F/A | Rockefeller Capital Management L.P. | 105,334 | -0.96 | 5,074 | 4.19 | ||||
| 2025-08-08 | 13F | Hartland & Co., LLC | 426,266 | -1.13 | 20,533 | 4.03 | ||||
| 2025-08-12 | 13F | Proequities, Inc. | 0 | 0 | ||||||
| 2025-08-14 | 13F | Mariner, LLC | 67,889 | 1.21 | 3,270 | 6.51 | ||||
| 2025-08-14 | 13F | EP Wealth Advisors, Inc. | 7,631 | -15.87 | 368 | -11.57 | ||||
| 2025-08-13 | 13F | Northwestern Mutual Wealth Management Co | 8,838 | 0.00 | 426 | 5.20 | ||||
| 2025-08-14 | 13F | Fmr Llc | 16,106 | 3.14 | 776 | 8.54 | ||||
| 2025-07-25 | 13F | Atria Wealth Solutions, Inc. | 5,594 | -97.63 | 269 | -97.51 | ||||
| 2025-07-31 | 13F | Hanlon Investment Management, Inc. | 0 | -100.00 | 0 | |||||
| 2025-08-13 | 13F | Haverford Trust Co | 4,170 | 201 | ||||||
| 2025-08-12 | 13F | J.w. Cole Advisors, Inc. | 34,346 | 0.59 | 1,654 | 5.82 | ||||
| 2025-04-21 | 13F | Ronald Blue Trust, Inc. | 0 | -100.00 | 0 | -100.00 | ||||
| 2025-08-01 | 13F | Envestnet Asset Management Inc | 9,793 | -84.27 | 472 | -83.47 | ||||
| 2025-08-13 | 13F | Congress Wealth Management LLC / DE / | 8,601 | 0.15 | 414 | 5.34 | ||||
| 2025-08-13 | 13F | Townsquare Capital Llc | 0 | -100.00 | 0 | |||||
| 2025-07-10 | 13F | Capital Advisory Group Advisory Services, LLC | 54,293 | -1.67 | 2,615 | 3.48 | ||||
| 2025-05-02 | 13F | Private Wealth Management Group, LLC | 0 | -100.00 | 0 | |||||
| 2025-07-22 | 13F | Merit Financial Group, LLC | 35,778 | 139.49 | 1,723 | 152.27 | ||||
| 2025-07-29 | 13F | Rodgers & Associates, LTD | 5,894 | 0.00 | 284 | 5.20 | ||||
| 2025-07-08 | 13F | Parallel Advisors, LLC | 373 | 0.54 | 18 | 6.25 | ||||
| 2025-07-18 | 13F | Institute for Wealth Management, LLC. | 40,030 | -0.67 | 1,928 | 4.56 | ||||
| 2025-08-11 | 13F | Tidemark, LLC | 808 | -31.58 | 39 | -29.63 | ||||
| 2025-07-10 | 13F | Sovran Advisors, LLC | 4,749 | 231 | ||||||
| 2025-09-04 | 13F/A | Advisor Group Holdings, Inc. | 54,541 | 4.69 | 2,628 | 10.15 | ||||
| 2025-07-31 | 13F | Cambridge Investment Research Advisors, Inc. | 54,635 | 5.29 | 3 | 0.00 | ||||
| 2025-08-14 | 13F | Federation des caisses Desjardins du Quebec | 1,175 | 0.00 | 57 | 5.66 | ||||
| 2025-08-04 | 13F | Northwest Financial Advisors | 5,471 | 0.00 | 264 | 5.20 | ||||
| 2025-08-14 | 13F | Comerica Bank | 547 | -83.41 | 26 | -82.67 | ||||
| 2025-05-08 | 13F | Heritage Wealth Advisors | 0 | -100.00 | 0 | |||||
| 2025-08-04 | 13F | Carret Asset Management, Llc | 6,000 | 0.00 | 289 | 5.47 | ||||
| 2025-08-14 | 13F | Wells Fargo & Company/mn | 203,096 | -52.63 | 9,783 | -50.16 | ||||
| 2025-08-06 | 13F | Commonwealth Equity Services, Llc | 85,698 | -4.64 | 4 | 0.00 | ||||
| 2025-08-12 | 13F | Founders Financial Alliance, LLC | 1,520 | 0.00 | 73 | 5.80 | ||||
| 2025-08-14 | 13F | Bank Of America Corp /de/ | 273,553 | -0.31 | 13,177 | 4.90 | ||||
| 2025-08-05 | 13F | Bank of New York Mellon Corp | 30,306 | 29.45 | 1,460 | 36.23 | ||||
| 2025-08-08 | 13F | Flaharty Asset Management, LLC | 0 | -100.00 | 0 | |||||
| 2025-08-15 | 13F | Morgan Stanley | 721,560 | 7.71 | 34,758 | 13.33 | ||||
| 2025-07-16 | 13F | PFS Partners, LLC | 0 | -100.00 | 0 | |||||
| 2025-08-06 | 13F | AE Wealth Management LLC | 30 | 0.00 | 1 | 0.00 | ||||
| 2025-08-05 | 13F | Bank Of Montreal /can/ | 21,300 | 1.65 | 1,026 | 6.99 | ||||
| 2025-07-29 | 13F | Private Trust Co Na | 6,019 | -6.57 | 290 | -1.70 | ||||
| 2025-08-14 | 13F | Guardian Wealth Advisors, Llc / Nc | 2,520 | 0.00 | 121 | 5.22 | ||||
| 2025-07-16 | 13F | Essex Financial Services, Inc. | 4,900 | 0.00 | 236 | 5.36 | ||||
| 2025-08-14 | 13F | Citadel Advisors Llc | 0 | -100.00 | 0 | |||||
| 2025-08-14 | 13F | Mml Investors Services, Llc | 66,062 | 3.03 | 3 | 50.00 | ||||
| 2025-06-26 | NP | DWAT - Arrow DWA Tactical ETF | 4,658 | 9.09 | 210 | 3.47 | ||||
| 2025-08-12 | 13F | Global Retirement Partners, LLC | 516 | 8,500.00 | 25 | |||||
| 2025-08-14 | 13F | UBS Group AG | 95,577 | -6.49 | 4,604 | -1.60 | ||||
| 2025-04-10 | 13F | Retireful, LLC | 0 | -100.00 | 0 | |||||
| 2025-07-11 | 13F | Arrow Investment Advisors, LLC | 0 | -100.00 | 0 | |||||
| 2025-08-13 | 13F | Everstar Asset Management, LLC | 52,969 | 3.63 | 2,552 | 9.06 | ||||
| 2025-08-04 | 13F | Spire Wealth Management | 679 | 0.44 | 33 | 6.67 | ||||
| 2025-08-11 | 13F | TD Waterhouse Canada Inc. | 95,087 | 36.68 | 4,611 | 44.97 | ||||
| 2025-07-08 | 13F | Nbc Securities, Inc. | 1,650 | 0.00 | 0 | |||||
| 2025-08-12 | 13F | NFP Retirement, Inc. | 114,808 | -0.43 | 5,530 | 4.77 | ||||
| 2025-07-30 | 13F | LGT Financial Advisors LLC | 500 | 0.00 | 24 | 9.09 | ||||
| 2025-08-13 | 13F | Brown Advisory Inc | 12,083 | -0.89 | 582 | 4.30 | ||||
| 2025-08-05 | 13F | American Capital Advisory, LLC | 1,358 | 0.00 | 65 | 4.84 | ||||
| 2025-08-12 | 13F | Jpmorgan Chase & Co | 39,665 | -2.71 | 1,911 | 2.36 | ||||
| 2025-08-08 | 13F | Pnc Financial Services Group, Inc. | 7,327 | 0.25 | 353 | 5.39 | ||||
| 2025-08-14 | 13F | GWM Advisors LLC | 6,379 | -17.26 | 307 | -12.78 | ||||
| 2025-08-15 | 13F | Captrust Financial Advisors | 10,417 | -25.54 | 502 | -21.72 | ||||
| 2025-08-19 | 13F | Advisory Services Network, LLC | 12,373 | 5.07 | 599 | 11.13 | ||||
| 2025-08-14 | 13F | Connecticut Wealth Management, LLC | 5,000 | -37.69 | 241 | -34.60 | ||||
| 2025-07-22 | 13F | Miracle Mile Advisors, LLC | 23,066 | -0.28 | 1,111 | 5.01 | ||||
| 2025-08-07 | 13F | Allworth Financial LP | 2,605 | 0.08 | 125 | 8.70 | ||||
| 2025-08-11 | 13F | CFS Investment Advisory Services, LLC | 20,403 | 10.38 | 1 | |||||
| 2025-08-05 | 13F | Tsfg, Llc | 1,213 | 0.41 | 0 | |||||
| 2025-08-14 | 13F | Royal Bank Of Canada | 121,712 | -1.18 | 5,863 | 3.97 | ||||
| 2025-07-25 | 13F | Cwm, Llc | 689 | 58.03 | 0 | |||||
| 2025-08-05 | 13F | Atlas Private Wealth Advisors | 97,911 | -10.93 | 4,716 | -6.28 | ||||
| 2025-07-28 | 13F | Harbour Investments, Inc. | 1,041 | 0.39 | 50 | 6.38 | ||||
| 2025-07-28 | 13F | Axxcess Wealth Management, Llc | 0 | -100.00 | 0 | |||||
| 2025-04-22 | 13F | Consolidated Planning Corp | 0 | -100.00 | 0 | |||||
| 2025-08-01 | 13F | Biltmore Family Office, LLC | 352 | 0.00 | 17 | 0.00 | ||||
| 2025-08-08 | 13F | Citizens Financial Group Inc/ri | 119,377 | -0.07 | 5,750 | 5.16 | ||||
| 2025-08-13 | 13F | Truvestments Capital Llc | 16,765 | 0.17 | 808 | 5.35 | ||||
| 2025-08-14 | 13F | Goldman Sachs Group Inc | 26,580 | 1,280 | ||||||
| 2025-08-14 | 13F | Fort Point Capital Partners LLC | 22,946 | 0.25 | 1,105 | 5.54 | ||||
| 2025-08-14 | 13F | Warren Averett Asset Management, LLC | 48,146 | -4.24 | 2,319 | 0.78 | ||||
| 2025-08-12 | 13F | LPL Financial LLC | 1,967,217 | 18.19 | 94,761 | 24.36 | ||||
| 2025-08-12 | 13F | Charles Schwab Investment Management Inc | 8,101 | -2.95 | 390 | 2.09 | ||||
| 2025-08-06 | 13F | Modera Wealth Management, LLC | 4,495 | 0.00 | 217 | 5.37 | ||||
| 2025-08-12 | 13F | MAI Capital Management | 38,309 | -0.79 | 1,845 | 4.41 | ||||
| 2025-08-13 | 13F | Jones Financial Companies Lllp | 139,855 | 27.00 | 6,678 | 33.88 | ||||
| 2025-08-14 | 13F | Integrated Wealth Concepts LLC | 4,646 | -9.86 | 224 | -5.11 | ||||
| 2025-04-22 | 13F/A | NorthRock Partners, LLC | 0 | -100.00 | 0 | -100.00 | ||||
| 2025-08-08 | 13F | Avantax Advisory Services, Inc. | 32,700 | -15.35 | 1,575 | -10.92 | ||||
| 2025-08-14 | 13F | Raymond James Financial Inc | 846,279 | 0.43 | 40,765 | 5.67 | ||||
| 2025-08-08 | 13F | Strategies Wealth Advisors, LLC | 23,454 | 0.06 | 1,130 | 5.22 | ||||
| 2025-07-17 | 13F | Janney Montgomery Scott LLC | 8,148 | 0.23 | 0 | |||||
| 2025-08-13 | 13F | Baird Financial Group, Inc. | 84,938 | -2.59 | 4,091 | 2.51 | ||||
| 2025-07-29 | 13F | Koshinski Asset Management, Inc. | 14,170 | 0.00 | 683 | 5.25 | ||||
| 2025-07-29 | 13F | Stratos Wealth Partners, LTD. | 11,888 | -45.74 | 573 | -42.97 | ||||
| 2025-08-06 | 13F | Golden State Wealth Management, LLC | 1,054 | -43.36 | 51 | -41.18 | ||||
| 2025-07-15 | 13F | Revisor Wealth Management LLC | 4,664 | 0.00 | 228 | 6.57 | ||||
| 2025-08-12 | 13F | Deutsche Bank Ag\ | 12,915 | 0.00 | 622 | 5.25 | ||||
| 2025-07-10 | 13F | Focus Financial Network, Inc. | 113,378 | 0.41 | 5,461 | 5.65 | ||||
| 2025-07-15 | 13F | Genesis Wealth Advisors, LLC | 0 | -100.00 | 0 | -100.00 | ||||
| 2025-08-14 | 13F | Ameriprise Financial Inc | 19,191 | -2.49 | 924 | 2.55 | ||||
| 2025-05-12 | 13F | Independent Advisor Alliance | 0 | -100.00 | 0 | |||||
| 2025-08-13 | 13F | Russell Investments Group, Ltd. | 179 | 952.94 | 9 | |||||
| 2025-07-29 | 13F | Financial Guidance Group, Inc. | 5,120 | 0.00 | 247 | 5.13 | ||||
| 2025-08-14 | 13F | Stifel Financial Corp | 9,441 | -51.61 | 455 | -49.16 |