Mga Batayang Estadistika
| Pemilik Institusional | 124 total, 123 long only, 0 short only, 1 long/short - change of 12.61% MRQ |
| Alokasi Portofolio Rata-rata | 0.0666 % - change of -24.76% MRQ |
| Saham Institusional (Jangka Panjang) | 3,509,800 (ex 13D/G) - change of 0.08MM shares 2.44% MRQ |
| Nilai Institusional (Jangka Panjang) | $ 190,480 USD ($1000) |
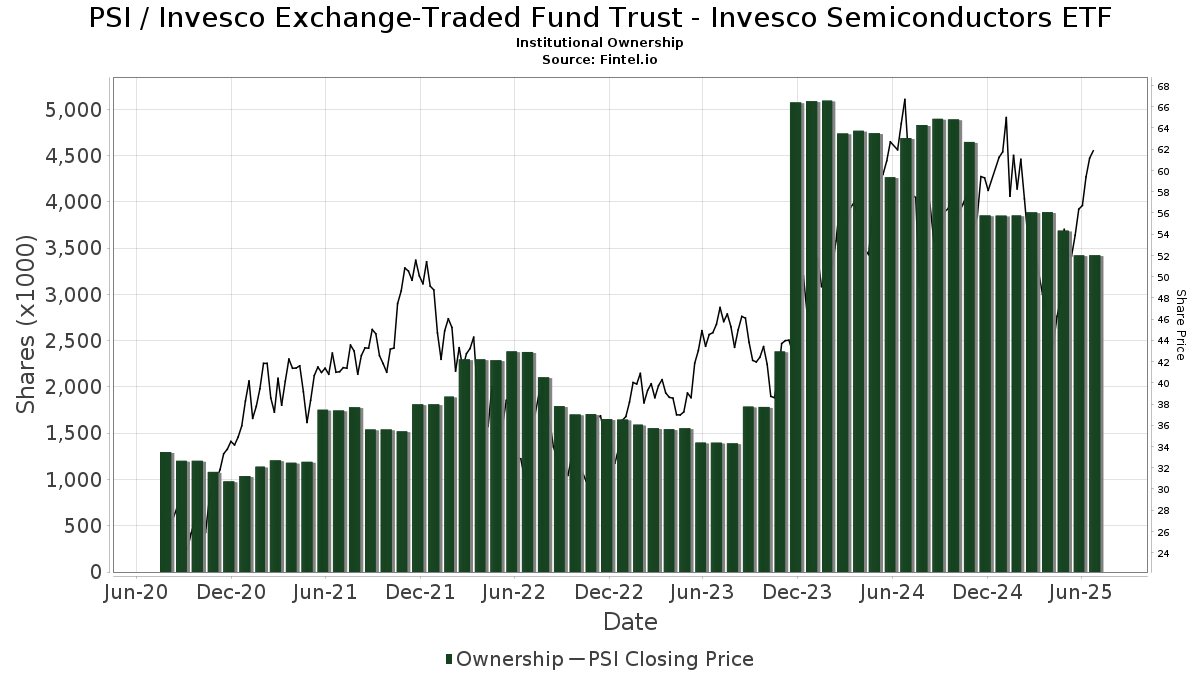
Kepemilikan Institusional dan Pemegang Saham
Invesco Exchange-Traded Fund Trust - Invesco Semiconductors ETF (US:PSI) memiliki 124 pemilik institusional dan pemegang saham yang telah mengajukan formulir 13D/G atau 13F kepada Komisi Bursa Efek (Securities Exchange Commission/SEC). Lembaga-lembaga ini memegang total 3,509,800 saham. Pemegang saham terbesar meliputi LPL Financial LLC, Morgan Stanley, Captrust Financial Advisors, Cetera Investment Advisers, Bank Of America Corp /de/, HighTower Advisors, LLC, Ameriprise Financial Inc, Envestnet Asset Management Inc, UBS Group AG, and Mercer Global Advisors Inc /adv .
Struktur kepemilikan institusional Invesco Exchange-Traded Fund Trust - Invesco Semiconductors ETF (ARCA:PSI) menunjukkan posisi terkini di perusahaan oleh institusi dan dana, serta perubahan terbaru dalam ukuran posisi. Pemegang saham utama dapat mencakup investor individu, reksa dana, dana lindung nilai, atau institusi. Jadwal 13D menunjukkan bahwa investor memegang (atau pernah memegang) lebih dari 5% saham perusahaan dan bermaksud (atau pernah bermaksud) untuk secara aktif mengejar perubahan strategi bisnis. Jadwal 13G menunjukkan investasi pasif lebih dari 5%.
The share price as of September 3, 2025 is 61.52 / share. Previously, on September 4, 2024, the share price was 53.33 / share. This represents an increase of 15.36% over that period.
Skor Sentimen Dana
Skor Sentimen Dana (sebelumnya dikenal sebagai Skor Akumulasi Kepemilikan) menemukan saham-saham yang paling banyak dibeli oleh dana. Ini adalah hasil dari model kuantitatif multi-faktor yang canggih yang mengidentifikasi perusahaan dengan tingkat akumulasi institusional tertinggi. Model penilaian menggunakan kombinasi dari total peningkatan pemilik yang diungkapkan, perubahan dalam alokasi portofolio pada pemilik tersebut, dan metrik lainnya. Angka berkisar dari 0 hingga 100, dengan angka yang lebih tinggi menunjukkan tingkat akumulasi yang lebih tinggi dibandingkan dengan perusahaan sejenisnya, dan 50 adalah rata-ratanya.
Frekuensi Pembaruan: Setiap Hari
Lihat Ownership Explorer, yang menyediakan daftar perusahaan dengan peringkat tertinggi.
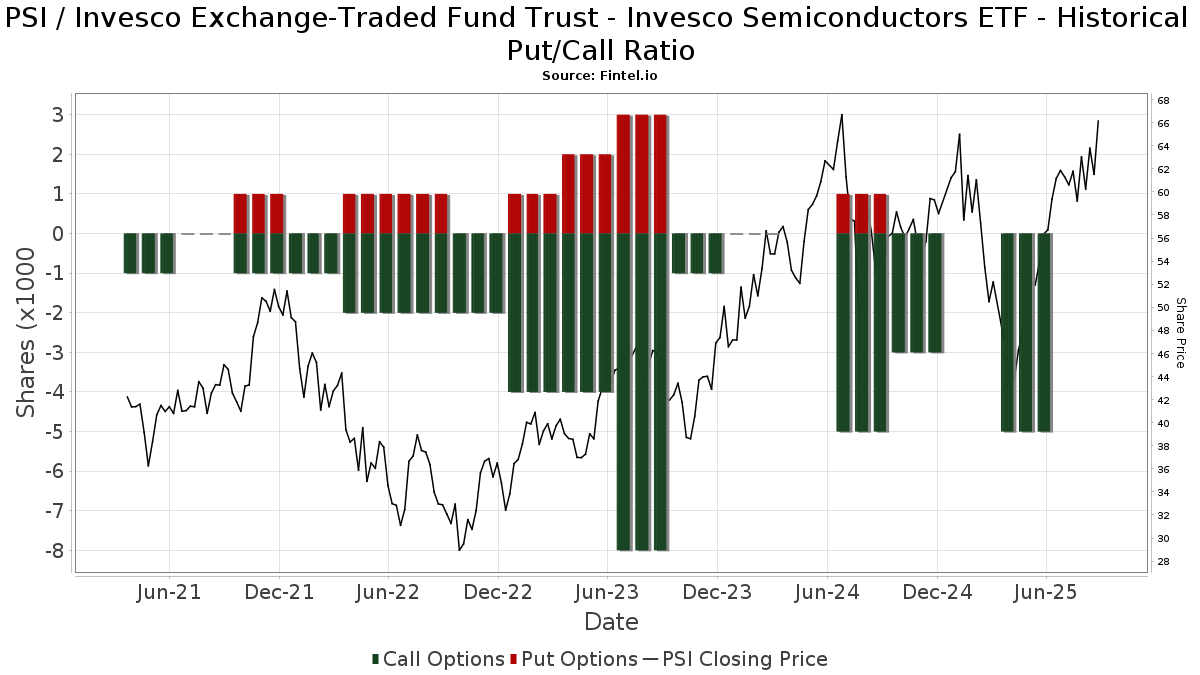
Rasio Put/Call Institusional
Selain melaporkan isu ekuitas dan utang standar, institusi dengan aset di bawah manajemen lebih dari 100 juta dolar AS juga harus mengungkapkan kepemilikan opsi put dan call mereka. Karena opsi put umumnya menunjukkan sentimen negatif, dan opsi call menunjukkan sentimen positif, kita dapat mengetahui sentimen institusional secara keseluruhan dengan memplot rasio put terhadap call. Grafik di sebelah kanan memplot rasio put/call historis untuk instrumen ini.
Menggunakan Rasio Put/Call sebagai indikator sentimen investor mengatasi salah satu kekurangan utama dari penggunaan total kepemilikan institusional, yaitu sejumlah besar aset yang dikelola diinvestasikan secara pasif untuk melacak indeks. Dana yang dikelola secara pasif biasanya tidak membeli opsi, sehingga indikator rasio put/call lebih akurat dalam melacak sentimen dana yang dikelola secara aktif.
Pengajuan 13F dan NPORT
Detail pada pengajuan 13F tersedia gratis. Detail pada pengajuan NP memerlukan keanggotaan premium. Baris berwarna hijau menunjukkan posisi baru. Baris berwarna merah menunjukkan posisi yang sudah ditutup. Klik tautan ini ikon untuk melihat riwayat transaksi selengkapnya.
Tingkatkan
untuk membuka data premium dan mengekspor ke Excel ![]() .
.
| Tanggal File | Sumber | Investor | Ketik | Presyo ng Avg (Silangan) |
Saham | Δ Saham (%) |
Dilaporkan Nilai ($1000) |
Nilai Δ (%) |
Alokasi Port (%) |
|
|---|---|---|---|---|---|---|---|---|---|---|
| 2025-07-24 | 13F | WMG Financial Advisors, LLC | 4,413 | -0.45 | 265 | 25.71 | ||||
| 2025-08-06 | 13F | Aspect Partners, LLC | 911 | 0.00 | 55 | 25.58 | ||||
| 2025-08-14 | 13F | Susquehanna International Group, Llp | 19,542 | 232.86 | 1,172 | 321.22 | ||||
| 2025-05-14 | 13F | Capital Wealth Alliance, LLC | 0 | -100.00 | 0 | |||||
| 2025-08-14 | 13F | CoreCap Advisors, LLC | 564 | 0.00 | 34 | 26.92 | ||||
| 2025-08-14 | 13F | Wells Fargo & Company/mn | 2,101 | 249.00 | 126 | 346.43 | ||||
| 2025-08-14 | 13F | Federation des caisses Desjardins du Quebec | 130 | 8 | ||||||
| 2025-05-02 | 13F | Signaturefd, Llc | 0 | -100.00 | 0 | |||||
| 2025-08-14 | 13F | Bank Of America Corp /de/ | 188,920 | -0.63 | 11,328 | 25.76 | ||||
| 2025-07-10 | 13F | Wealth Enhancement Advisory Services, Llc | 3,264 | -16.09 | 202 | -9.87 | ||||
| 2025-08-13 | 13F | Millington Financial Advisors, LLC | 0 | -100.00 | 0 | |||||
| 2025-07-18 | 13F | Truist Financial Corp | 5,448 | -0.13 | 327 | 26.36 | ||||
| 2025-08-11 | 13F | Private Advisor Group, LLC | 44,679 | 7.96 | 2,679 | 36.63 | ||||
| 2025-08-12 | 13F | LPL Financial LLC | 335,368 | -43.78 | 20,109 | -28.86 | ||||
| 2025-08-04 | 13F | Flagship Harbor Advisors, Llc | 8,049 | -2.31 | 483 | 23.59 | ||||
| 2025-08-25 | 13F/A | Neuberger Berman Group LLC | 4,323 | 0.00 | 259 | 26.96 | ||||
| 2025-08-14 | 13F | IHT Wealth Management, LLC | 4,954 | 297 | ||||||
| 2025-08-14 | 13F | Comerica Bank | 47 | 0.00 | 3 | 0.00 | ||||
| 2025-08-14 | 13F | Arete Wealth Advisors, LLC | 34,741 | 2 | ||||||
| 2025-07-24 | 13F | Ulland Investment Advisors, LLC | 5,010 | -51.01 | 0 | |||||
| 2025-07-22 | 13F | Valley National Advisers Inc | 2,071 | 0.00 | 0 | |||||
| 2025-08-12 | 13F | Steward Partners Investment Advisory, Llc | 415 | 0.00 | 25 | 26.32 | ||||
| 2025-07-22 | 13F | Wealthcare Advisory Partners LLC | 4,161 | 249 | ||||||
| 2025-07-23 | 13F | Meitav Dash Investments Ltd | 91,446 | 0.00 | 5,483 | 26.57 | ||||
| 2025-05-12 | 13F | Independent Advisor Alliance | 0 | -100.00 | 0 | |||||
| 2025-08-14 | 13F | Bnp Paribas Arbitrage, Sa | 40,000 | 2,398 | ||||||
| 2025-07-30 | 13F | Evermay Wealth Management Llc | 0 | -100.00 | 0 | |||||
| 2025-05-13 | 13F | Tocqueville Asset Management L.p. | 0 | -100.00 | 0 | |||||
| 2025-04-23 | 13F | Mascagni Wealth Management, Inc. | 0 | -100.00 | 0 | -100.00 | ||||
| 2025-08-08 | 13F | Larson Financial Group LLC | 51 | 0.00 | 3 | 50.00 | ||||
| 2025-08-07 | 13F | CENTRAL TRUST Co | 0 | -100.00 | 0 | -100.00 | ||||
| 2025-03-21 | 13F | Prostatis Group LLC | 0 | -100.00 | 0 | -100.00 | ||||
| 2025-08-14 | 13F | First Foundation Advisors | 7,022 | 0.00 | 421 | 26.81 | ||||
| 2025-08-14 | 13F | Goldman Sachs Group Inc | 80,371 | 62.45 | 4,819 | 105.59 | ||||
| 2025-07-25 | 13F | Valley Brook Capital Group, Inc. | 10,385 | -6.05 | 623 | 18.93 | ||||
| 2025-08-08 | 13F | WASHINGTON TRUST Co | 0 | -100.00 | 0 | |||||
| 2025-07-22 | 13F | Belpointe Asset Management LLC | 9,462 | 0.00 | 567 | 26.56 | ||||
| 2025-08-11 | 13F | Cornerstone Planning Group LLC | 24 | 1 | ||||||
| 2025-08-12 | 13F | Financial Advocates Investment Management | 0 | -100.00 | 0 | |||||
| 2025-08-14 | 13F | Colony Group, LLC | 5,256 | 0.11 | 315 | 27.02 | ||||
| 2025-07-29 | 13F | Harbor Asset Planning, Inc. | 647 | 39 | ||||||
| 2025-07-31 | 13F | Cambridge Investment Research Advisors, Inc. | 95,123 | -6.00 | 6 | 25.00 | ||||
| 2025-08-04 | 13F | WNY Asset Management, LLC | 3,914 | 235 | ||||||
| 2025-07-30 | 13F | Capstone Triton Financial Group, LLC | 18,530 | 22.31 | 1,111 | 26.68 | ||||
| 2025-07-25 | 13F | Atria Wealth Solutions, Inc. | 9,591 | -56.13 | 575 | -44.44 | ||||
| 2025-05-05 | 13F | J.w. Cole Advisors, Inc. | 0 | -100.00 | 0 | -100.00 | ||||
| 2025-08-14 | 13F | Mercer Global Advisors Inc /adv | 112,225 | 2.62 | 6,729 | 29.86 | ||||
| 2025-08-11 | 13F | Principal Securities, Inc. | 17,958 | -4.92 | 1,077 | -1.56 | ||||
| 2025-08-14 | 13F | UBS Group AG | 137,632 | -21.15 | 8,252 | -0.22 | ||||
| 2025-08-13 | 13F | Cheviot Value Management, LLC | 300 | 0.00 | 18 | 28.57 | ||||
| 2025-08-15 | 13F | Morgan Stanley | 247,211 | -1.77 | 14,823 | 24.31 | ||||
| 2025-08-19 | 13F | Advisory Services Network, LLC | 48,932 | -5.22 | 2,911 | 19.01 | ||||
| 2025-08-15 | 13F | Captrust Financial Advisors | 243,386 | 33.16 | 14,593 | 68.53 | ||||
| 2025-07-24 | 13F | Blair William & Co/il | 8 | 0.00 | 0 | |||||
| 2025-07-30 | 13F | Whittier Trust Co Of Nevada Inc | 2,972 | 178 | ||||||
| 2025-07-22 | 13F | Grimes & Company, Inc. | 8,553 | 513 | ||||||
| 2025-08-08 | 13F | Cetera Investment Advisers | 207,094 | 5.96 | 12,417 | 34.09 | ||||
| 2025-08-05 | 13F | Tsfg, Llc | 0 | -100.00 | 0 | |||||
| 2025-04-25 | 13F | Sovran Advisors, LLC | 0 | -100.00 | 0 | |||||
| 2025-05-02 | 13F | Transcendent Capital Group LLC | 0 | -100.00 | 0 | |||||
| 2025-08-13 | 13F | Summit Financial, LLC | 19,656 | 1,179 | ||||||
| 2025-08-14 | 13F | Sunbelt Securities, Inc. | 31 | 0.00 | 2 | 0.00 | ||||
| 2025-08-14 | 13F | Money Concepts Capital Corp | 4,187 | 251 | ||||||
| 2025-07-15 | 13F | Main Street Group, LTD | 121 | 0.00 | 7 | 40.00 | ||||
| 2025-08-14 | 13F | Jane Street Group, Llc | 14,722 | 29.19 | 883 | 63.64 | ||||
| 2025-08-15 | 13F | Tower Research Capital LLC (TRC) | 11,916 | 169.96 | 714 | 241.63 | ||||
| 2025-07-15 | 13F | Carr Financial Group Corp | 0 | -100.00 | 0 | |||||
| 2025-08-06 | 13F | Prospera Financial Services Inc | 14,857 | 3.22 | 891 | 30.65 | ||||
| 2025-07-15 | 13F | Capstone Wealth Management Group LLC | 3,452 | 207 | ||||||
| 2025-08-06 | 13F | AE Wealth Management LLC | 9,746 | 5.02 | 584 | 33.03 | ||||
| 2025-08-13 | 13F | Northwestern Mutual Wealth Management Co | 35,207 | -33.78 | 2,111 | -16.20 | ||||
| 2025-07-31 | 13F | Sage Mountain Advisors LLC | 190 | 0.00 | 11 | 22.22 | ||||
| 2025-07-30 | 13F | Strategic Blueprint, LLC | 25,044 | 1.93 | 1,502 | 28.95 | ||||
| 2025-08-11 | 13F | HighTower Advisors, LLC | 176,111 | 3,894.35 | 10,560 | 4,976.44 | ||||
| 2025-07-18 | 13F | Institute for Wealth Management, LLC. | 4,365 | 0.00 | 262 | 26.70 | ||||
| 2025-08-11 | 13F | Aptus Capital Advisors, LLC | 50 | 100.00 | 3 | 100.00 | ||||
| 2025-07-18 | 13F | PFG Investments, LLC | 8,970 | 0.92 | 538 | 27.55 | ||||
| 2025-08-12 | 13F | CIBC Private Wealth Group, LLC | 795 | 0.00 | 48 | 51.61 | ||||
| 2025-07-29 | 13F | Private Trust Co Na | 1,049 | 0.00 | 63 | 26.53 | ||||
| 2025-08-01 | 13F | Envestnet Asset Management Inc | 141,803 | -7.71 | 8,503 | 16.80 | ||||
| 2025-08-14 | 13F | Lebenthal Global Advisors, LLC | 3,950 | 237 | ||||||
| 2025-07-08 | 13F | Nbc Securities, Inc. | 957 | -5.90 | 0 | |||||
| 2025-08-11 | 13F | SFI Advisors, LLC | 13,048 | -8.38 | 782 | 16.02 | ||||
| 2025-08-14 | 13F | Integrated Wealth Concepts LLC | 14,917 | 0.61 | 894 | 27.35 | ||||
| 2025-08-18 | 13F/A | National Bank Of Canada /fi/ | 82,405 | 4.27 | 4,941 | 31.87 | ||||
| 2025-08-12 | 13F | Argent Trust Co | 4,803 | 0.00 | 288 | 26.43 | ||||
| 2025-04-28 | 13F | Strategic Financial Concepts, LLC | 0 | -100.00 | 0 | -100.00 | ||||
| 2025-05-06 | 13F | Proficio Capital Partners LLC | 0 | -100.00 | 0 | -100.00 | ||||
| 2025-08-05 | 13F | Bank Of Montreal /can/ | 482 | -45.54 | 29 | -31.71 | ||||
| 2025-08-14 | 13F | Ameriprise Financial Inc | 151,834 | 833.90 | 9,129 | 1,085.45 | ||||
| 2025-07-21 | 13F | Ameriflex Group, Inc. | 17 | 0.00 | 1 | |||||
| 2025-08-19 | 13F | National Asset Management, Inc. | 12,129 | -49.14 | 727 | -47.36 | ||||
| 2025-05-16 | 13F | Coppell Advisory Solutions LLC | 0 | -100.00 | 0 | |||||
| 2025-07-11 | 13F | Farther Finance Advisors, LLC | 1,005 | 458.33 | 60 | 650.00 | ||||
| 2025-08-14 | 13F | Citadel Advisors Llc | 12,949 | 776 | ||||||
| 2025-07-28 | 13F | Mission Hills Financial Advisory, LLC | 15,524 | -1.95 | 931 | 24.00 | ||||
| 2025-07-31 | 13F | Oppenheimer & Co Inc | 10,763 | 75.78 | 645 | 122.41 | ||||
| 2025-08-04 | 13F | Kovack Advisors, Inc. | 4,987 | -8.78 | 299 | 15.44 | ||||
| 2025-05-06 | 13F | Venturi Wealth Management, LLC | 0 | -100.00 | 0 | |||||
| 2025-08-07 | 13F | Atala Financial Inc | 0 | -100.00 | 0 | |||||
| 2025-08-07 | 13F | PFG Advisors | 5,229 | 314 | ||||||
| 2025-05-12 | 13F | Y.D. More Investments Ltd | 0 | -100.00 | 0 | |||||
| 2025-08-12 | 13F | Jpmorgan Chase & Co | 3,744 | 0.00 | 224 | 26.55 | ||||
| 2025-08-14 | 13F | Raymond James Financial Inc | 99,852 | -16.58 | 5,987 | 5.57 | ||||
| 2025-08-12 | 13F | O'shaughnessy Asset Management, Llc | 0 | -100.00 | 0 | |||||
| 2025-09-04 | 13F/A | Advisor Group Holdings, Inc. | 62,568 | -20.81 | 3,751 | 0.21 | ||||
| 2025-04-21 | 13F | SILVER OAK SECURITIES, Inc | 0 | -100.00 | 0 | |||||
| 2025-08-11 | 13F | Capital Square, LLC | 5,812 | 1.75 | 359 | 32.59 | ||||
| 2025-08-14 | 13F | Benjamin Edwards Inc | 7,354 | 441 | ||||||
| 2025-07-14 | 13F | Sowell Financial Services LLC | 0 | -100.00 | 0 | |||||
| 2025-08-14 | 13F | Mariner, LLC | 8,500 | 7.36 | 510 | 35.73 | ||||
| 2025-07-16 | 13F | Perigon Wealth Management, LLC | 4,405 | 0.00 | 264 | 26.92 | ||||
| 2025-08-06 | 13F | Commonwealth Equity Services, Llc | 65,759 | -4.04 | 4 | 0.00 | ||||
| 2025-08-06 | 13F | Mark Sheptoff Financial Planning, Llc | 175 | 0.00 | 10 | 25.00 | ||||
| 2025-05-01 | 13F | Fifth Third Securities, Inc. | 0 | -100.00 | 0 | |||||
| 2025-08-14 | 13F | Fmr Llc | 2,023 | -23.83 | 121 | -3.20 | ||||
| 2025-08-14 | 13F | Royal Bank Of Canada | 74,651 | -18.21 | 4,476 | 3.49 | ||||
| 2025-08-12 | 13F | Yahav Achim Ve Achayot - Provident Funds Management Co Ltd. | 19,122 | 0.00 | 1,147 | 26.74 | ||||
| 2025-05-15 | 13F | StoneX Group Inc. | 0 | -100.00 | 0 | -100.00 | ||||
| 2025-08-04 | 13F | Spire Wealth Management | 2,456 | -1.92 | 147 | 24.58 | ||||
| 2025-08-12 | 13F | Proequities, Inc. | 0 | 0 | ||||||
| 2025-08-08 | 13F | Pnc Financial Services Group, Inc. | 9,070 | -18.66 | 544 | 2.84 | ||||
| 2025-08-12 | 13F | Global Retirement Partners, LLC | 1,408 | 0.00 | 84 | 3.70 | ||||
| 2025-05-12 | 13F | Citigroup Inc | 0 | -100.00 | 0 | |||||
| 2025-08-07 | 13F | Kestra Private Wealth Services, Llc | 5,196 | -23.96 | 312 | -3.72 | ||||
| 2025-07-17 | 13F | Sound Income Strategies, LLC | 29 | 2 | ||||||
| 2025-07-18 | 13F | McGuire Investment Group, LLC | 4,698 | 0.00 | 282 | 26.58 | ||||
| 2025-08-14 | 13F | Optiver Holding B.V. | 24,207 | 1,451 | ||||||
| 2025-05-15 | 13F | CAPROCK Group, Inc. | 12,564 | 0.00 | 595 | -18.16 | ||||
| 2025-07-28 | 13F | Harbour Investments, Inc. | 4,657 | -9.68 | 279 | 14.34 | ||||
| 2025-07-21 | 13F | DHJJ Financial Advisors, Ltd. | 1 | 0.00 | 0 | |||||
| 2025-08-06 | 13F | Golden State Wealth Management, LLC | 75 | 0.00 | 5 | 33.33 | ||||
| 2025-08-14 | 13F | EP Wealth Advisors, Inc. | 7,856 | -47.79 | 471 | -33.85 | ||||
| 2025-08-14 | 13F | KKM Financial LLC | 6,850 | -10.02 | 411 | 13.89 | ||||
| 2025-08-01 | 13F | Belvedere Trading LLC | Call | 5,600 | 336 | |||||
| 2025-08-01 | 13F | Belvedere Trading LLC | Put | 700 | 42 | |||||
| 2025-05-01 | 13F | WESPAC Advisors, LLC | 0 | -100.00 | 0 | |||||
| 2025-08-05 | 13F | Simplex Trading, Llc | 753 | 818.29 | 0 | |||||
| 2025-08-14 | 13F | Mml Investors Services, Llc | 85,783 | -29.05 | 5 | 0.00 | ||||
| 2025-08-04 | 13F | Bay Colony Advisory Group, Inc d/b/a Bay Colony Advisors | 9,279 | -1.56 | 556 | 23.83 | ||||
| 2025-08-19 | 13F | Newbridge Financial Services Group, Inc. | 180 | -21.74 | 11 | 0.00 | ||||
| 2025-07-24 | 13F | Us Bancorp \de\ | 229 | 0.00 | 14 | 30.00 | ||||
| 2025-08-27 | NP | FFOX - FundX Future Fund Opportunities ETF | 510 | 31 | ||||||
| 2025-08-11 | 13F | VSM Wealth Advisory, LLC | 425 | 0.00 | 25 | 25.00 | ||||
| 2025-08-13 | 13F | Jones Financial Companies Lllp | 21,588 | 31.11 | 1,294 | 64.84 | ||||
| 2025-08-13 | 13F | Flow Traders U.s. Llc | 6,095 | 0 | ||||||
| 2025-08-08 | 13F | Mv Capital Management, Inc. | 750 | 0.00 | 45 | 25.71 | ||||
| 2025-08-13 | 13F | M Holdings Securities, Inc. | 20,326 | 1 | ||||||
| 2025-07-17 | 13F | Janney Montgomery Scott LLC | 3,725 | -29.98 | 0 | |||||
| 2025-07-29 | 13F | Koshinski Asset Management, Inc. | 8,448 | -3.26 | 507 | 22.52 | ||||
| 2025-04-29 | 13F | Capital Investment Advisory Services, LLC | 0 | -100.00 | 0 | -100.00 | ||||
| 2025-07-25 | 13F | Cwm, Llc | 9,664 | 31.70 | 1 | |||||
| 2025-08-14 | 13F | Stifel Financial Corp | 14,605 | 876 | ||||||
| 2025-08-14 | 13F | DRW Securities, LLC | 14,024 | 22.16 | 841 | 54.70 | ||||
| 2025-08-08 | 13F | Creative Planning | 5,859 | 351 | ||||||
| 2025-08-05 | 13F | GPS Wealth Strategies Group, LLC | 50 | -28.57 | 3 | -33.33 | ||||
| 2025-04-23 | 13F | Golden State Equity Partners | 0 | -100.00 | 0 |
Other Listings
| MX:PSI |